
Optimization Snapshot – Customizable Optimization Data And Analytics Overview
Route4Me’s Optimization Snapshot is an easy-to-use analytics tool that consolidates key metrics and insights from your Optimizations in one place. It gives you quick access to detailed route analytics, destination data, proof of visit information, and other critical details. With each Optimization Snapshot, you can track route performance, review essential data more efficiently, and make informed decisions that boost operational accuracy and customer satisfaction. Use this guide to get started.
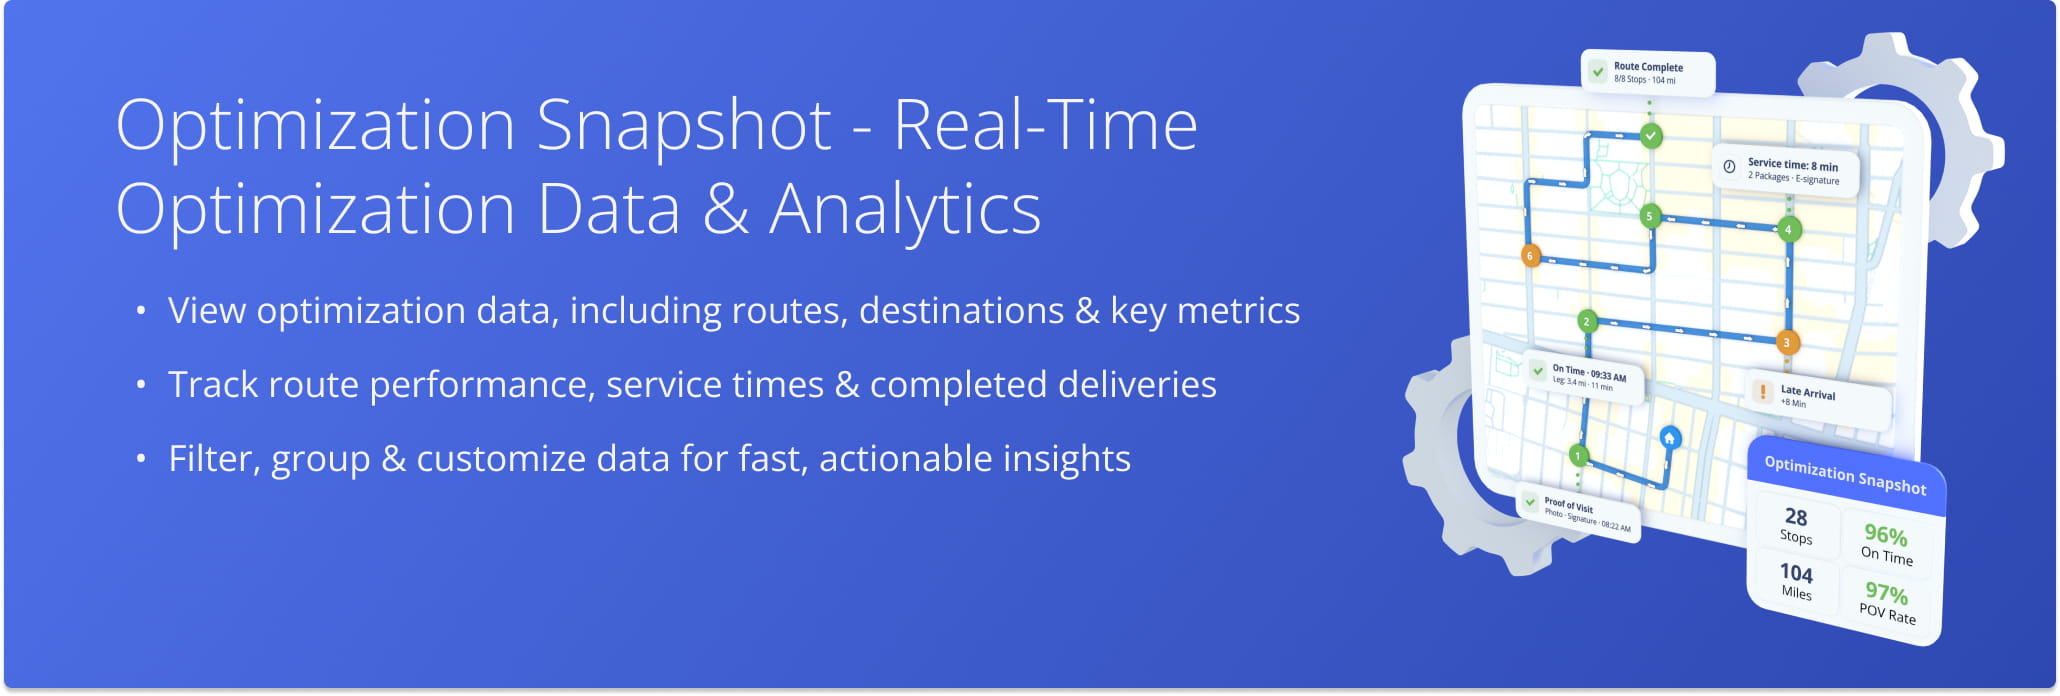
NOTE: Optimization Snapshots are currently available only by request. To enable this feature, contact Customer Support.
Table of Contents
Access Optimization Snapshots – View Optimization Data And Analytics
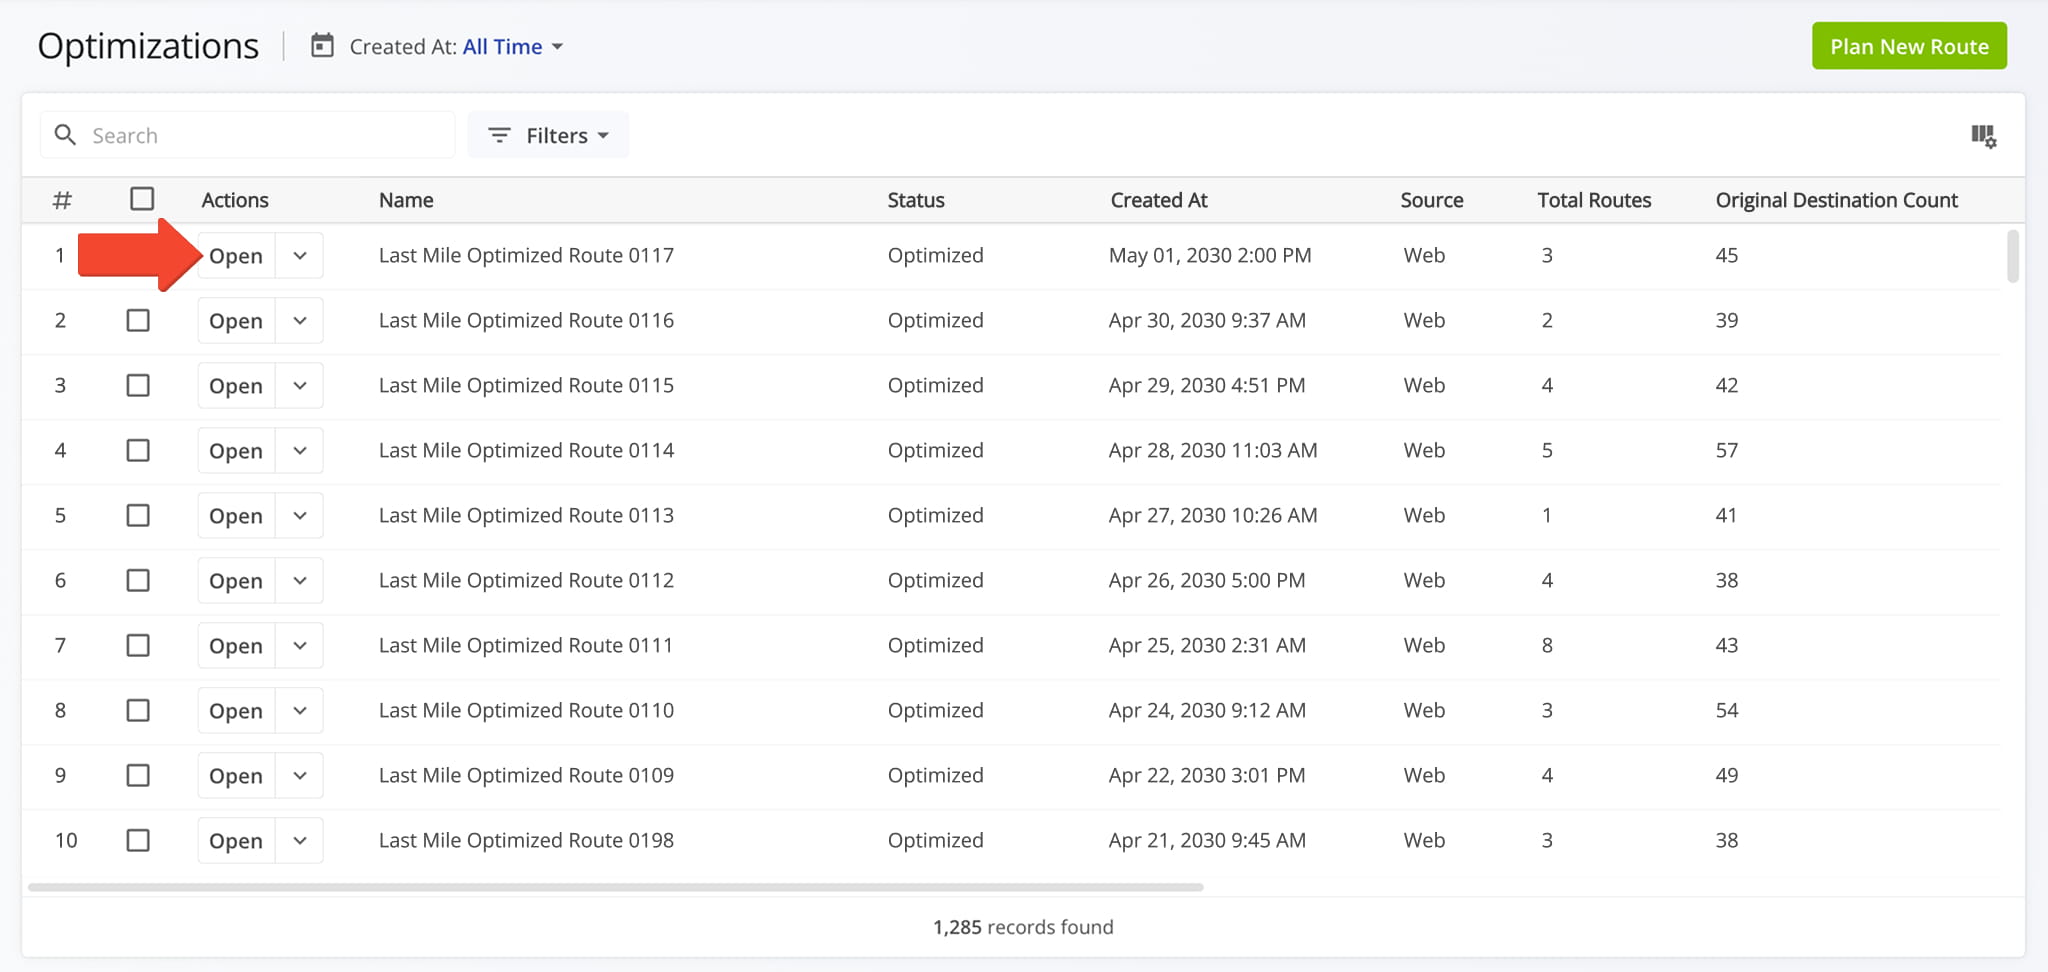
To open the Optimization Snapshot for any optimization, select “Dynamic Routing” > “Optimizations” from the Navigation Menu. Then, from the Optimizations Page, click “Open” next to the desired optimization.
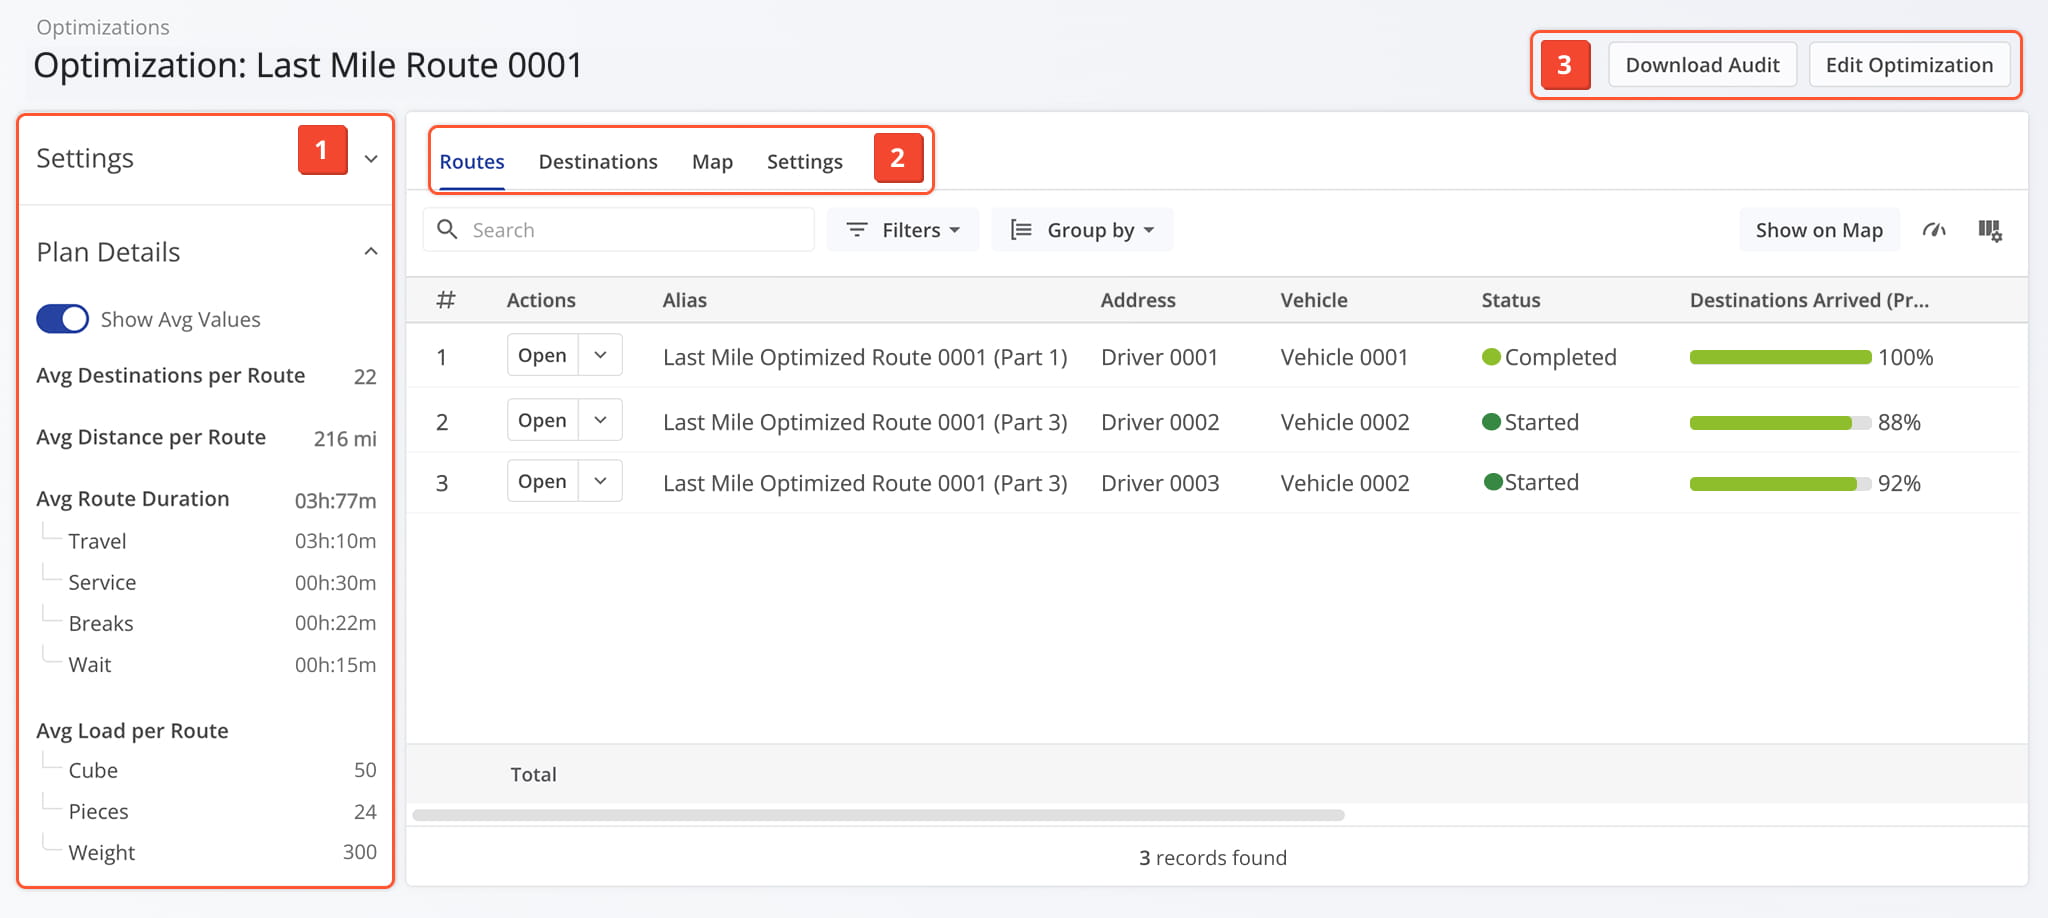
Once the Snapshot is opened, you’ll see a detailed interface designed to help you review and manage all Optimization data:
- Summary Panel: Overview of key information about the Optimization including its Settings and Plan Details.
- Optimization Data Tabs: Switch between tabs to explore Optimization-related data, which you can filter and customize as needed.
- Audit Download and Edit Controls: Click “Download Audit” to get an HTML file documenting the Optimization’s results, including all planned routes, serviced Orders, and Unrouted Destinations. Click “Edit Optimization” to modify Optimization details.
Optimization Profile Overview – Location, Details, Performance Metrics
Review Optimization Summary – Detailed Snapshot Information Panel
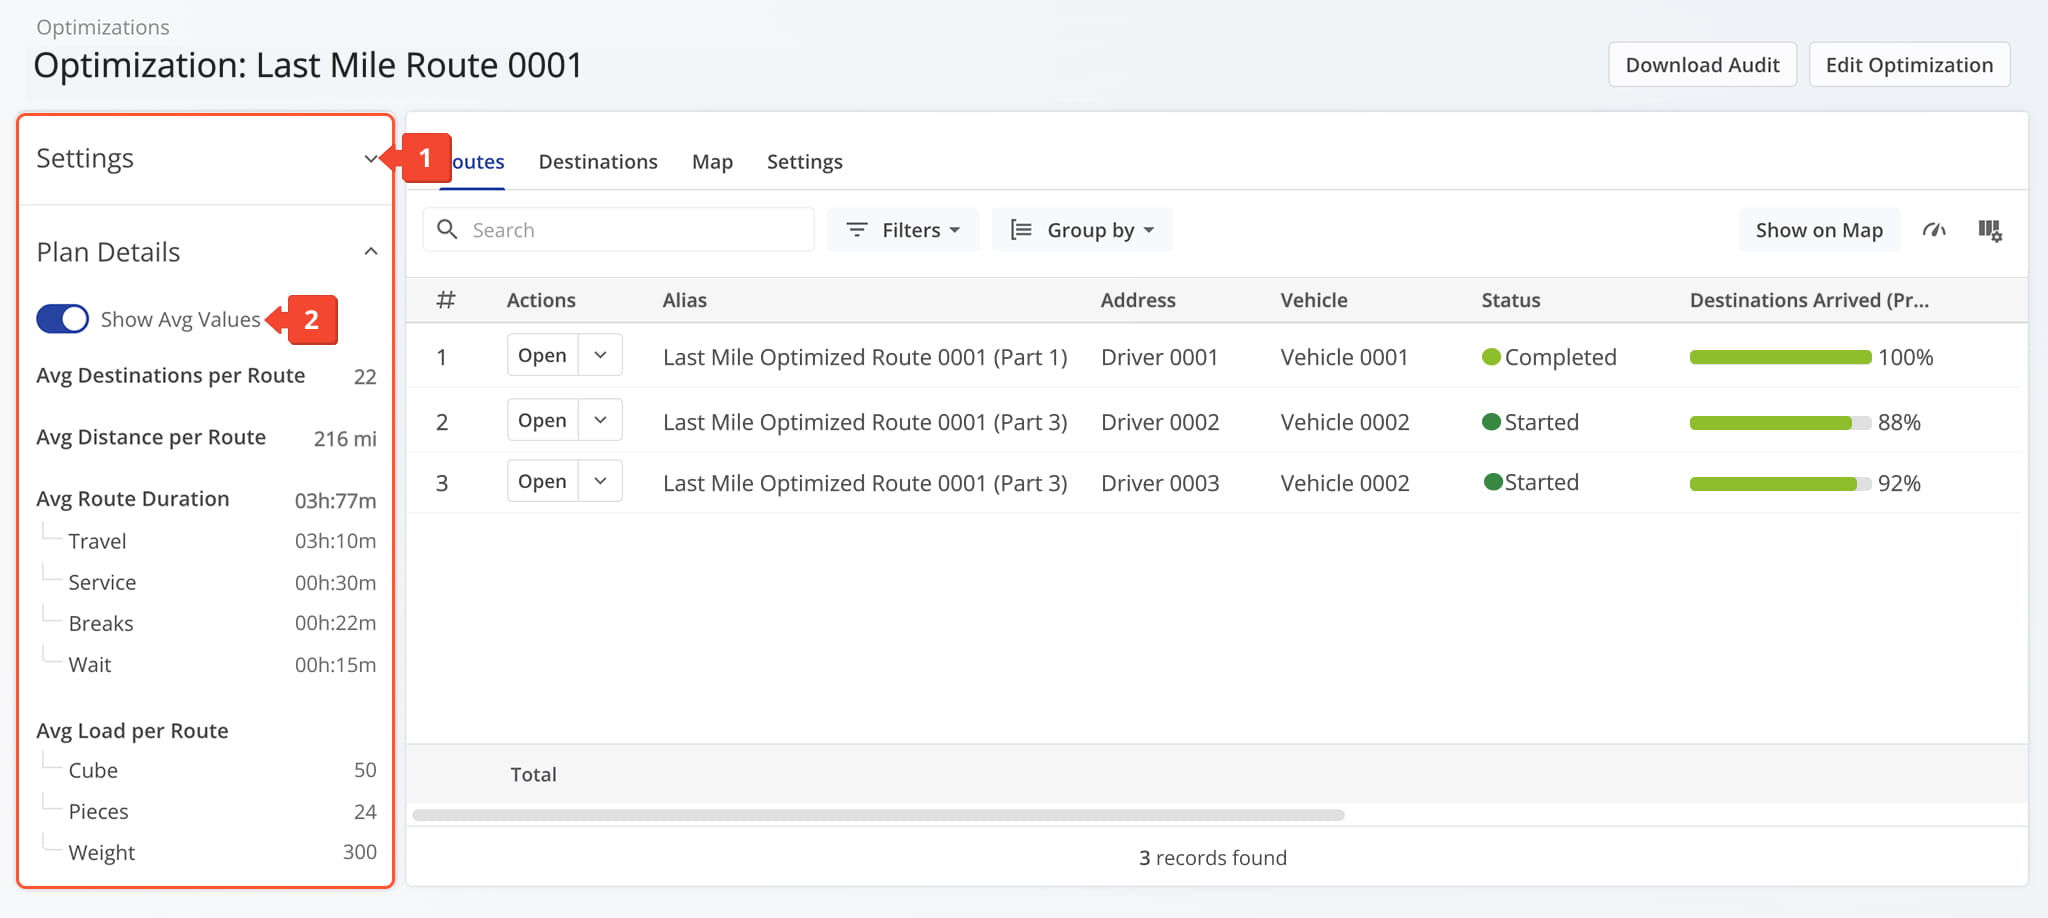
The Optimization Summary Panel displays key metrics, including scheduling settings, route limits, totals, and performance data across the entire plan. From this panel you can:
- Click the Up/Down Arrow next to “Settings” or “Plan Details” to expand each section and review associated data.
- In the “Plan Details” section, toggle “Show Avg Values” to view average metrics per route in addition to total optimization values.
See the table below for a complete list of metrics available in the Optimization Information Panel.
Optimization Summary Panel
Route Performance Metrics Panel – Vehicle Route And Time Performance Overview
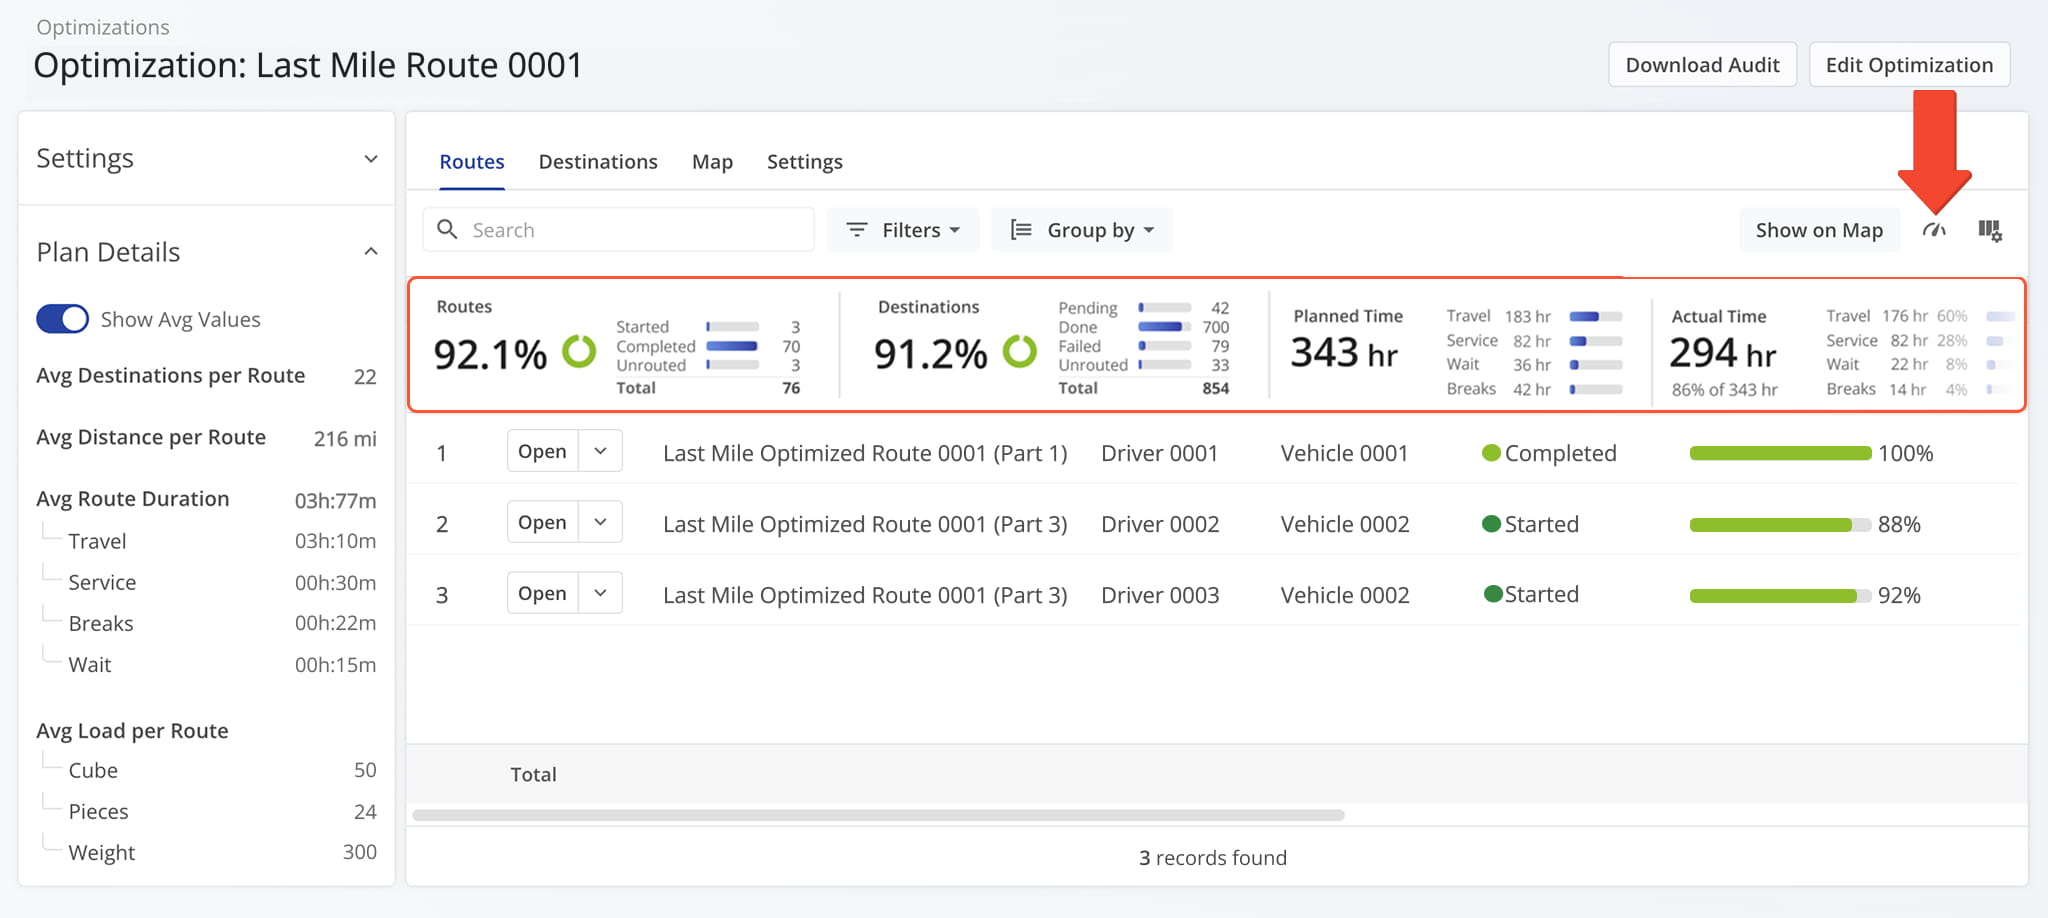
Click the Metrics Icon in the upper-right corner to open the Performance Metrics panel, where you can monitor progress, track efficiency, and evaluate operational performance across routes.
This panel, available from the Routes tab, provides a summary of planned routes and destinations, along with a side-by-side breakdown of planned and actual time for travel, service, wait, and breaks.
Optimization Snapshot Categories – Optimization Analytics Data Tabs
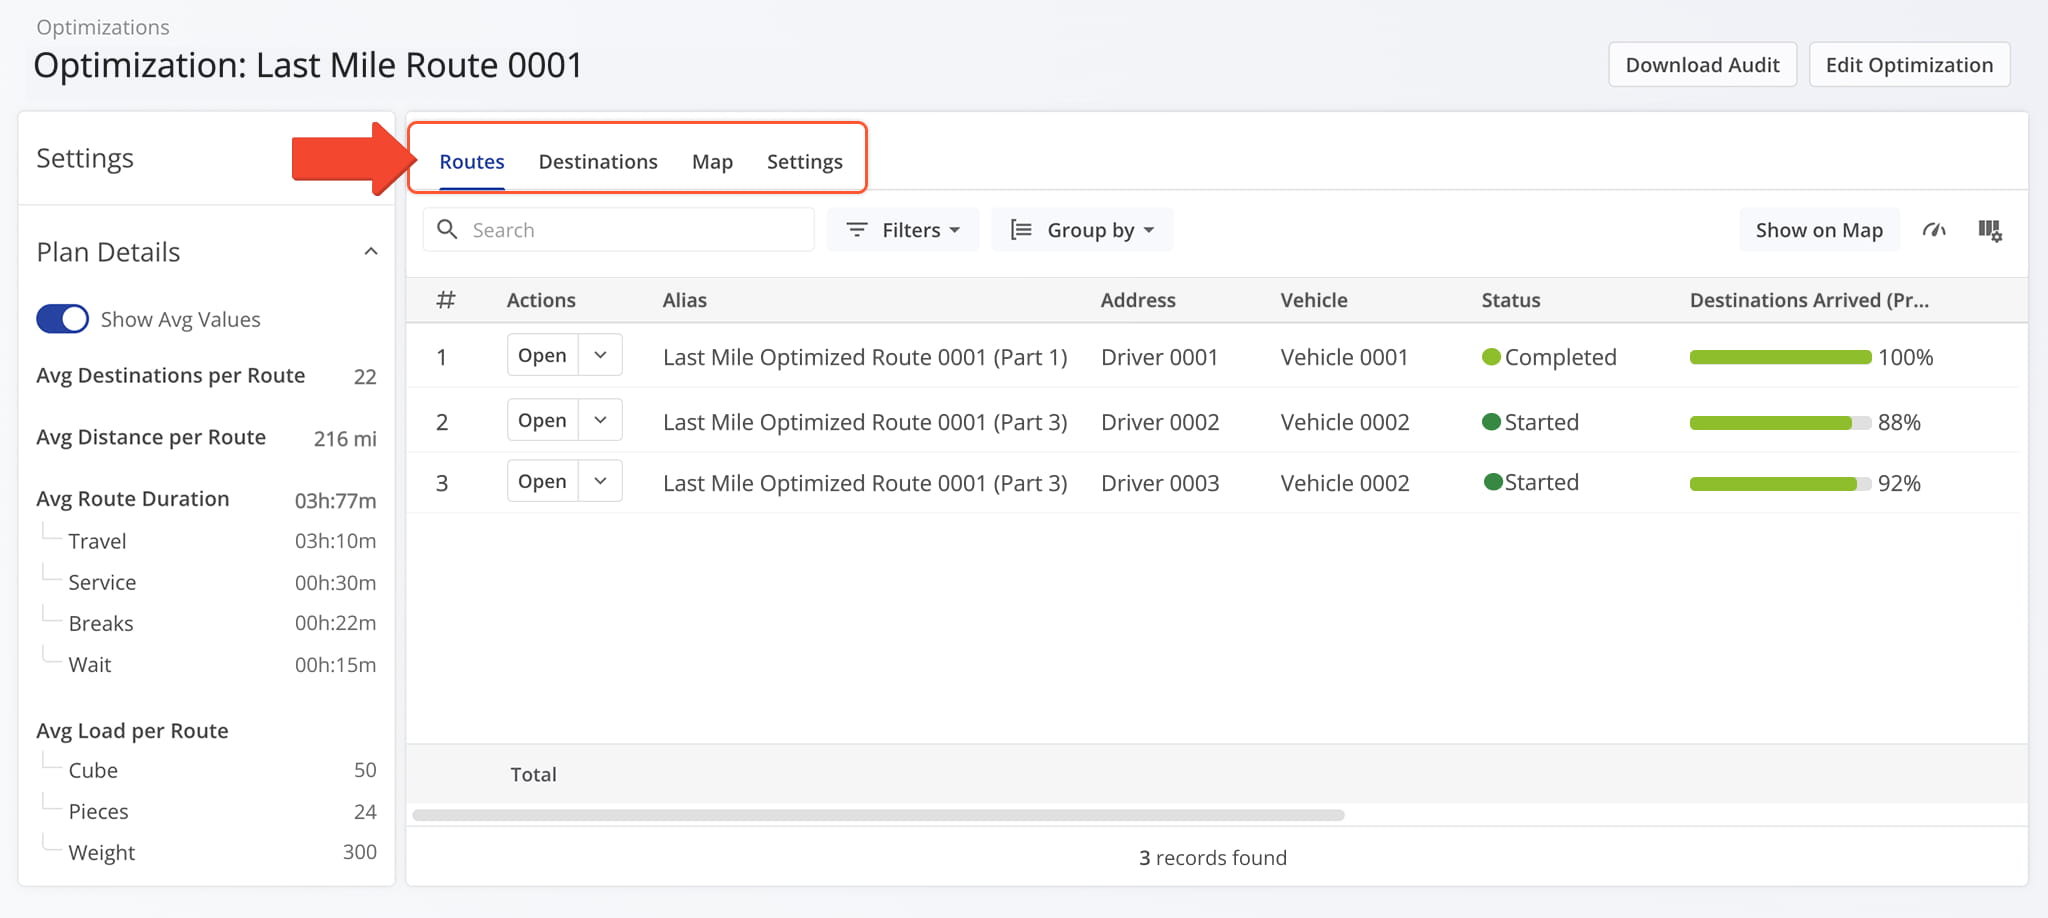
The Optimization Snapshot is organized into tabs, each corresponding to a specific category of data described below.
Routes Tab – Route Information And Insights
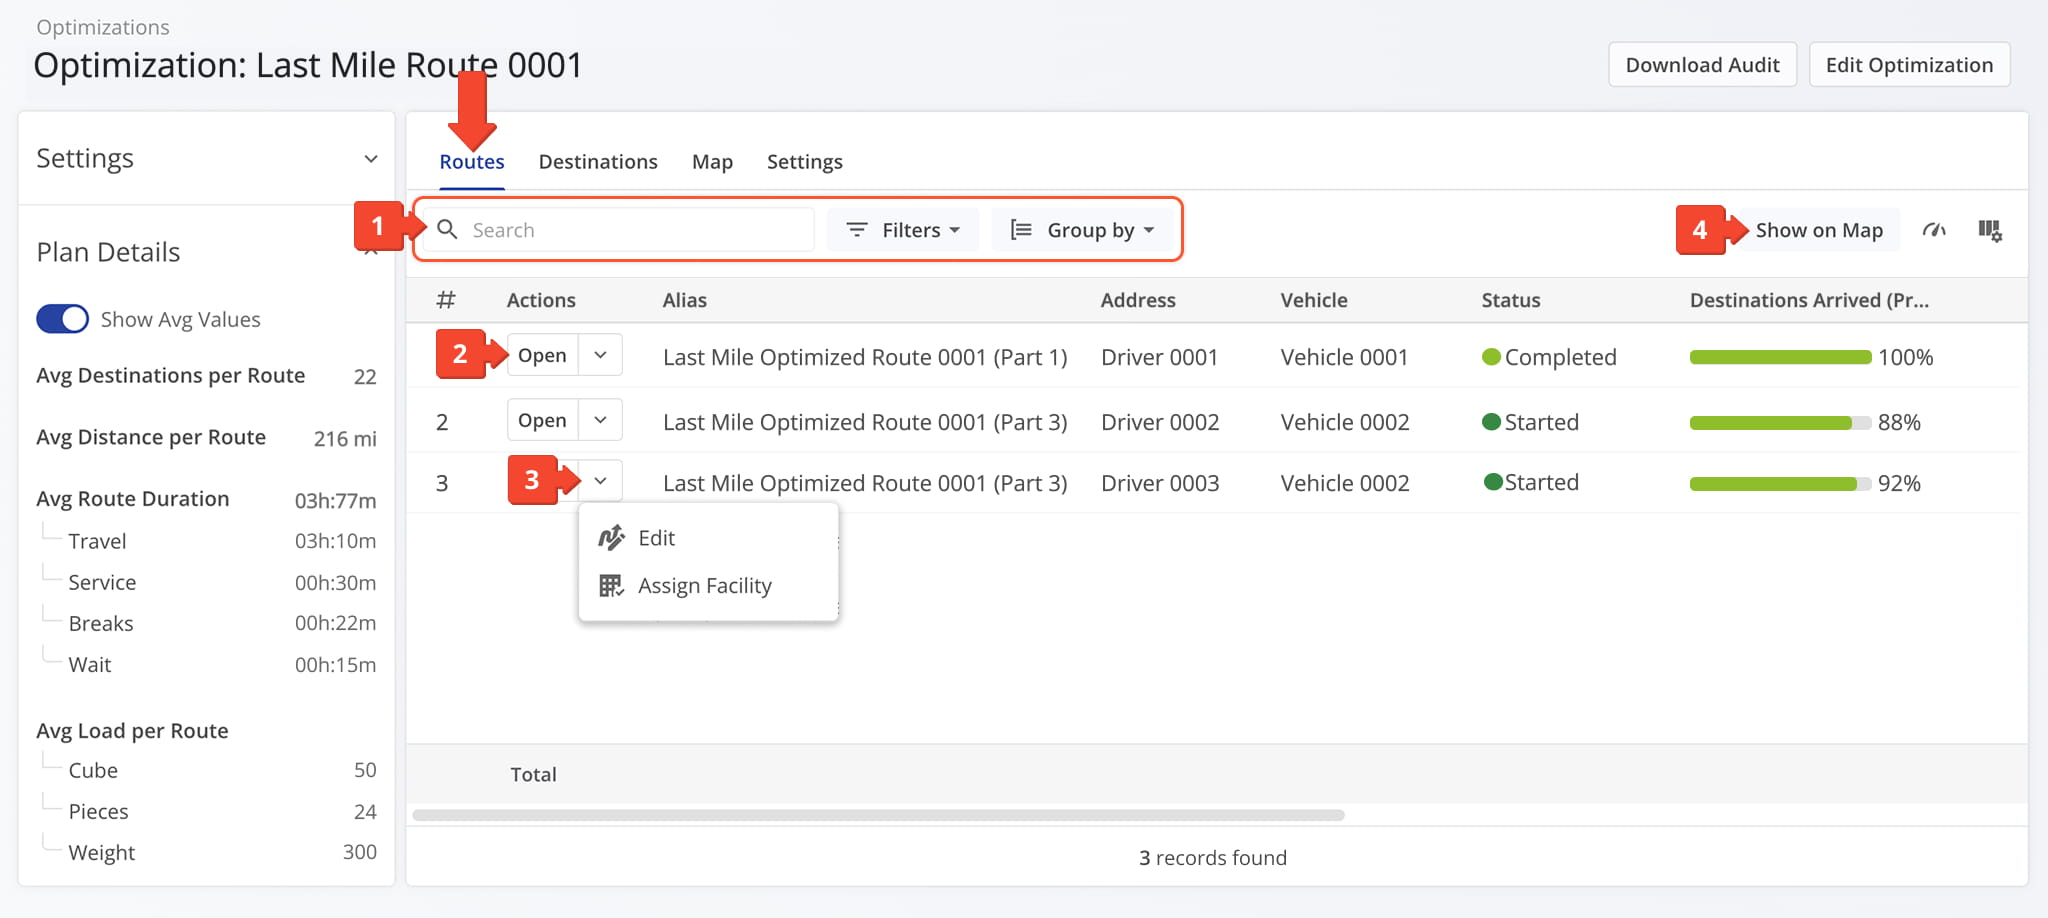
The Routes tab displays all routes associated with the selected Optimization in a customizable data table. From this tab you can:
- Use the Search field to locate specific routes, “Group By” to organize them, or filters (described below) to narrow displayed data.
See the table below for a full list of filters. - Click “Open” next to a route to access its Route Snapshot.
- Click the Down Arrow next to a route to either “Edit” it or click “Assign Facility” to assign the route to a Final Mile Facility.
- Click “Show on Map” to view the route in the Route Editor, where you can also make modifications.
Routes Filters
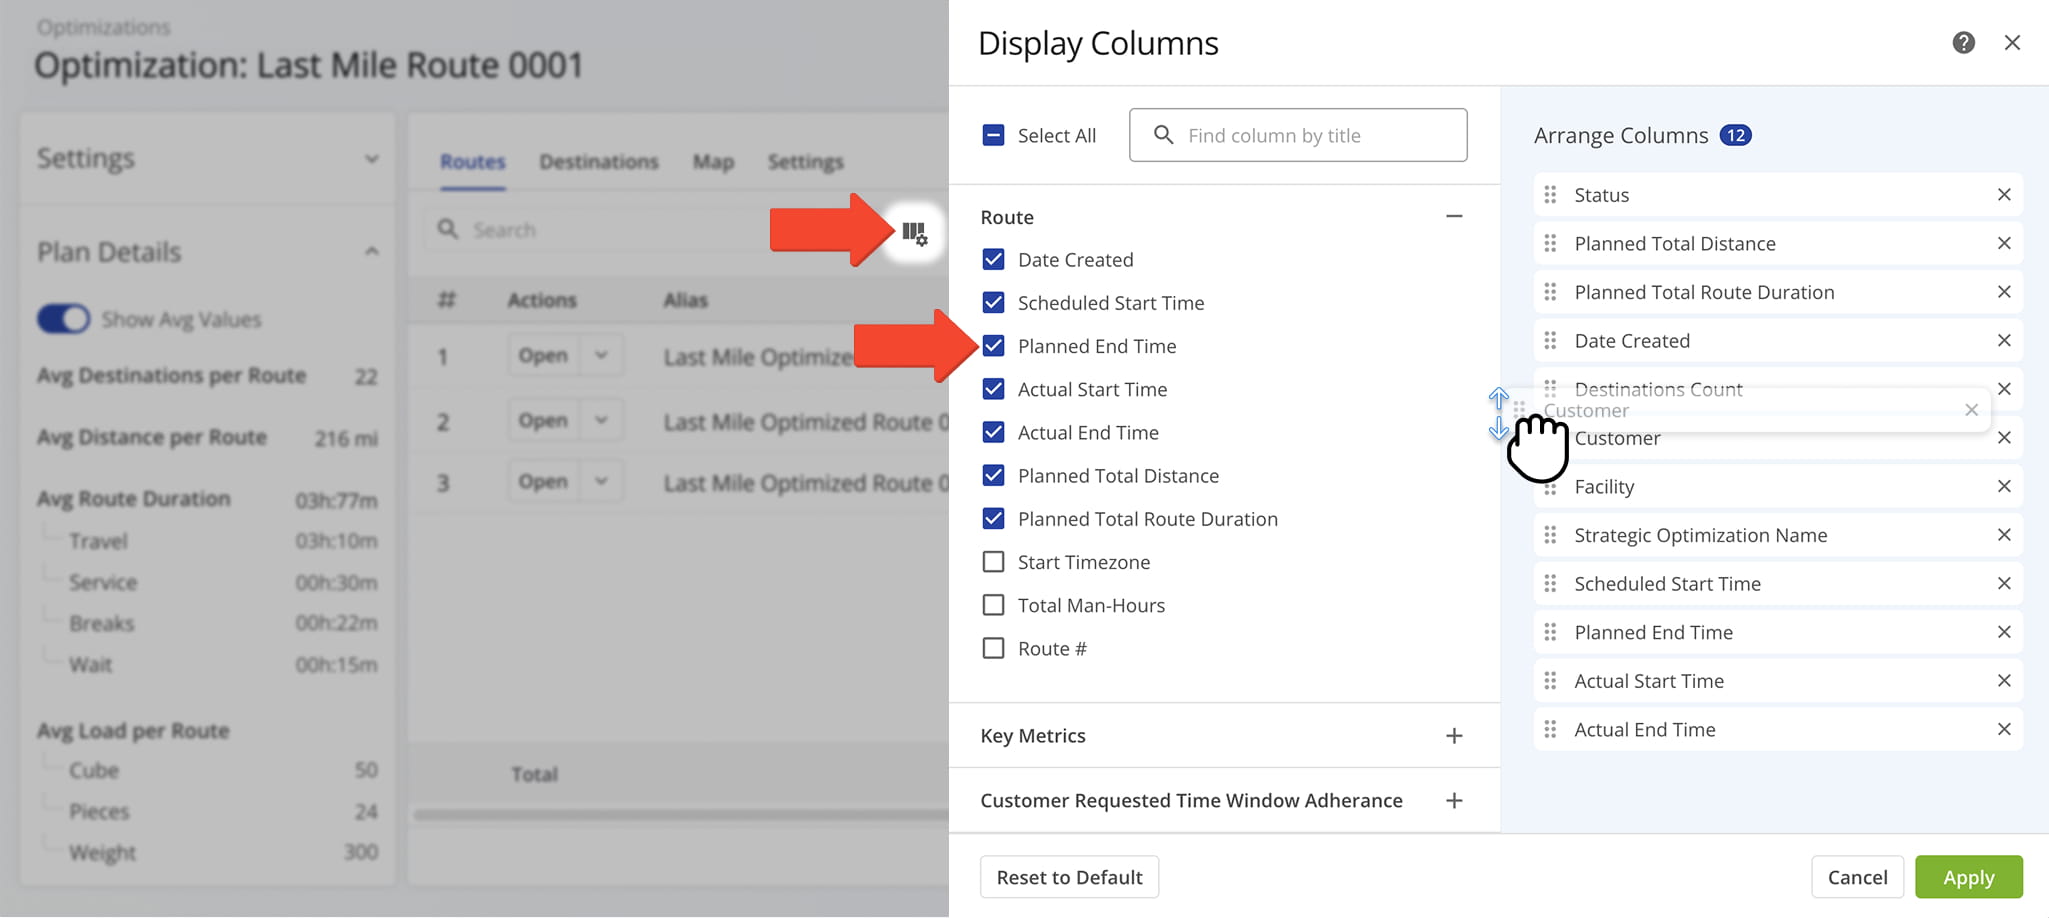
You can also customize the data displayed in the table. Click the Column Icon in the upper right corner to select which route data fields appear and adjust their order to suit your operational needs.
The table below provides an overview of all available data columns, which you can reorder by dragging them into place.
Routes Data Columns
Destinations Tab – Stop Details And Operational Data
From the Destinations tab, you can view all destinations included in the selected Optimization. From this tab you can:
- Use the Search field to locate specific routes, “Group By” to organize them, or filters (described below) to narrow displayed data.
See the table below for a full list of filters. - Click “Open” next to a route to access its Destination Snapshot.
- Click the Down Arrow next to a route and select “Open Route” (open its Route Snapshot) or “Edit Route” (open it in the Route Editor).
- Click “Show on Map” to view the destinations in the Route Editor, where you can also make modifications.
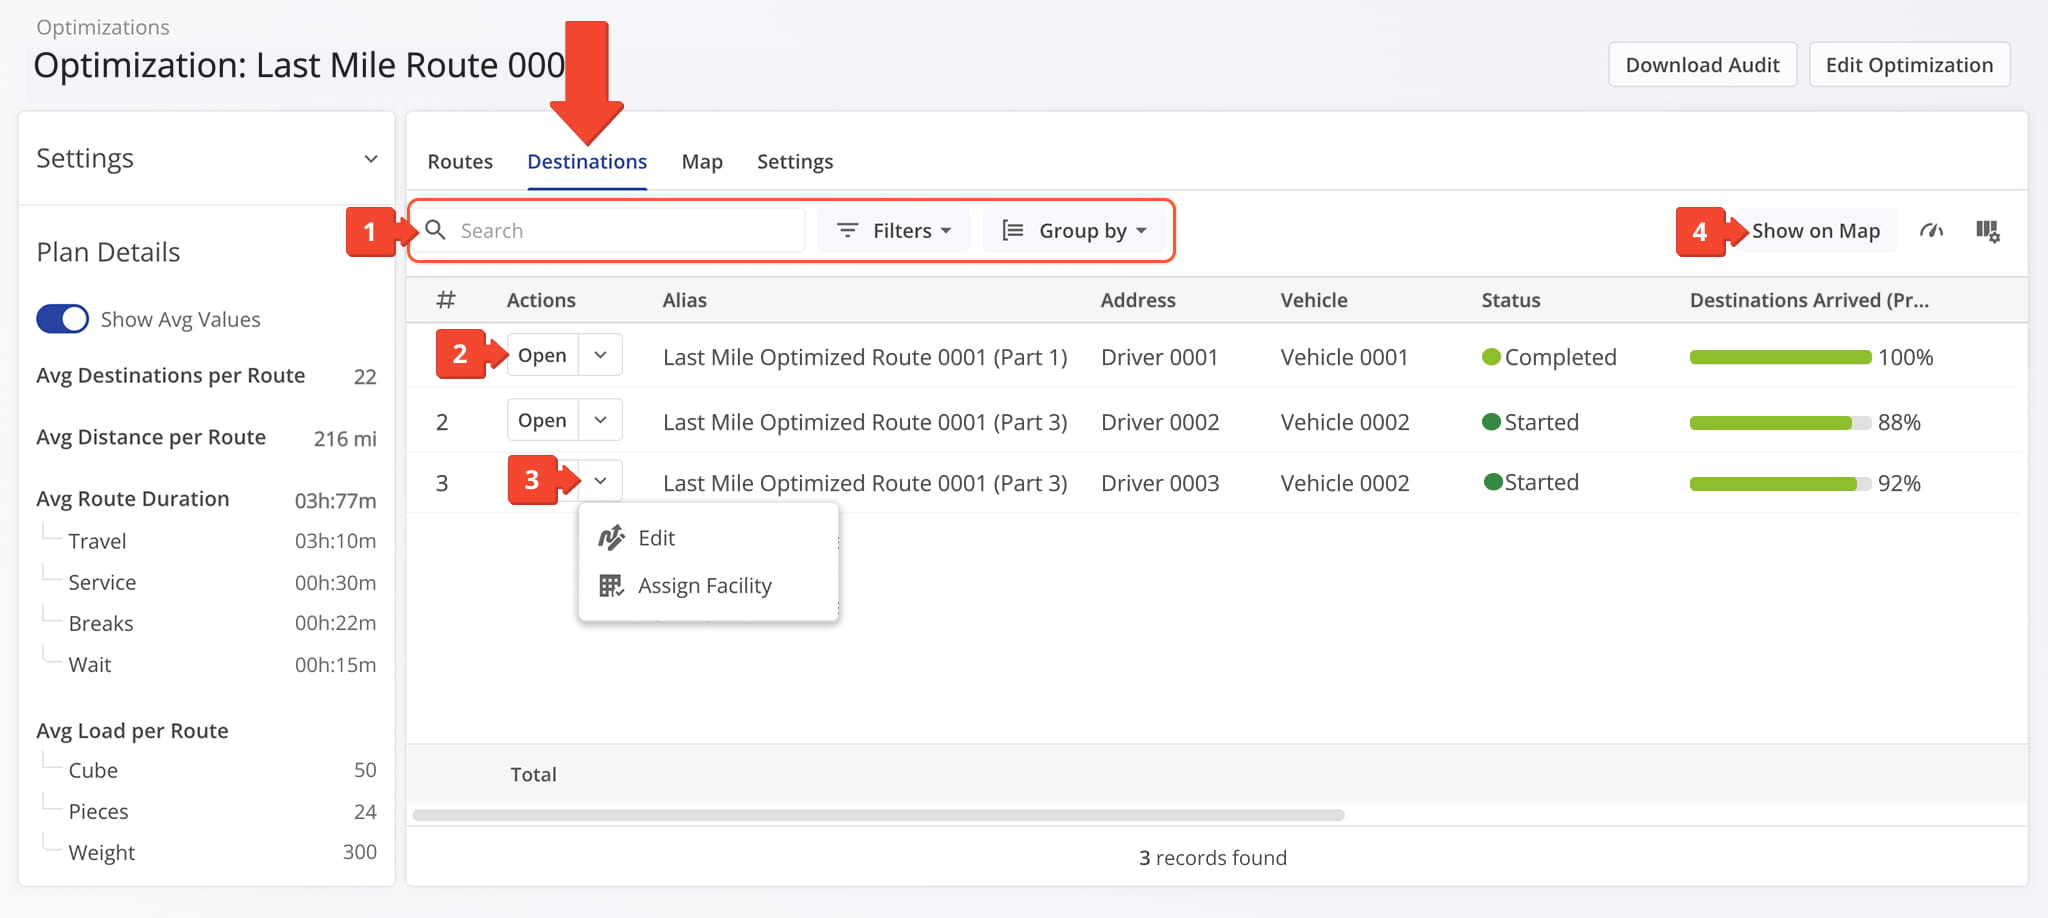
Destinations Filters
You can also customize the data displayed in the table. Click the Column Icon in the upper right corner to select which route data fields appear and adjust their order to suit your operational needs.
The table below provides an overview of all available data columns, which you can reorder by dragging them into place.
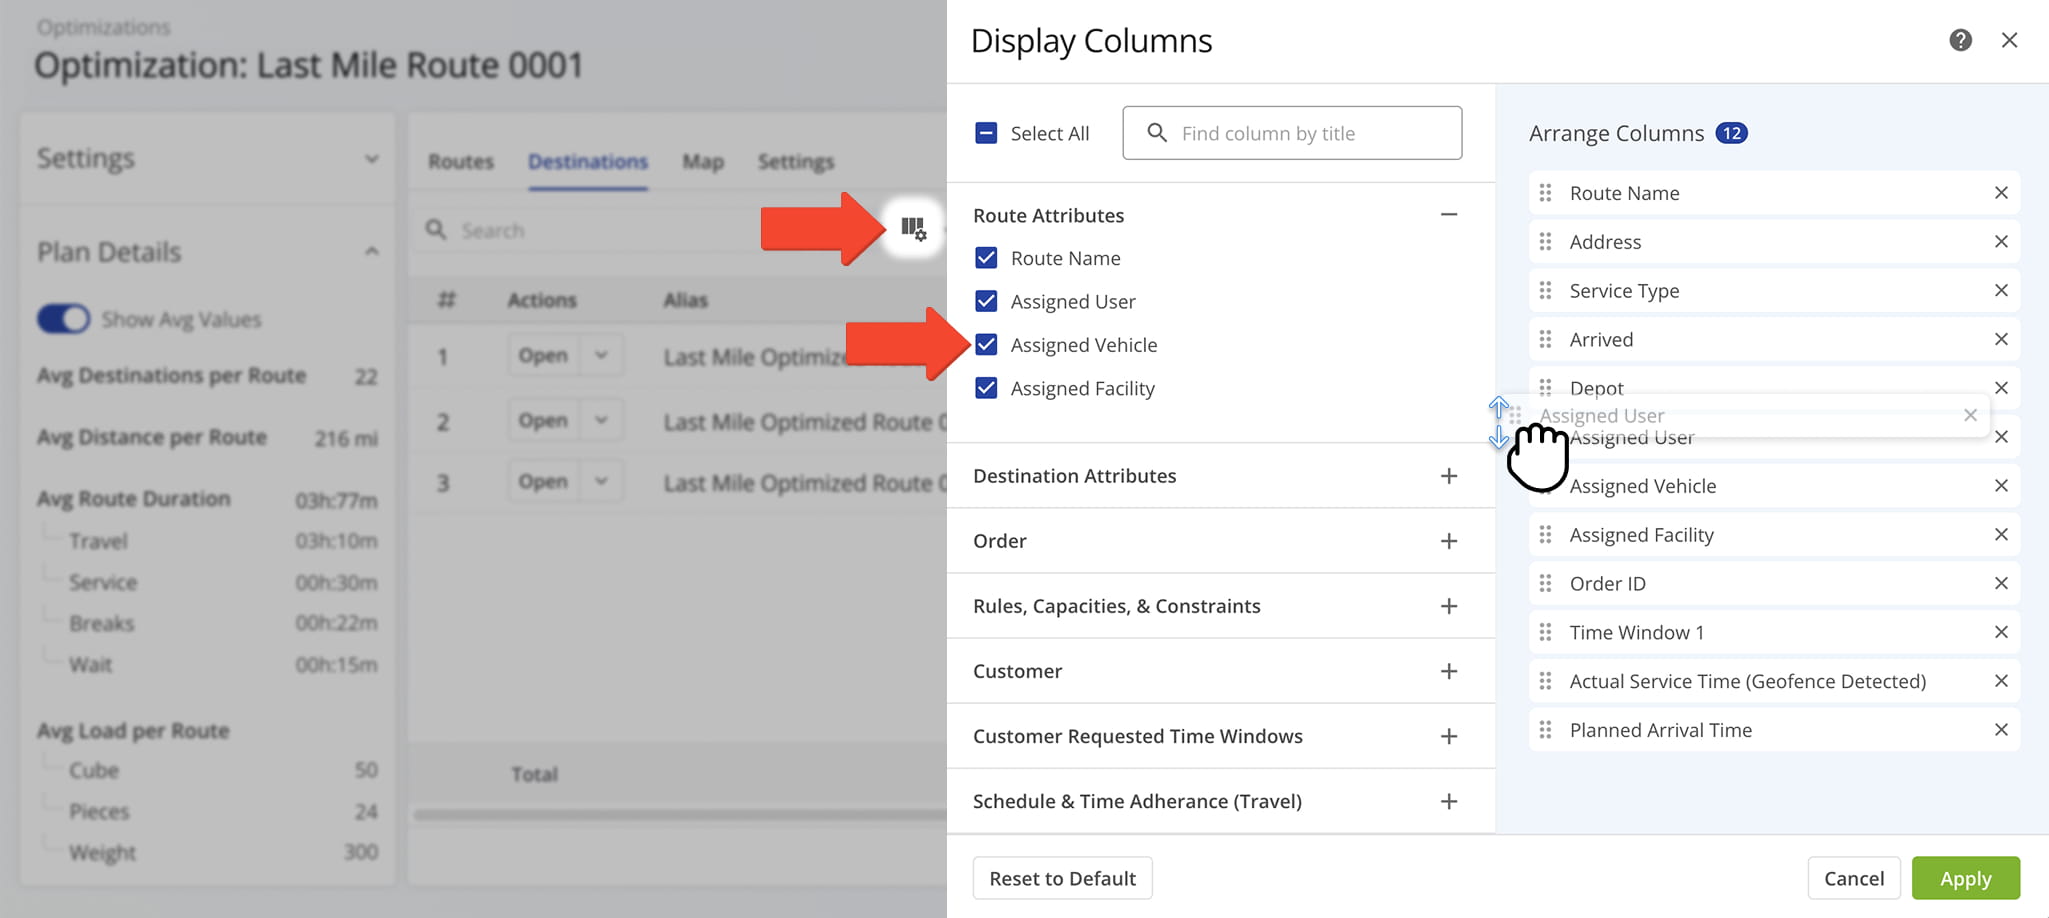
Destinations Data Columns
Map Tab – Interactive Route And Destination Insights
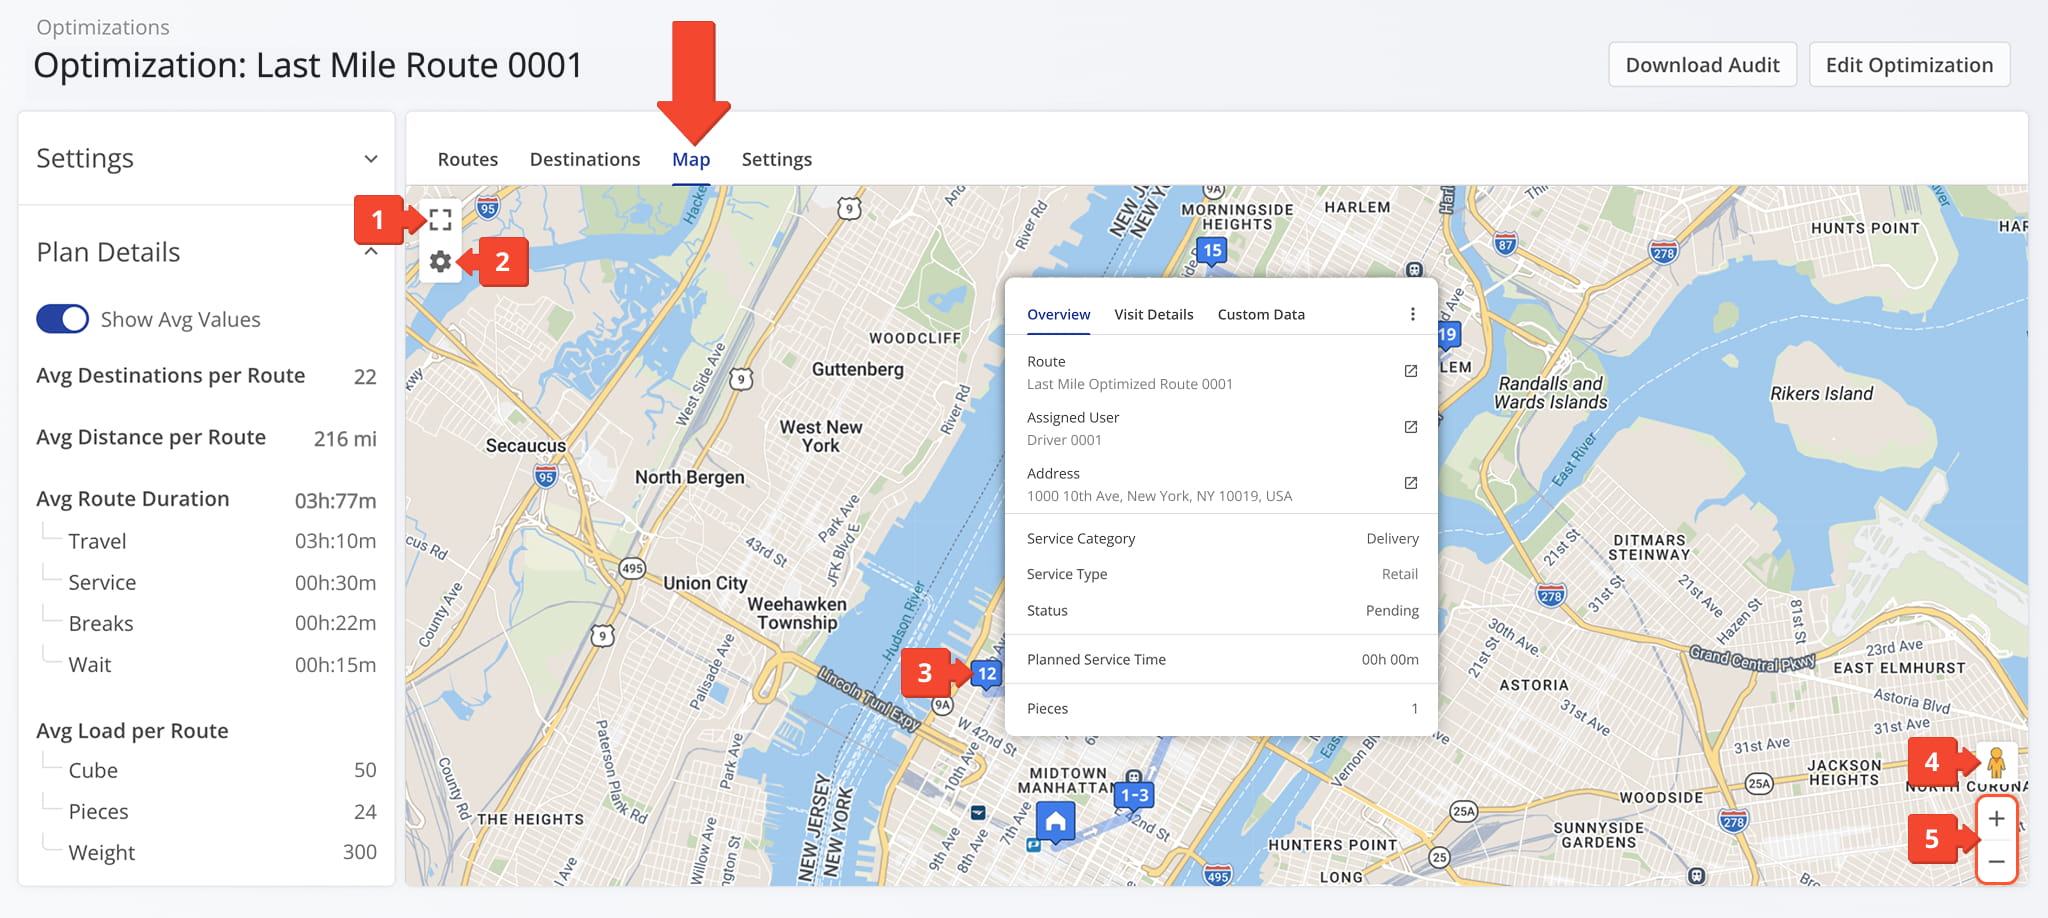
The Map tab provides a visual, interactive view of the selected Optimization, showing an associated route and its destinations while allowing you to access route-level data and view stop distribution in a geographic context. From this tab you can:
- Click the Full Screen icon to expand the map for a larger, more detailed view.
- Click the Gear icon to adjust map settings, including map type, route display, and map layers.
NOTE: The map provides the same route-level detail and operational data as the Routes Page Routes Map. - Click on any location to access detailed information about that specific destination.
- Drag the Pegman icon onto the map to access Street View for location-level detail.
- Click the Plus (+) and Minus (–) controls to zoom in or out for better visibility.
Settings Tab – Optimization Configuration And Plan Details
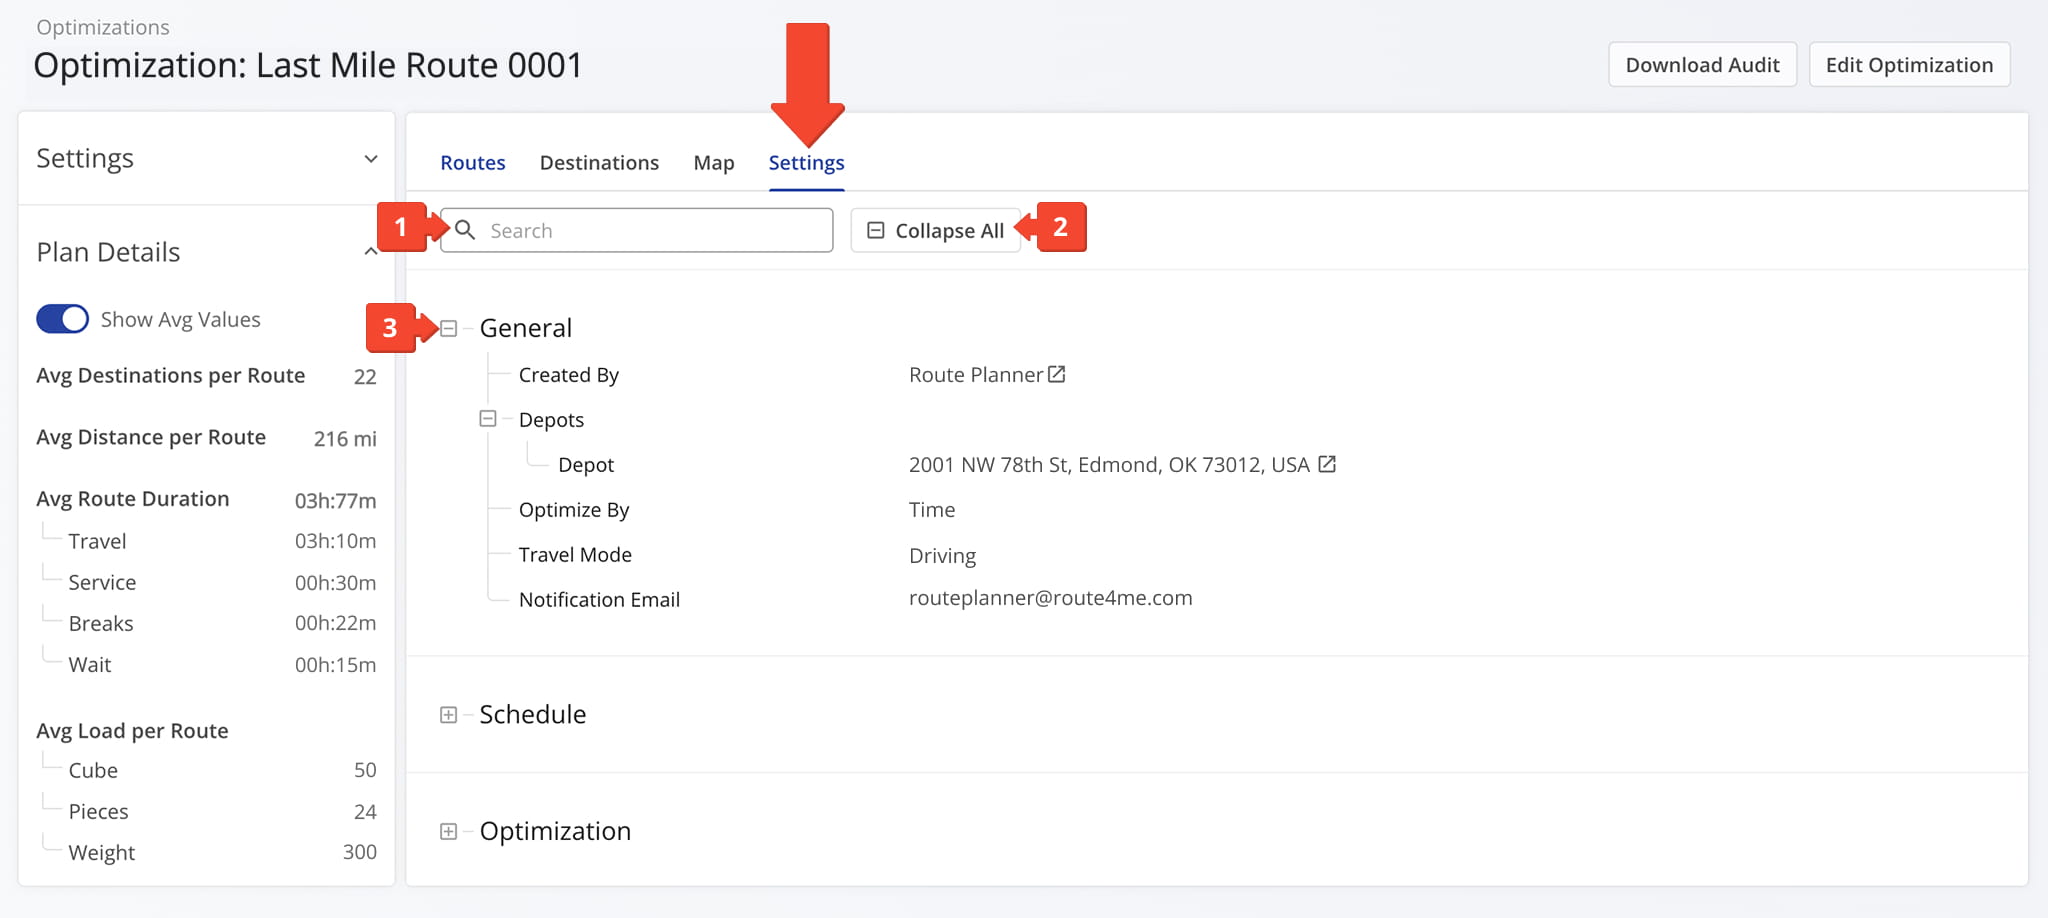
The Settings tab displays the configuration and plan details used for the selected Optimization, organized into expandable sections. From this tab, you can:
- Use the Search field to locate a specific setting.
- Click “Collapse All” to collapse every section at once.
- Click the Expand/Collapse Icon next to a section name, such as “General“, to review the settings within it. See the table below for a complete list of available settings data.
Settings Data
Visit Route4Me's Marketplace to Check out Associated Modules:
- Operations
Audit Logging and Activity Stream
- Operations
Custom Data Add-On
- Operations
Advanced Team Management Add-On
About author: Daniel Archer