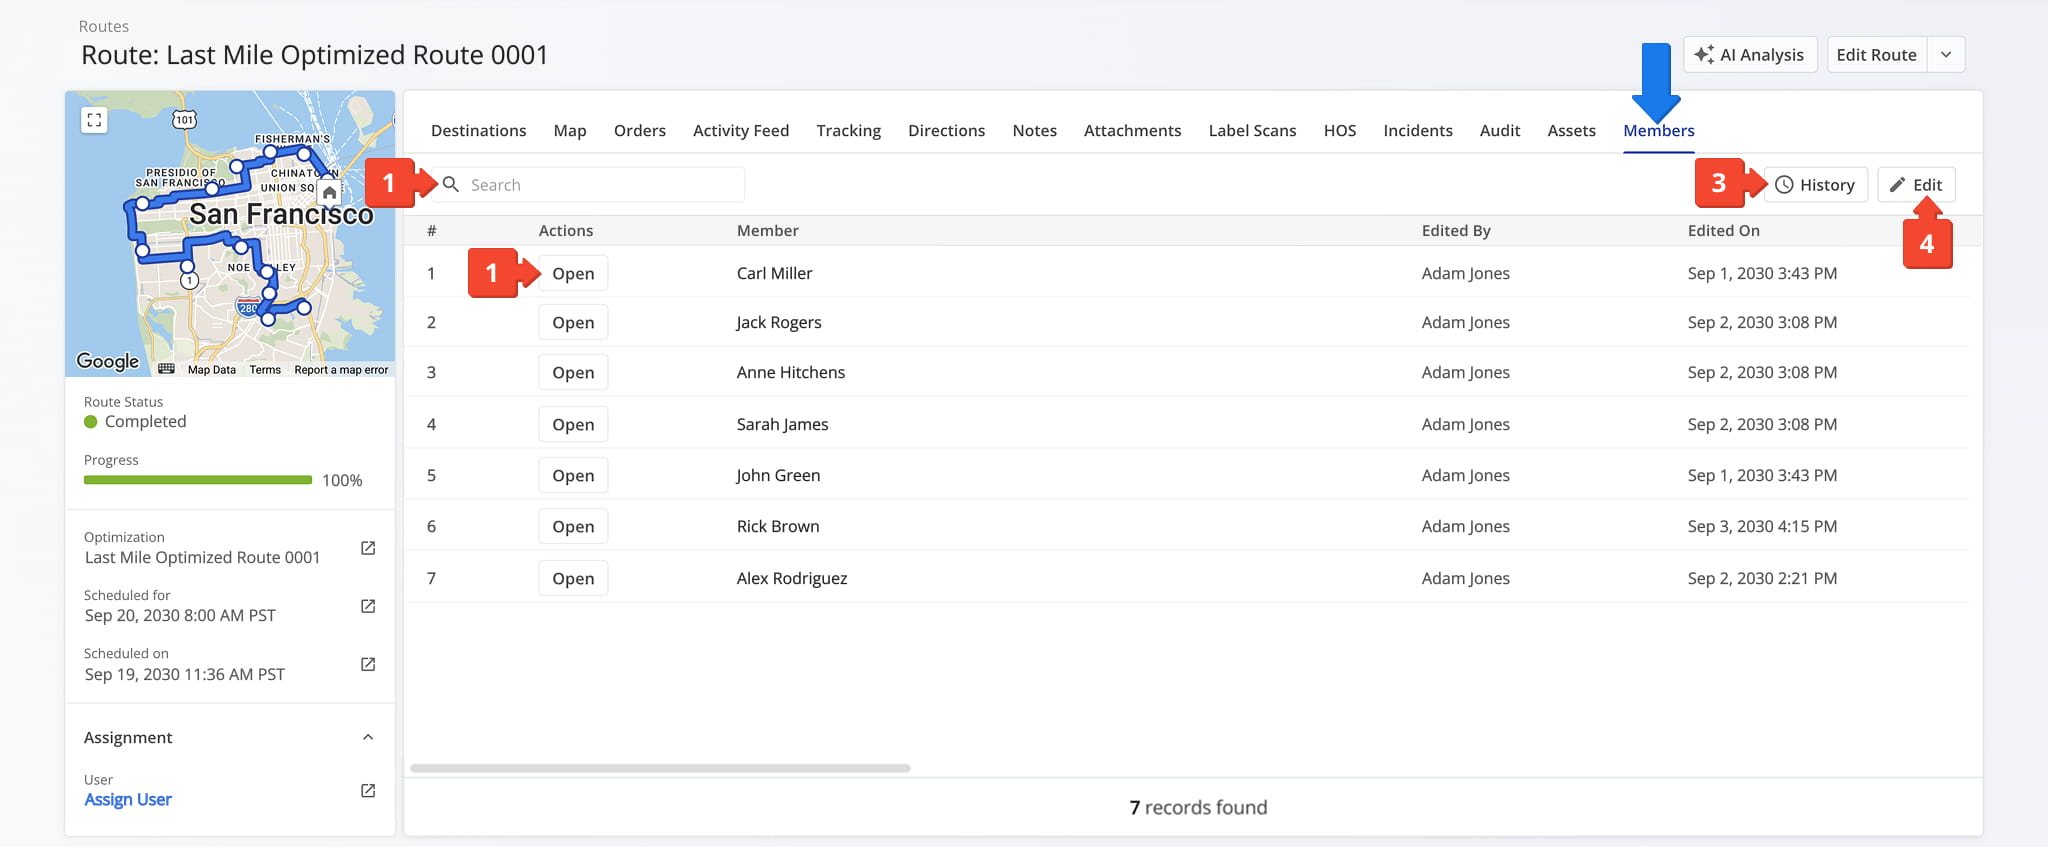
Route Snapshot – Real-Time Customizable Route Data And Analytics Summary

Route4Me’s Route Snapshot gives you a clear, organized view of any last-mile optimized route. It brings all key metrics and route details together, including a route summary, map overview, route analytics, destinations data, orders, proof of visit records, and executed activities. With everything in one place, you can quickly review route performance, analyze data more effectively, and make informed decisions that help you deliver a better customer experience.
The Route Snapshot provides a clear, centralized view of key metrics and details for any last-mile optimized route.


Open Route Snapshot – Access Route Data And Analytics Overview

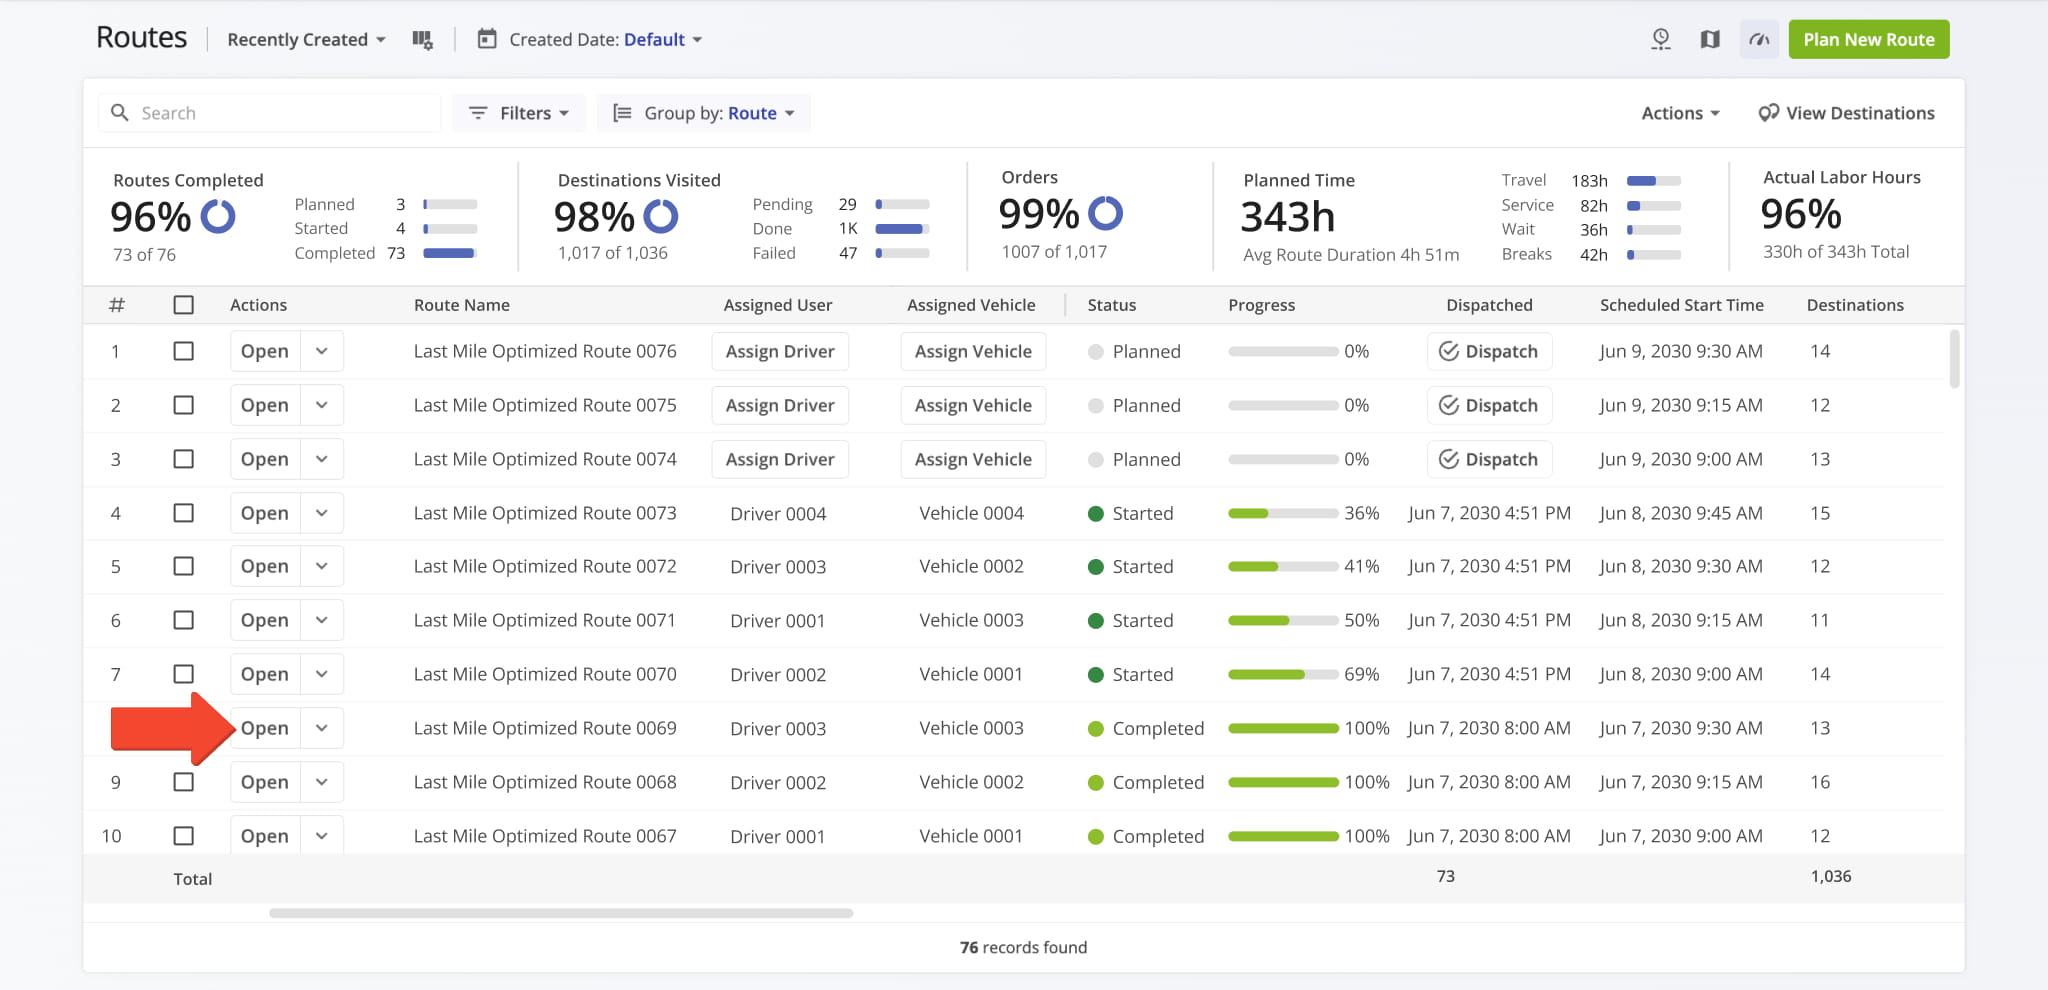
To open the Route Snapshot of any planned and optimized route, go to “Dynamic Routing” > “Routes” from the Navigation Menu to open the Routes Page. Then, click “Open” next to a route.

Open Your Route Page

To open the Route Snapshot of any planned and optimized route, go to


This opens the selected Route Snapshot. From here, you can view route details, make adjustments, assign a user, vehicle, or facility, and manage dispatch and other route tasks.

To make changes, click the “Edit Route” button, where you’ll be redirected to the Route Editor, or the Down Arrow button next to it to perform additional actions, detailed in the table below.
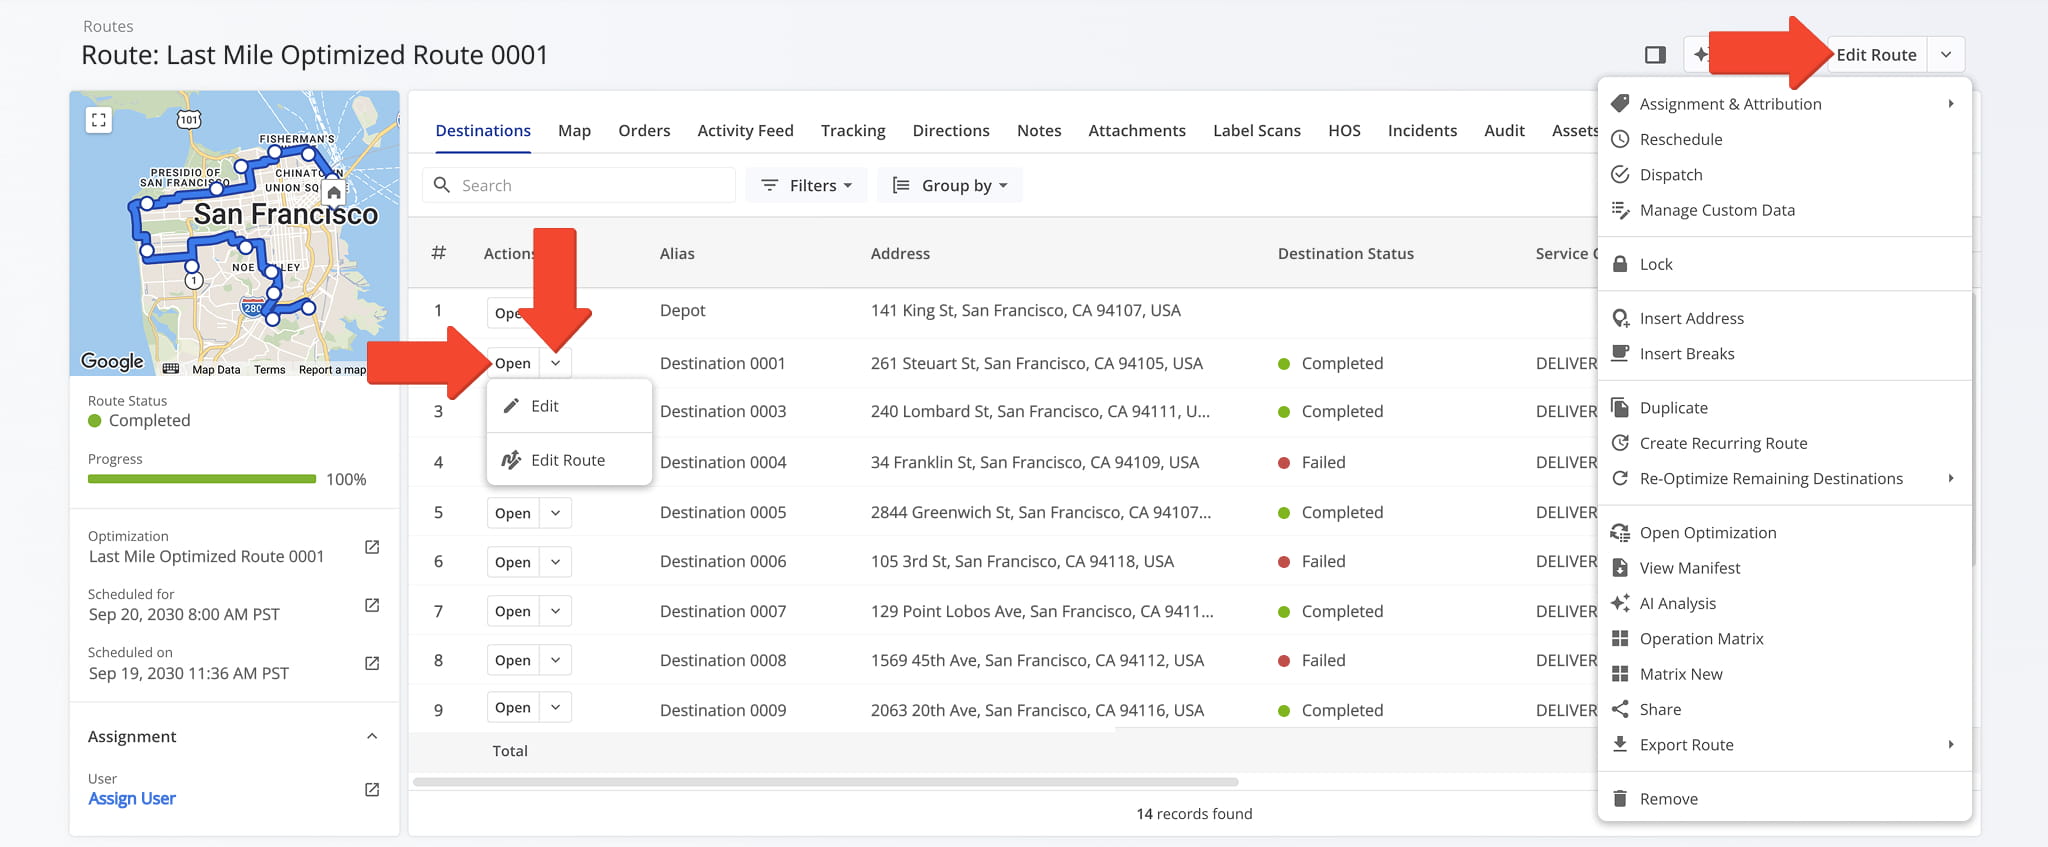
You can also click “Open” to access a Destination Snapshot or the Down Arrow button next to it to make edits.

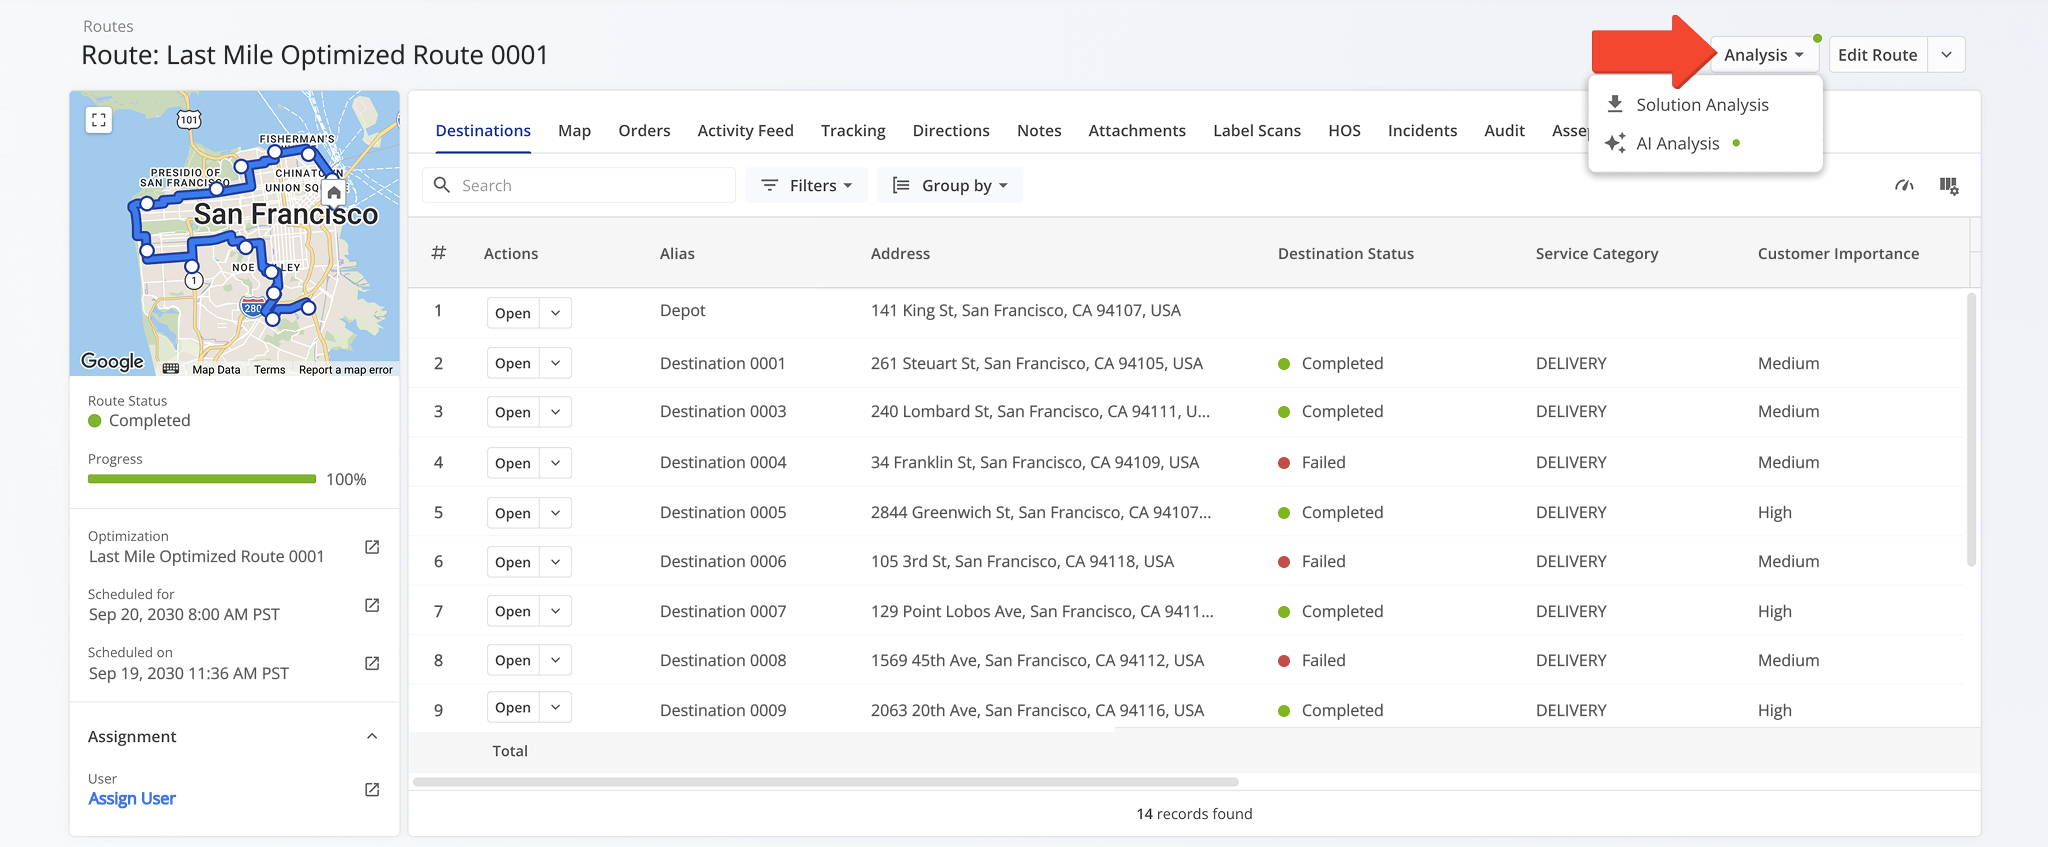
Route Snapshot showing detailed destination data and key routing metrics.


Route Overview Panels – Location, Details, Performance Metrics

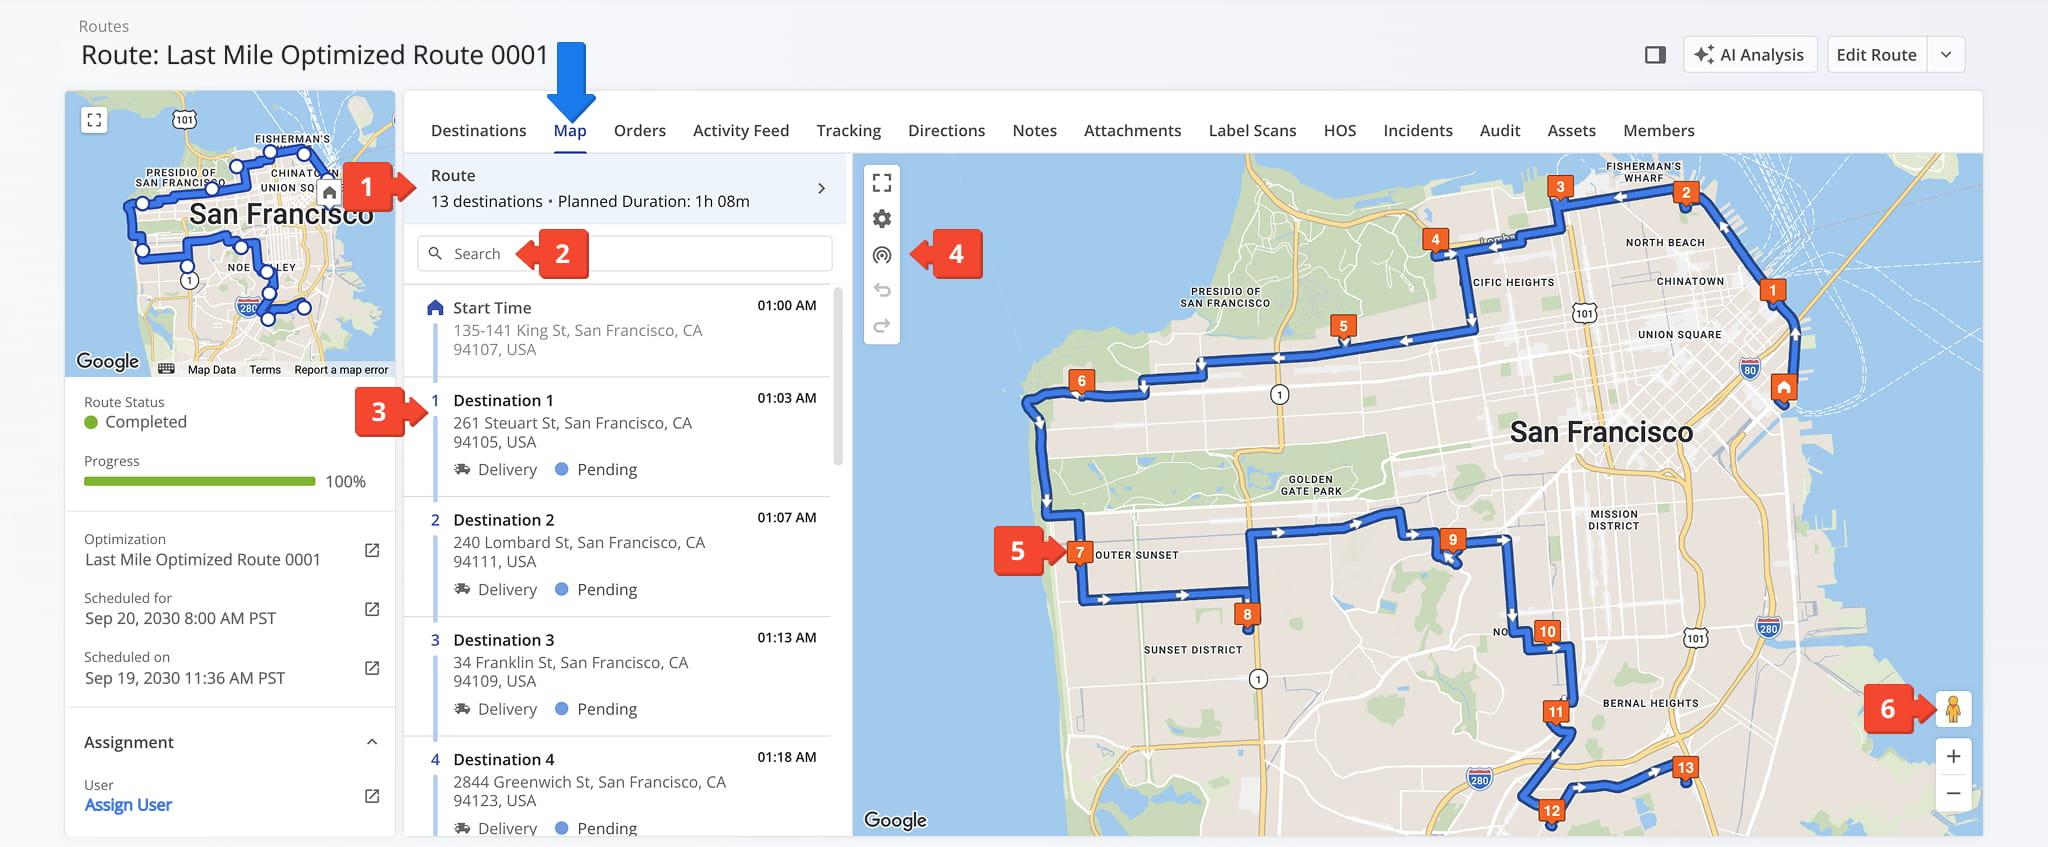
Route Details Summary – Dynamic Map And Route Information Panel

The Route Summary panel displays key details about the route, including a map with its planned path and sequence of destinations, assigned user, vehicle, and facility, and scheduled date.

From this panel, you can perform the following actions:

  1. Click on any destination on the map to view its details.
  2. Click the Go-to Icon next to any field to open the corresponding Route4Me interface.
  3. Click “Assign” on any empty field to assign a user, crew, facility, customer, contract, or region to the route. NOTE: Scroll down the panel to view all “Assign” options.
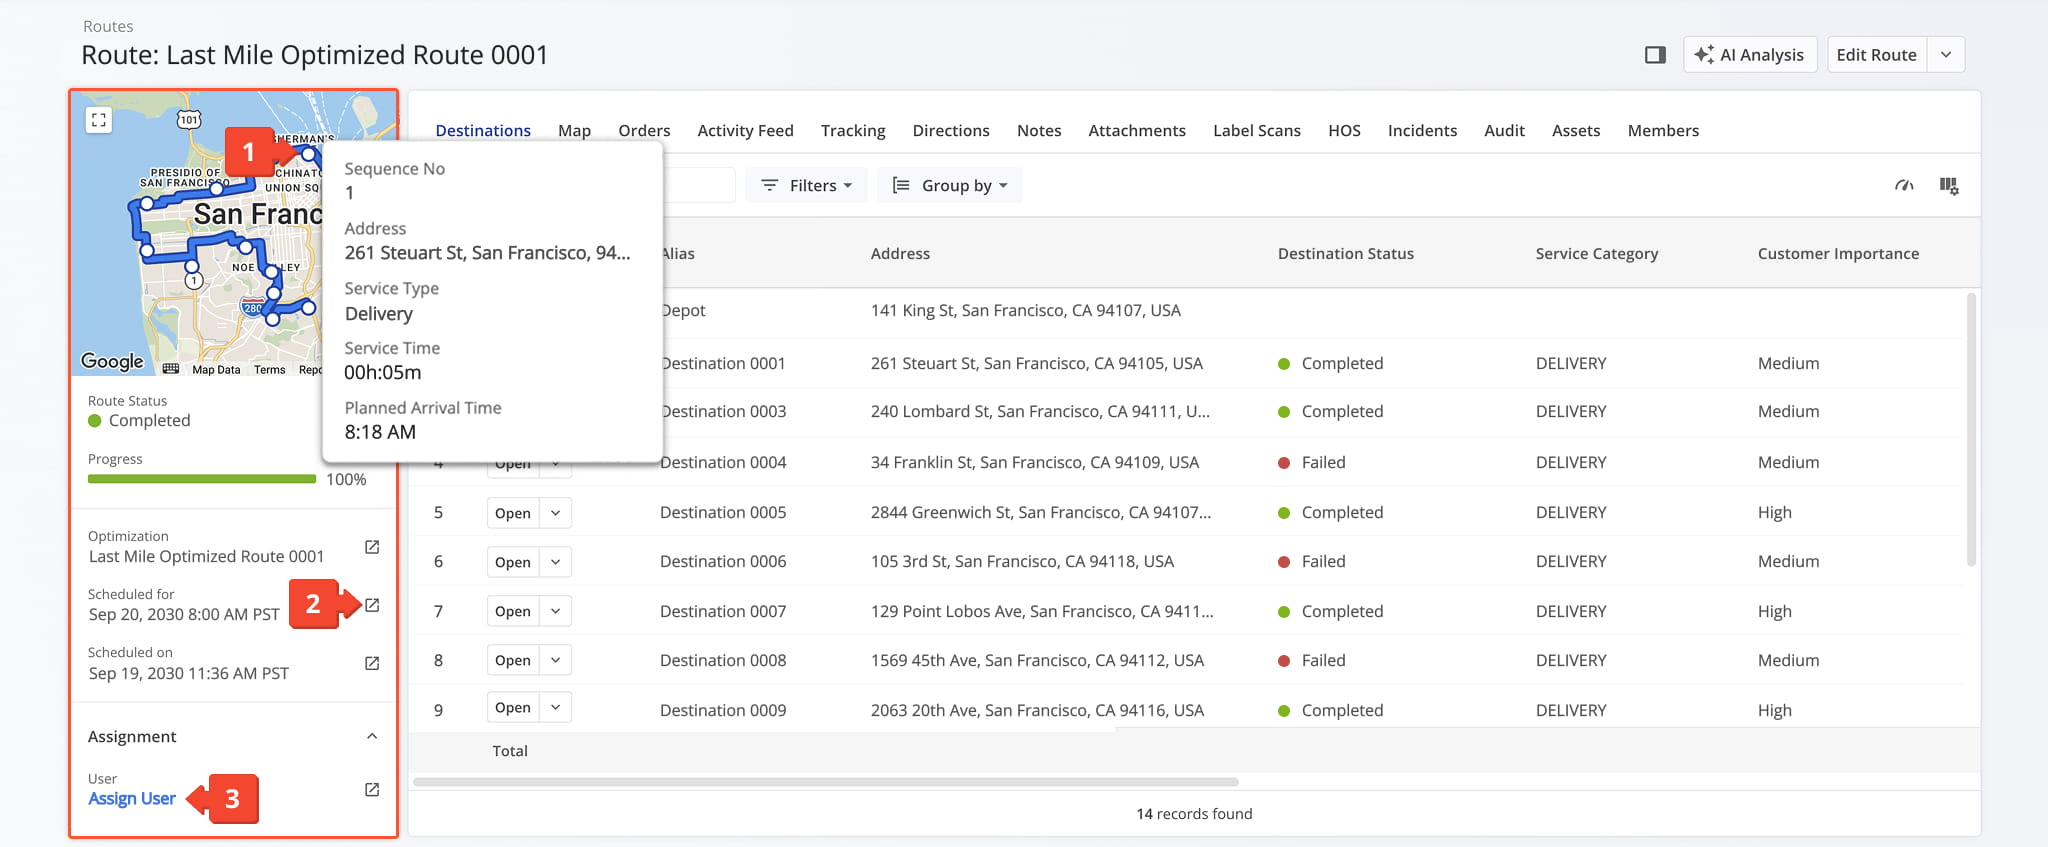
The route summary panel on the Route Snapshot shows a real-time map of the route, its critical information, and more.


To better evaluate performance, you can select the tracking data source used to calculate actual route metrics, including User-Reported, Mobile App Detected, or Telematics Detected data. See the table below for an overview of each tracking data source.
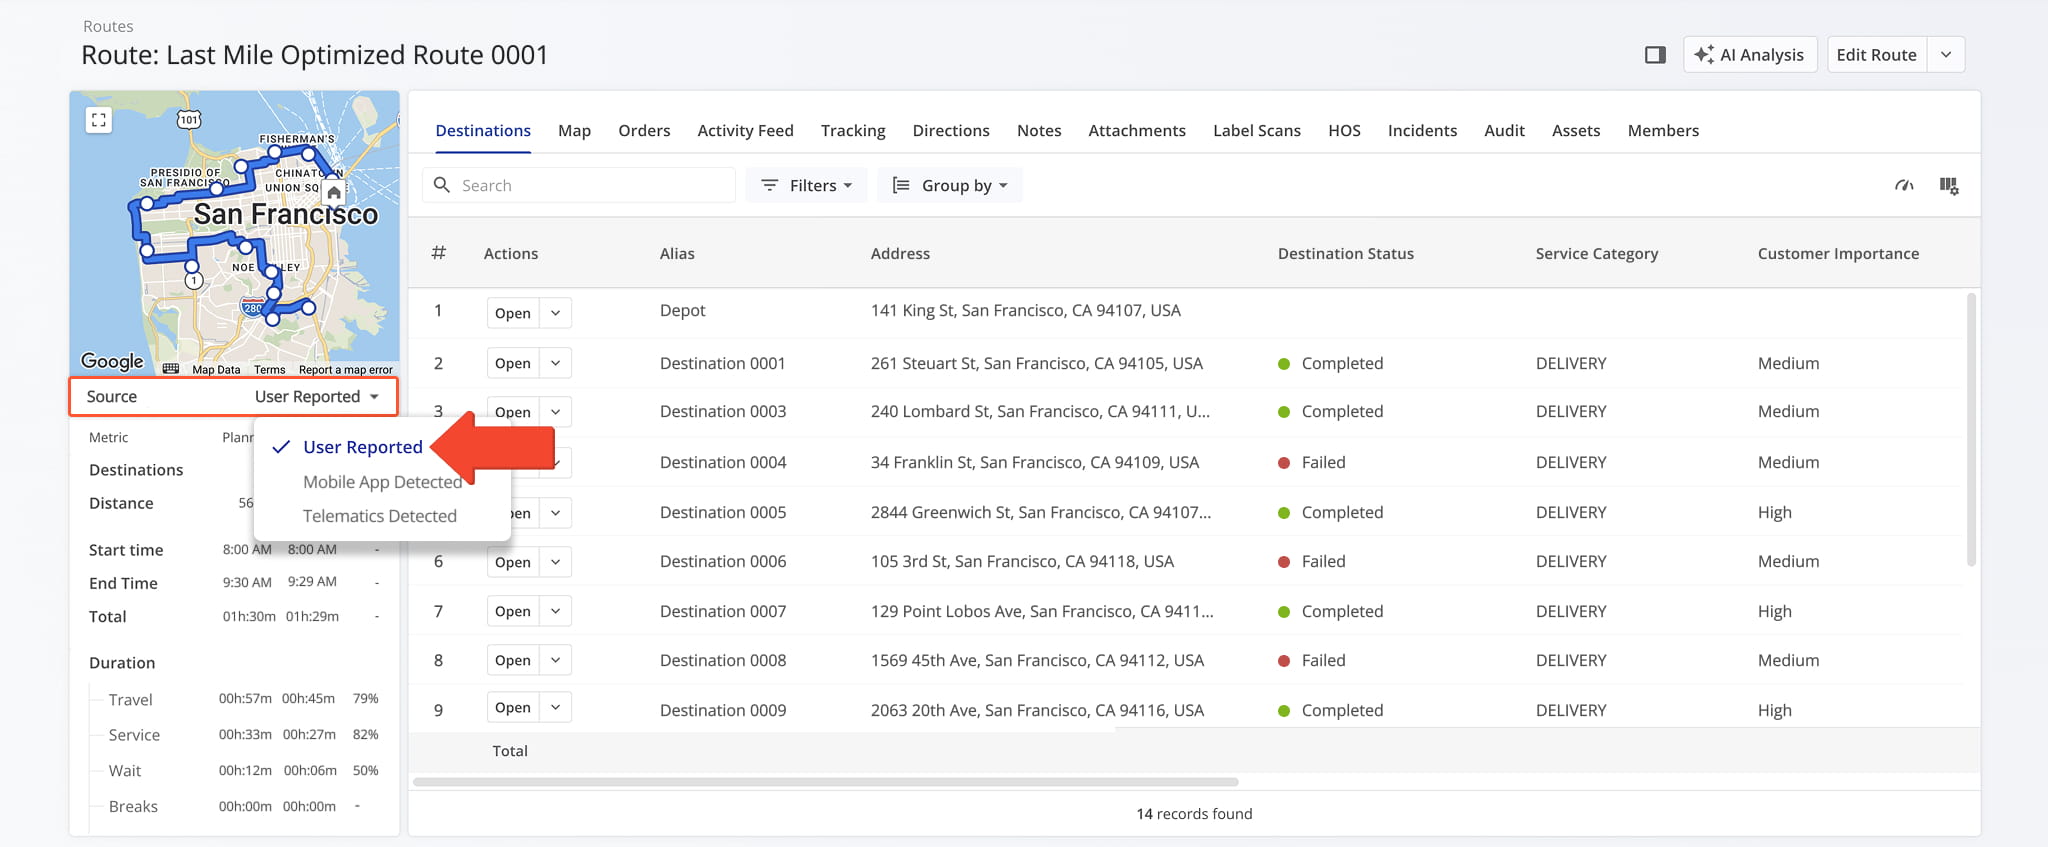
Scroll down in the Route Summary panel to see route duration and distance metrics.

Source
Description
Expand Table

User Reported

Location data manually reported or confirmed by the assigned user during route execution.

Mobile App Detected

Location data automatically captured by the Route4Me mobile app using the device’s GPS services.

Telematics Detected

Location data received from a vehicle’s installed telematics device through an integrated telematics provider.


Scroll down the Summary panel to see key route metrics, such as distance, duration and progress. You can compare planned values with actual values for completed routes or with the latest data for started routes.
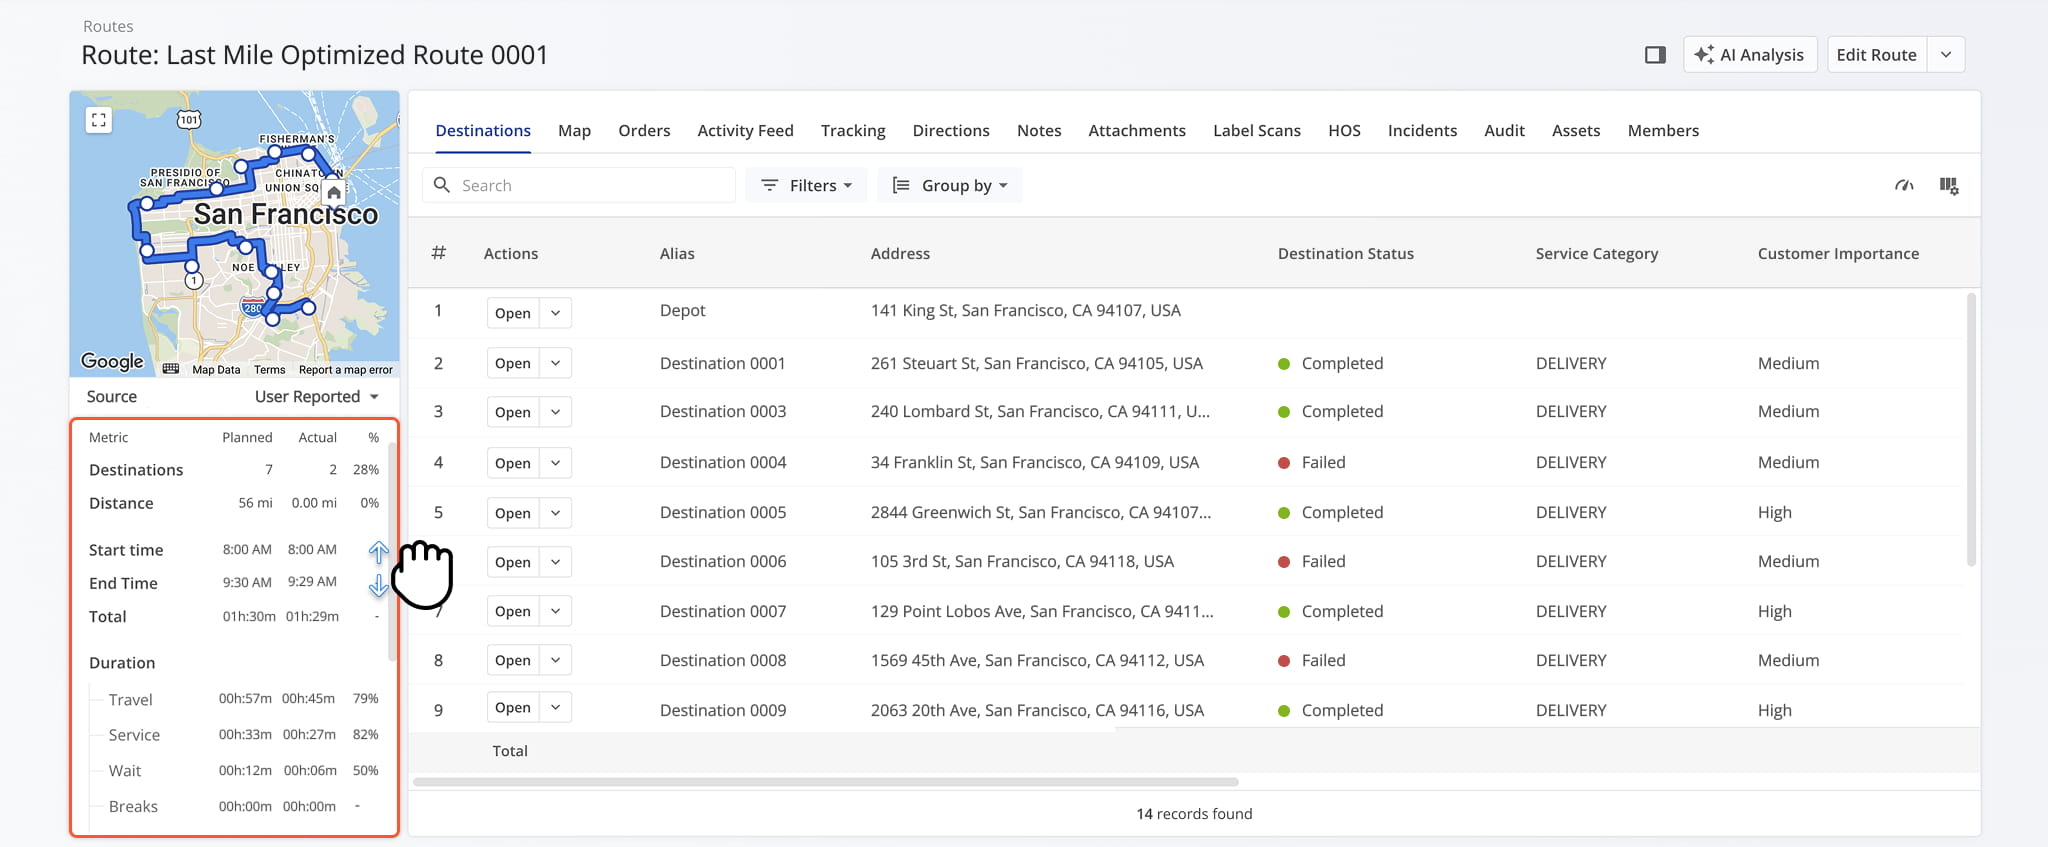
Scroll down the Summary panel to view key route metrics and compare planned and actual values.


Scroll further down to view all custom data associated with the route, including user-defined fields for tracking additional route details. Click the Pencil Icon to add new data or edit existing data.
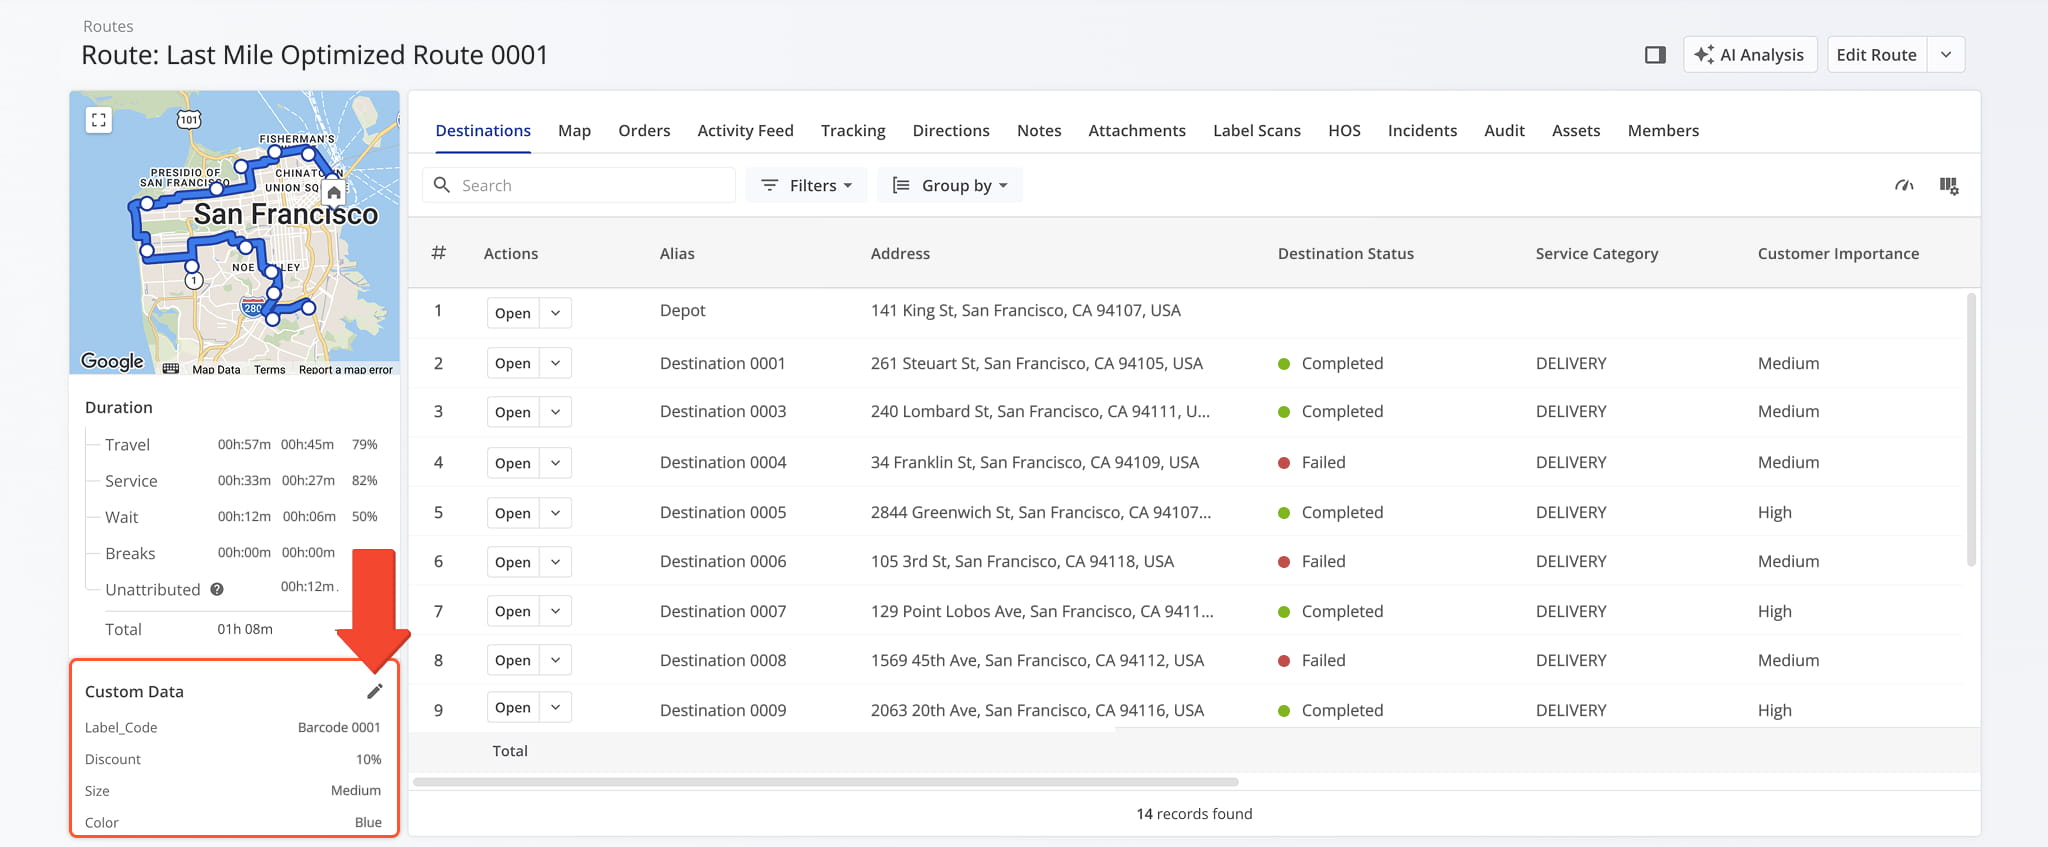
croll down the panel to view and manage all custom data associated with the route.


Route Performance Metrics Panel – Route Progress And Operational Efficiency

Click the Sidebar Button in the upper-right corner to open the Route Metrics panel where you can view the route’s progress and operational efficiency with planned versus actual metrics for route duration, distance, and more.

From this panel, you can perform the following actions:

  1. Toggle the “Show All Switch” to view all data categories.
  2. Click the Gear Icon to customize which data fields appear in the Route Metrics panel.
  3. Click the Down Arrow next to a data category header to expand or collapse the category.
  4. Drag the panel to enlarge or reduce its size.
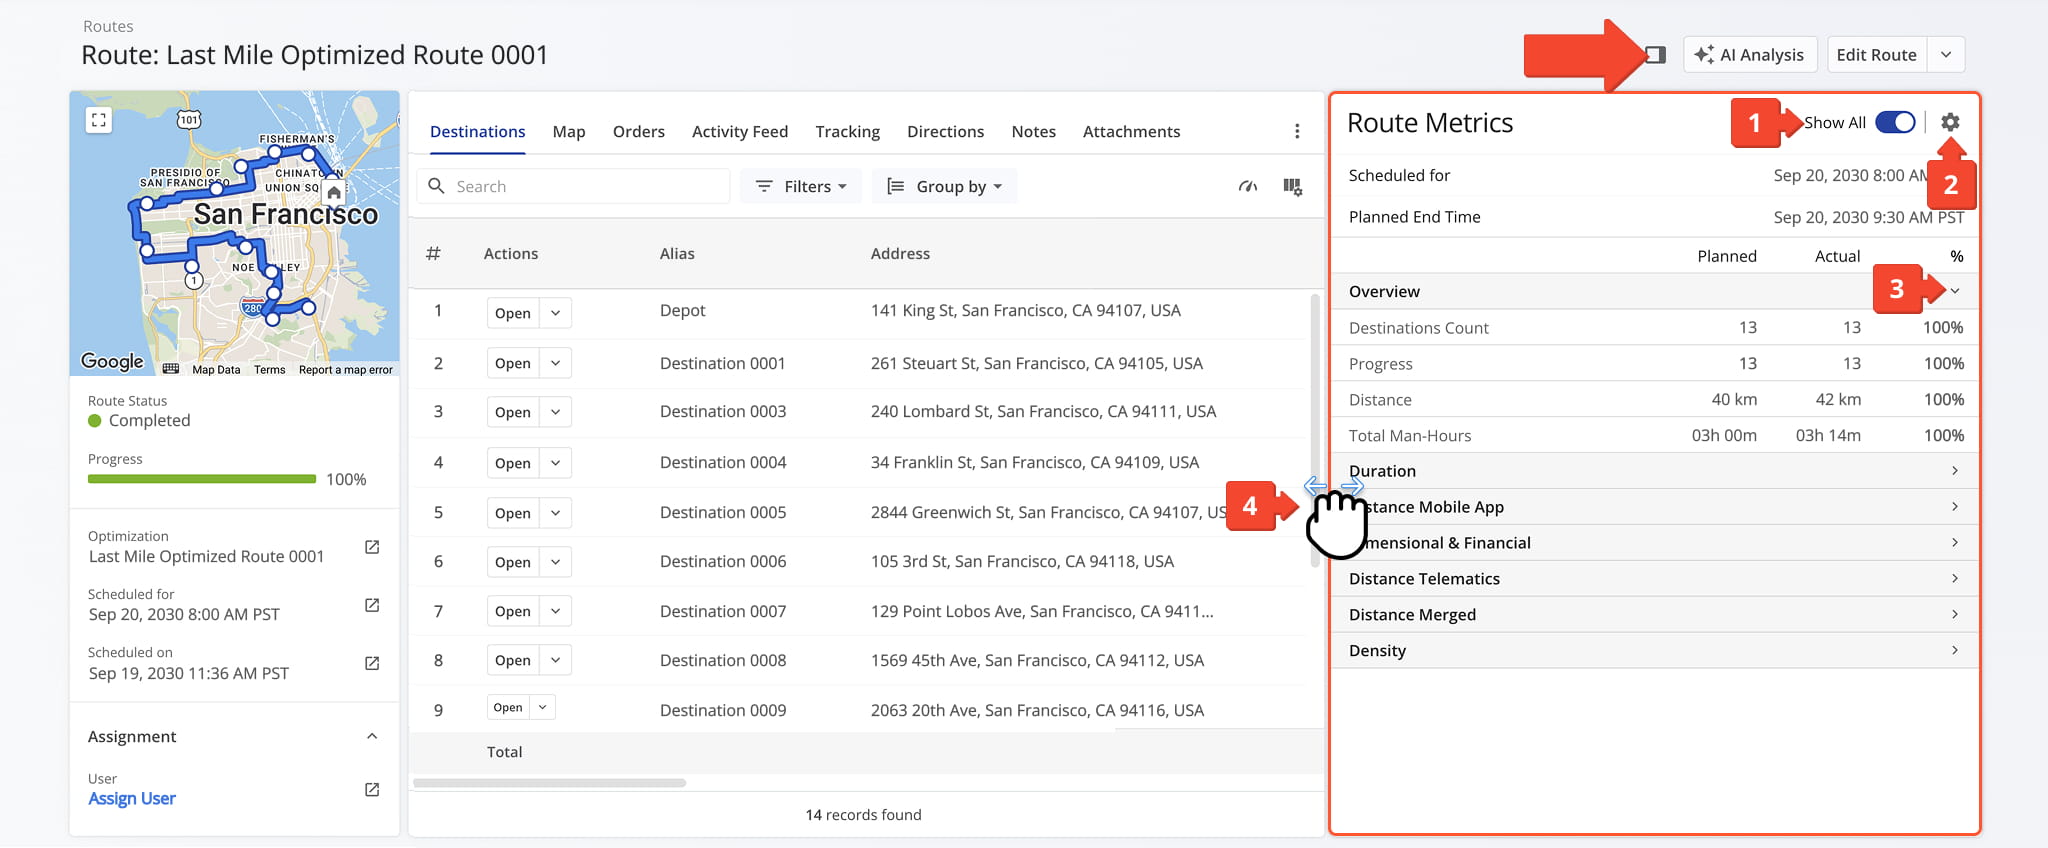
Route Snapshot showing detailed destination data and key routing metrics.


Clicking the Gear Icon opens the “Display Columns” editor where you can select which data fields appear in the Metrics panel. In the “Arrange Columns” section, drag and drop fields or category headers to reorder them.

The table below provides an overview of all available data columns.
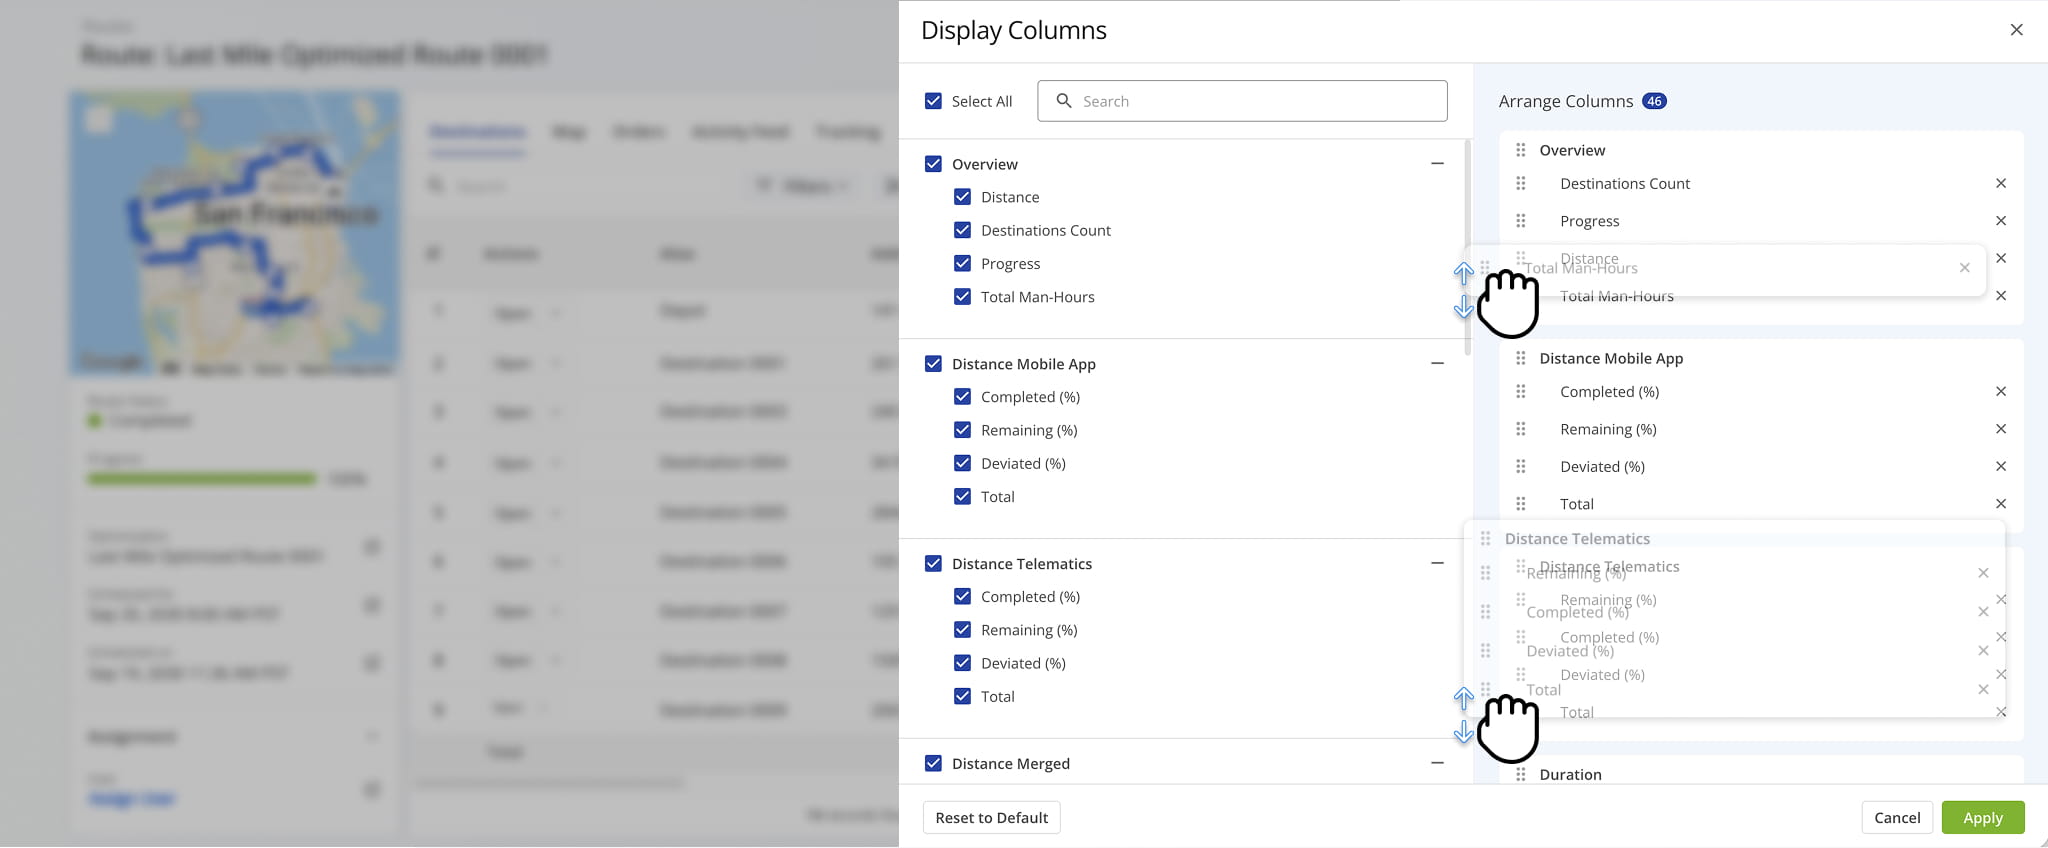
Customize the Route metrics panel to show the data columns you wish to review and the order in which they appear.

Metric
Description
Overview

Distance

Total route distance for selected routes.

Destinations Count

Total number of destinations for selected routes.

Progress

Percentage value of route destinations that have assigned statuses.

Distance Mobile App

Completed (%)

Percentage of the planned route distance that has already been traveled and recorded by the mobile app.

Remaining (%)

Percentage of the planned route distance that has not yet been traveled, according to the mobile app.

Deviated (%)

Percentage of route distance traveled that deviated from the planned route, recorded by the mobile app.

Total

Total route distance, as tracked by the mobile app, including completed, remaining, and deviated segments.

Distance Telematics

Total distance traveled, recorded by telematics.

Completed (%)

Percentage of planned route distance completed according to telematics vehicle tracking data.

Remaining (%)

Percentage of planned route distance not yet completed, according to telematics data.

Deviated (%)

Percentage of distance where the vehicle deviated from the planned route, based on telematics.

Total

Total distance tracked by telematics, combining completed, remaining, and deviated distances.

Distance Merged

Combined average distance from mobile app and telematics data.

Completed (%)

Percentage of planned route distance completed, calculated using combined data from both mobile app and telematics.

Remaining (%)

Percentage of planned route distance not yet traveled, calculated from merged data.

Deviated (%)

Percentage of route distance that deviated from the planned route, based on combined mobile app and telematics data.

Total

Total route distance from merged data, including completed, remaining, and deviated segments.

Duration

Travel

Total travel time between destiantions for all selected routes.

Service

Total Service Time at destinations for all selected routes.

Wait

Total Wait Time before Time Windows for all selected routes. Wait time

Break

Total Driver Break time for all selected routes.

Unattributed

Total route duration of selected route that couldn't be associated with another duration value.

Detected Unattributed

Total detected route duration of selected route that couldn't be associated with another duration value.

Total

Total duration of selected routes, combining all individual sub-durations for driving, service, wait, and breaks.

Stem In

Total time duration from route start locations to the first stop for selected routes.

Stem Out

Total time duration from the final destination to the route end location for selected routes.

Dimensional & Financial

Pieces

Planned and actual (delivered) order units for selected routes.

Weight

Planned and actual (delivered) weight of orders for selected routes.

Cube

Planned and actual (delivered) cubic v0lume of orders for selected routes.

Revenue

Planned and actual (generated) revenue associated with orders for selected routes.

Cost

Planned and actual (generated) cost associated with orders for selected routes.

Fuel Cost

Total fuel cost incurred for all selected routes, based on vehicle fuel usage and cost rates.

Cost Per Distance

Average operational cost per mile or kilometer, calculated as total route costs divided by total route distance.

Revenue Per Distance

Average revenue earned per mile or kilometer, calculated as total route revenue divided by total route distance.

Density

SPORH

Stops per operational route hour, showing efficiency relative to active route time for selected routes.

TPORH

Total points or destinations per operational route hour for selected routes.

Destinations / Distance

Average number of destinations per mile or kilometer for the selected routes, showing stop density relative to route length.

Destinations / Hour

Average number of destinations completed per operational hour, showing route productivity.

Transactions / Hour

Average number of transactions (deliveries, pickups, or stops with completed tasks) completed per operational hour.

Cubic / Destinations

Average cubic volume of goods delivered per destination, showing load efficiency per stop.

Cubic / Distance

Average cubic volume of goods delivered per mile or kilometer of route, showing delivery density relative to route length.

Cubic / Hour

Average cubic volume of goods delivered per operational hour.

Pieces / Distance

Average number of order pieces delivered per mile or kilometer, showing item density along the route.

Pieces / Hour

Average number of order pieces delivered per operational hour.

Weight / Distance

Average total weight of goods delivered per mile or kilometer, showing load density relative to distance.

Weight / Destinations

Average total weight of goods delivered per stop, showing delivery load per destination.

Weight / Hour

Average total weight of goods delivered per operational hour.


Route Performance Insights Panel – Vehicle Route And Time Performance Overview

Click the Metrics Icon in the upper-right corner to open the Route Performance Insights panel, where you can monitor progress, track efficiency, and evaluate operational performance across the route.

This panel, available from the Destinations tab, provides a summary of planned destinations and orders, along with a side-by-side breakdown of planned and actual time for travel, service, wait, and breaks.
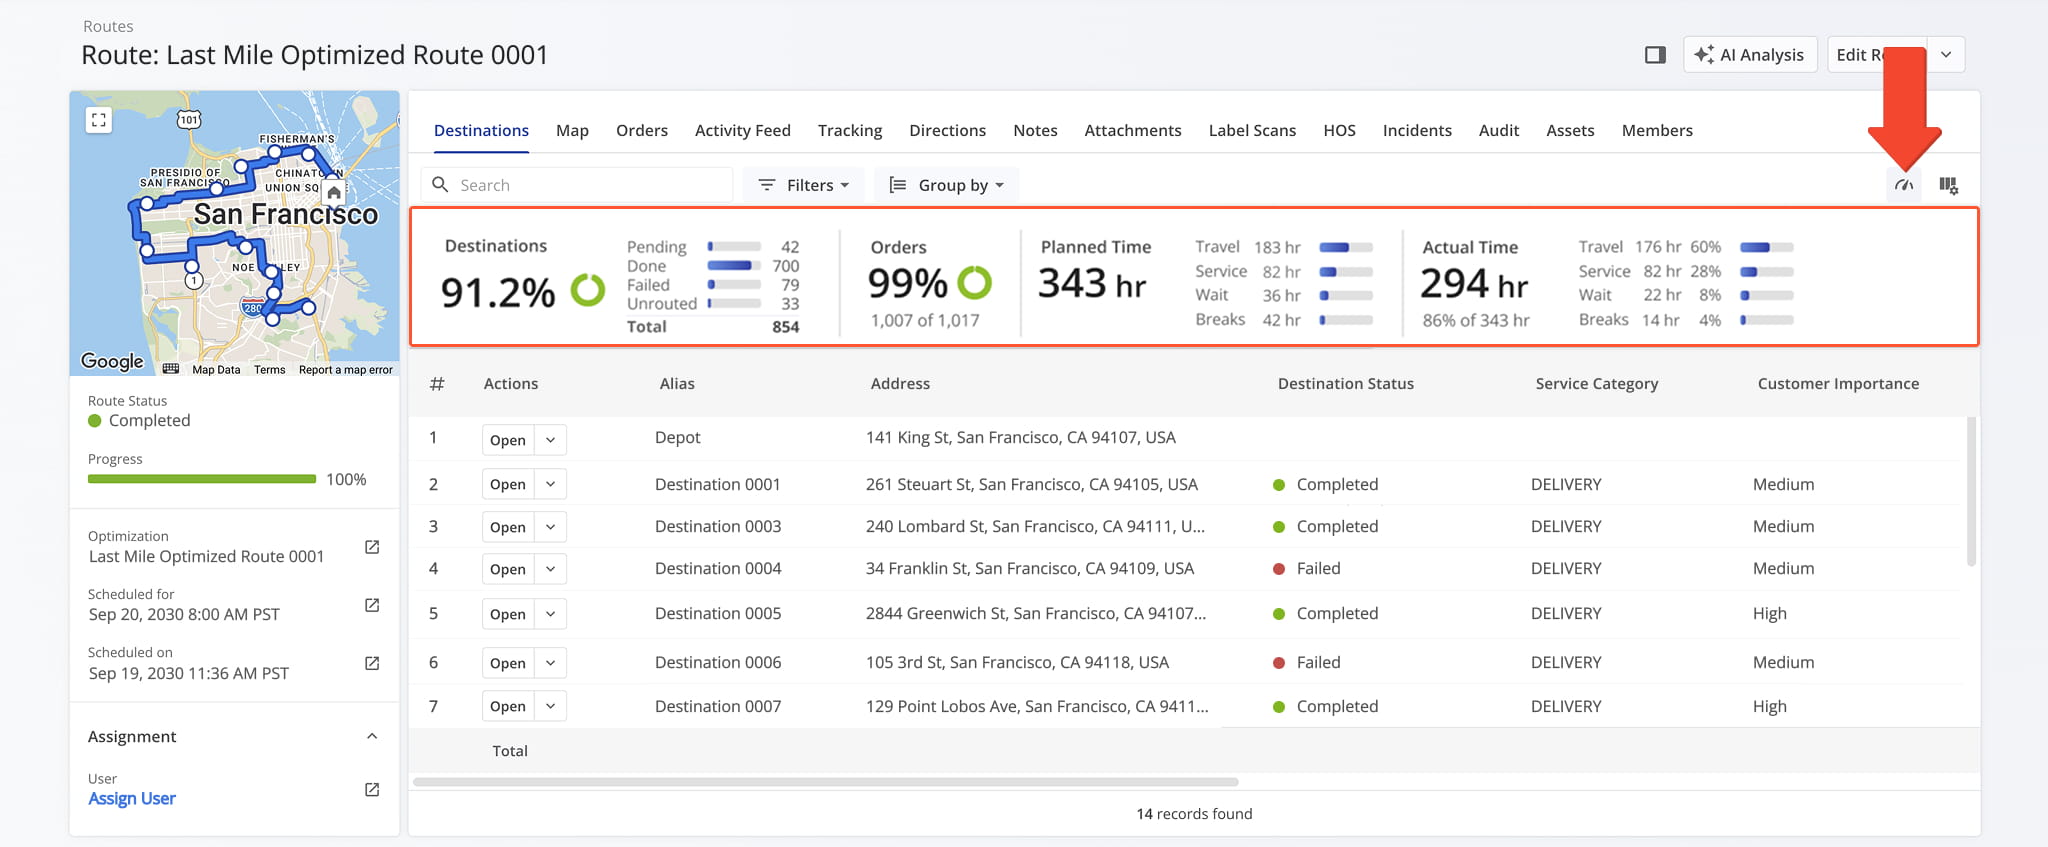
From the Routes Metric Panel, access an overview of analytical data related to destination, orders, and planned versus actual time.


Route Snapshot Categories – Route Analytics Data Tabs

The Route Snapshot is organized into multiple tabs, each corresponding to a specific category of route-related data. Each tab is described in detail below.
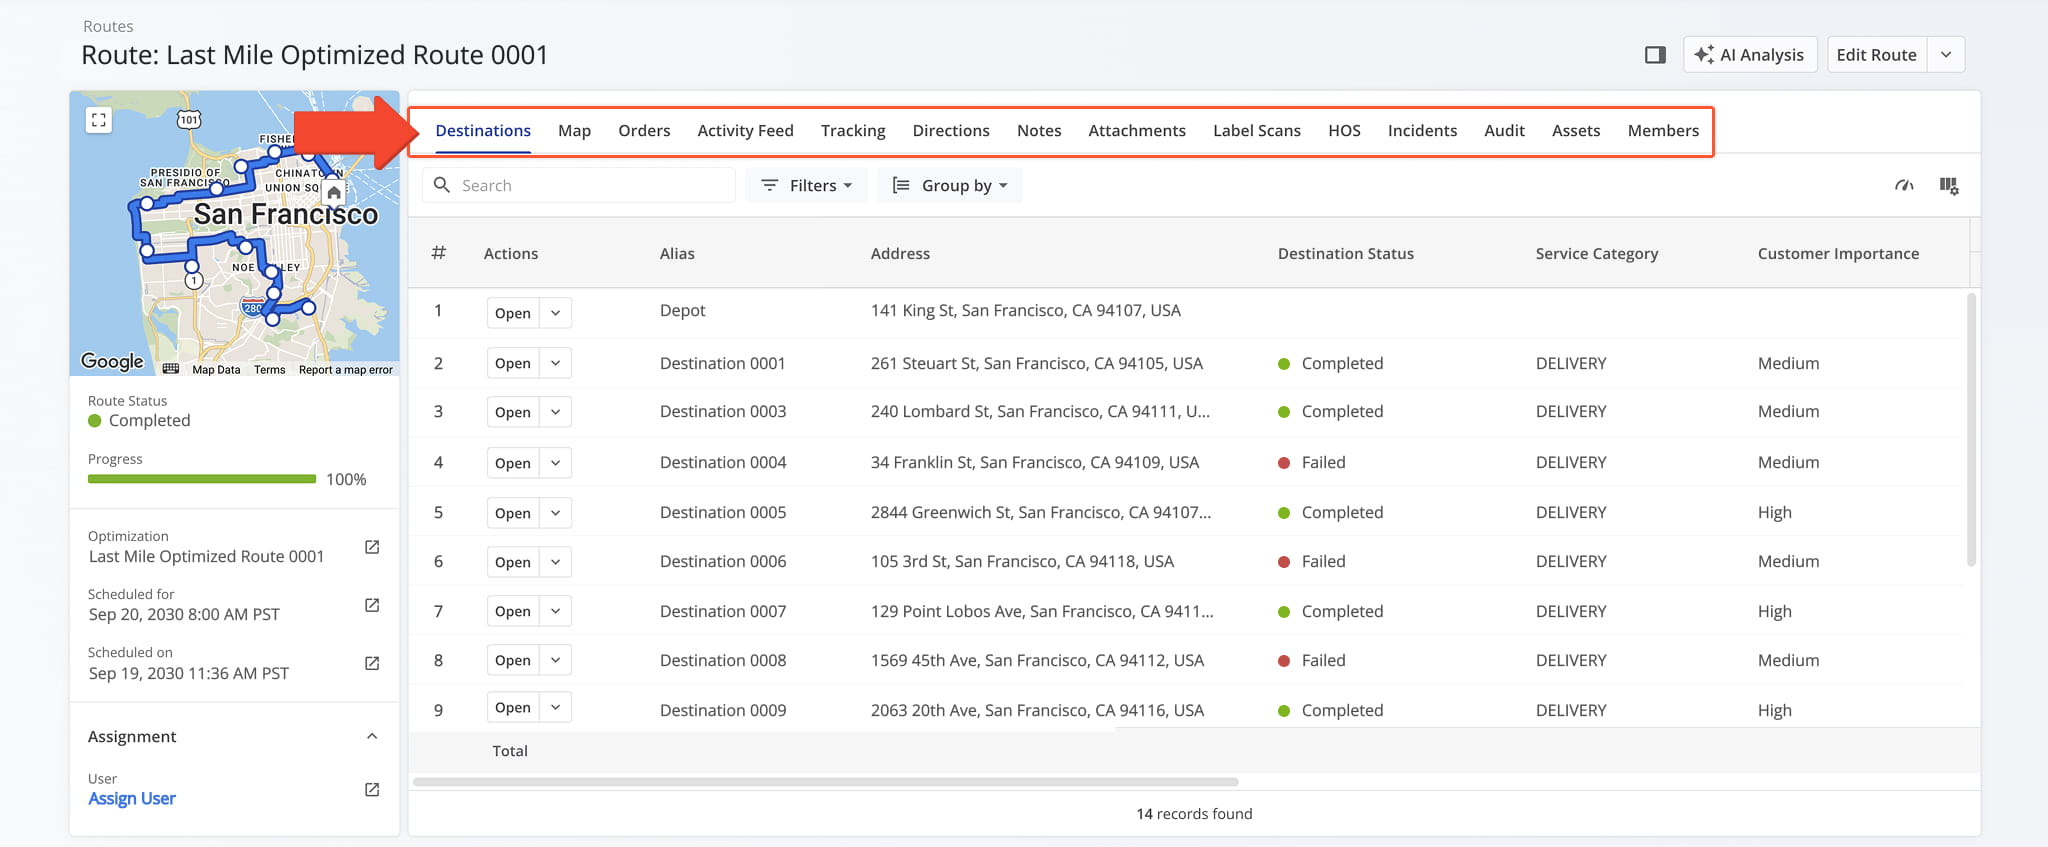
The Route Snapshot has different tabs corresponding to the type of associated data.


Destinations Tab – Route Destinations And Customer Data Overview

The Destinations tab displays all destinations for the selected route in a customizable data table. The destination data here matches what is shown in Destination View Mode on the Routes Page.

From the Destinations tab, you can perform the following actions for each destination on the route:

  1. Use the Search field to locate specific destinations.
  2. Apply filters to narrow down the data. See the table below for a full list of available filters.
  3. Use the Group By option to organize destinations by Facility.
  4. Click “Open” next to a destination to access its Destination Snapshot.
  5. Click the Down Arrow button to access the Route Editor and make modifications to the destination as needed.
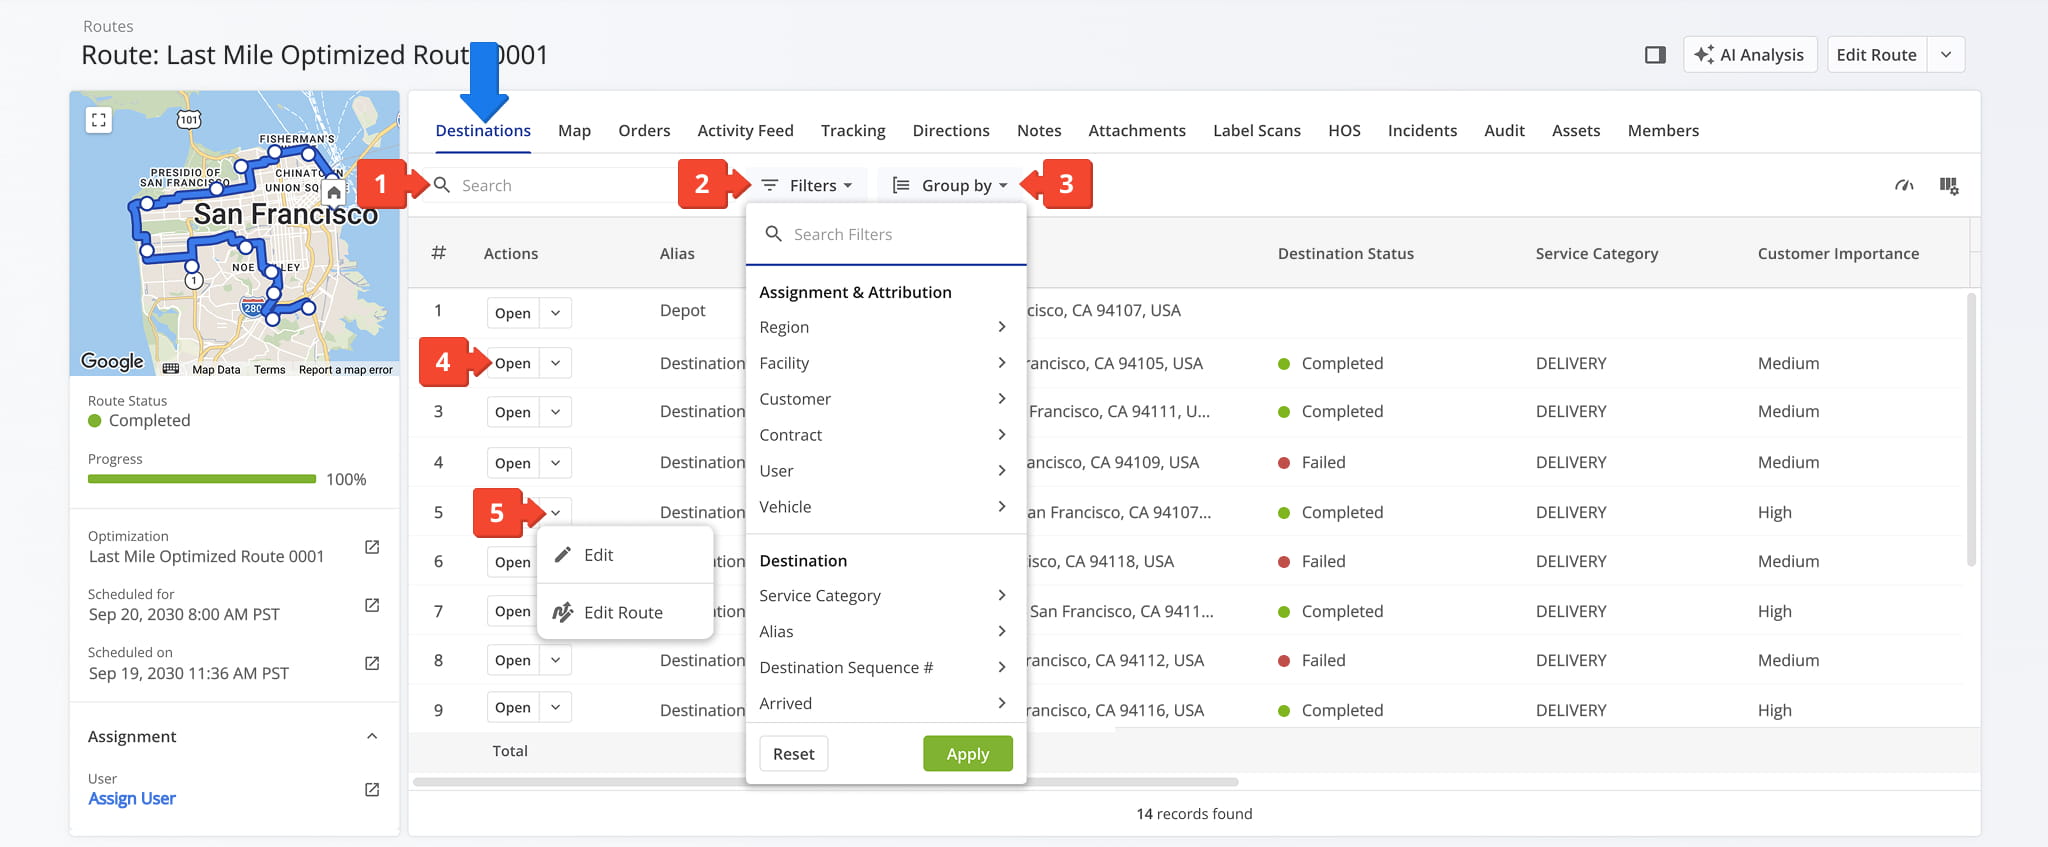
The Destinations data table provides an at-a-glance overview of essential details related to every destination on a route.


You can also customize the data displayed in the table. Click the Column Icon in the upper right corner to select which route data fields appear and adjust their order to suit your operational needs.

The table below provides an overview of all available data columns, which you can reorder by dragging them into place.
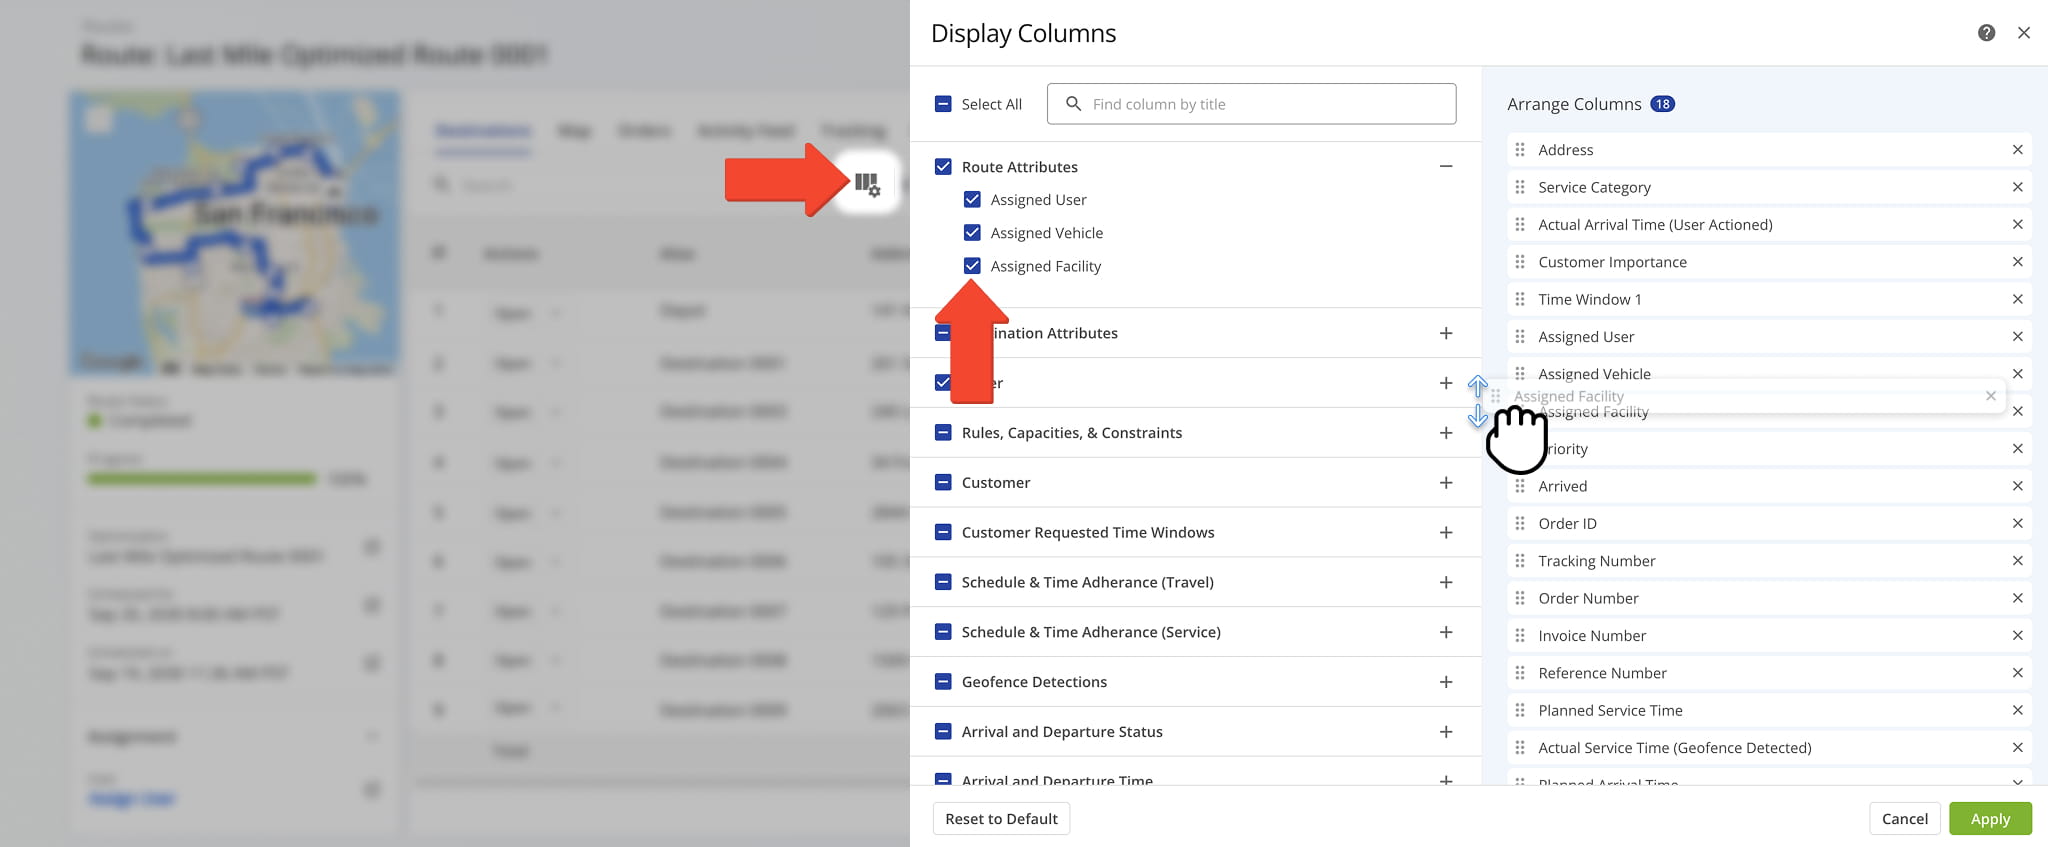
Customize your data table by selecting the data columns you want to see and arranging each column in the order you prefer.

Data
Description
Route Attributes

The user responsible for the route, typically the driver or team completing it.

The vehicle assigned to the route for tracking and capacity purposes.

The facility associated with the route, usually serving as the start or end location.

Destination Attributes

Depot

The starting location or home base for the route.

Destination Sequence #

The planned order of this destination within the route, indicating the sequence the driver should follow.

Address

The full street address of the destination for delivery or service.

Alias

A custom name or shorthand identifier for the destination to simplify identification.

Service Type

The type of service or delivery expected at the destination, e.g., pickup, drop-off, or service call.

Status

The current status of the destination (e.g., pending, in progress, completed, failed).

Timezone

The time zone of the destination, used for accurate scheduling of arrivals and departures.

Distance to Next Destination

The driving distance from this destination to the next stop on the route.

Drive Time to Next Destination

The estimated travel time from this destination to the next stop, based on planned routing.

Man-Hours

Employee working hours required for completing the destination visit.

Order

Unique identifier for the order in the system.

Tracking Number

The shipping or tracking number associated with the order for logistics purposes.

Order Number

Reference number assigned to the order by the system or customer.

Invoice Number

The invoice number linked to the order.

Reference Number

Additional reference or internal tracking number associated with the order.

Notes Count

Total number of notes added to a destination by users or automated processes.

Customer Billing Type

The billing classification applied to the customer associated with the destination.

Rules, Capacities, & Constraints

The priority level of the order or destination, which may affect route sequencing.

The volume of items for the destination, used for vehicle load planning.

The total quantity of items or units for delivery or service at the destination.

The total weight of items for the destination, used for vehicle capacity planning.

The expected revenue associated with completing the order at the destination.

Cost

The cost value associated with completing the order at the destination.

Customer

The name of the customer receiving the service or delivery.

First Name

Customer’s first name for identification and communication purposes.

Last Name

Customer’s last name for identification and communication purposes.

Email

Customer’s email address, used for notifications or tracking updates.

Phone

Customer’s phone number, used for notifications or communication.

Customer PO

The customer’s purchase order number associated with the order.

Group

A classification or grouping of the customer, often used for reporting or filtering.

Customer Requested Time Windows

The first requested time window for service at the destination.

The second requested time window for service, if applicable.

Schedule & Time Adherence (Travel)

Actual Arrival Time (User Actioned)

The arrival time recorded manually by the user. “User Actioned” means it was entered or confirmed by a person rather than automatically detected.

Actual Departure Time (User Actioned)

The departure time recorded manually by the user.

Schedule & Time Adherence (Service)

The expected duration of service at the destination based on planning.

Actual Service Time (User Actioned)

The service duration recorded manually by the user, reflecting the real-world time spent completing the service or delivery.

Geofence Detections

The service duration automatically recorded when the user is within the destination geofence.

The arrival time automatically detected when the vehicle enters the geofence.

The departure time automatically detected when the vehicle exits the geofence.

Entry Speed (Geofence Detected)

Vehicle speed upon entering the geofence, useful for safety and compliance tracking.

Entry Odometer (Geofence Detected)

Odometer reading when the vehicle enters the geofence.

Entry Engine Hour (Geofence Detected)

Engine hour meter reading recorded when the vehicle enters the geofence.

Exit Speed (Geofence Detected)

Vehicle speed upon leaving the geofence.

Exit Odometer (Geofence Detected)

Odometer reading when the vehicle leaves the geofence.

Exit Engine Hour (Geofence Detected)

Engine hour meter reading recorded when the vehicle exits the geofence.

Device ID (Geofence Detected)

The identifier of the device that recorded the geofence event.

Vehicle ID (Geofence Detected)

The identifier of the vehicle associated with the geofence detection.

The telematics-assigned vehicle ID used to track geofence events.

Arrival & Departure Status

Arrived

Indicates whether the destination has been marked as arrived, either manually or via geofence detection.

Departed

Indicates whether the destination has been marked as departed, either manually or via geofence detection.

Arrival & Departure Time

Planned Arrival Time

The scheduled time for arrival at the destination based on route planning.

Planned Departure Time

The scheduled time for departure from the destination.

Actual Arrival Time (User Actioned)

The user-recorded arrival time at the destination.

Actual Departure Time (User Actioned)

The user-recorded departure time from the destination.

Dynamic Arrival Time

The estimated arrival time that adjusts in real-time based on traffic or route changes.

Dynamic Departure Time

The estimated departure time that adjusts in real-time based on traffic or route changes.

Arrival / Departure Schedule Deviation

Time Window Violated (User Actioned)

Indicates if the arrival or departure fell outside the scheduled time window, as recorded manually.

Arrival Time Variance (-Early,+Late) (User Actioned)

The difference in minutes between the planned and actual arrival times, manually recorded. Negative indicates early arrival, positive indicates late.

Departure Time Variance (-Early,+Late) (User Actioned)

The difference in minutes between planned and actual departure times, manually recorded. Negative indicates early departure, positive indicates late.

Planned Remaining Capacity

Planned Remaining Cube

Estimated remaining volume capacity of the vehicle after servicing this destination.

Planned Remaining Pieces

Estimated remaining item/unit capacity of the vehicle after servicing this destination.

Planned Remaining Revenue

Expected remaining revenue after servicing this destination.

Planned Remaining Weight

Estimated remaining weight capacity of the vehicle after servicing this destination.


Orders Tab – Route Orders And Customer Order Data Overview

The Orders tab displays all orders associated with the selected route in a structured data table. The available order data matches what appears on the Orders Page.

From this tab, you can perform the following actions for each order on the route:

  1. Use the Search field to locate specific orders.
  2. Apply filters to narrow the data. See the table below for a complete list of available filters.
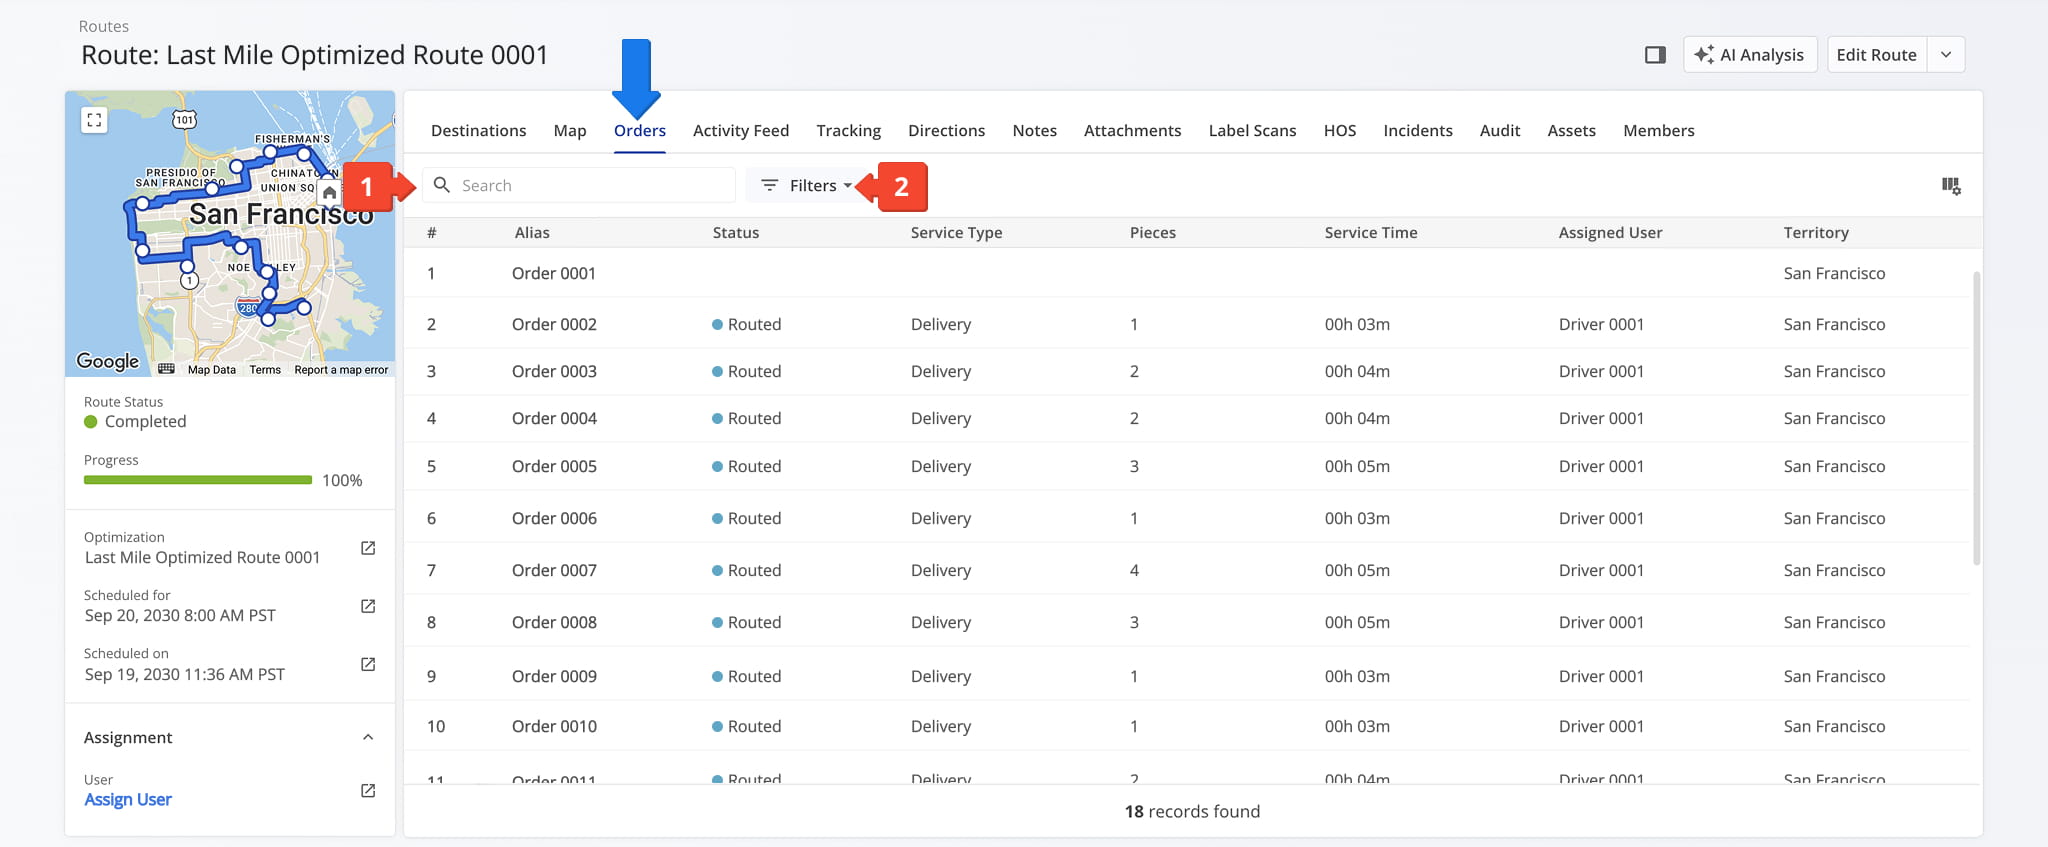
  3. View countdowns, including elapsed time and remaining time for each order.

The Orders tab offers an overview of key data associated with each order on your final mile route.


You can also customize the data displayed in the table. Click the Column Icon in the upper right corner to select which route data fields appear and adjust their order to suit your operational needs.

The table below provides an overview of all available data columns, which you can reorder by dragging them into place.
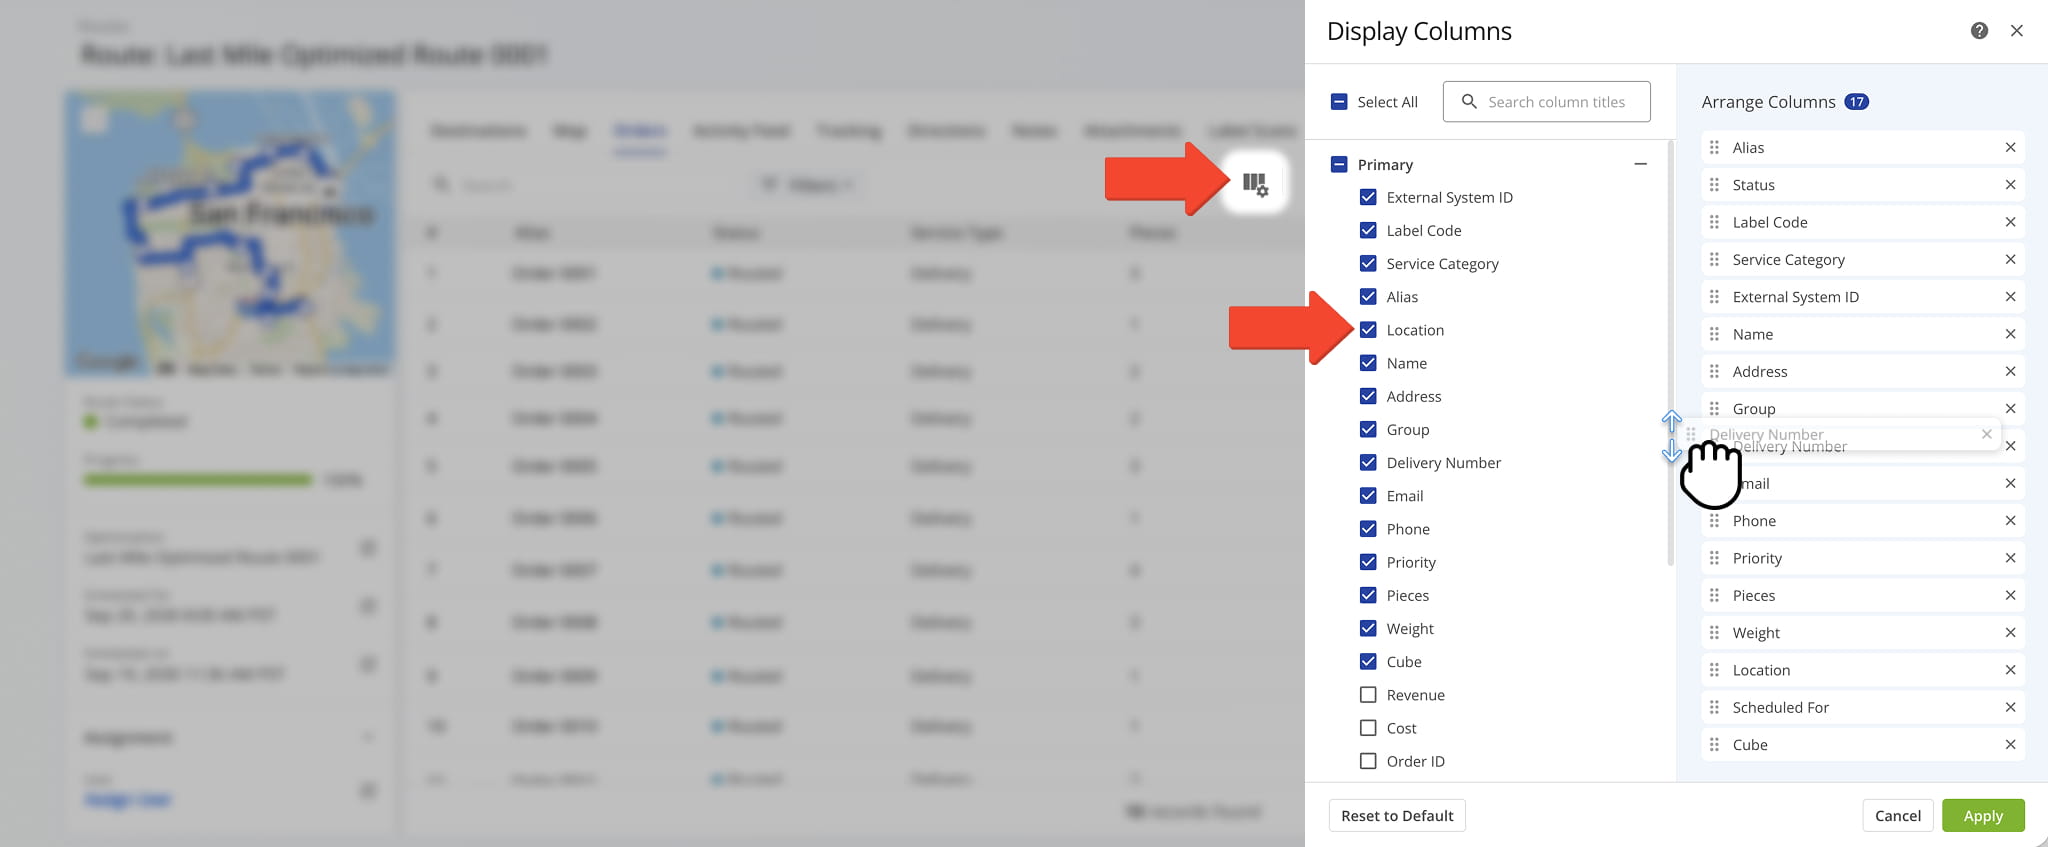
The Orders Data Table can be customized by checking the boxes next to the orders you wish o see according to your workflow and enterprise needs.


Activity Feed Tab – Route Activity Overview

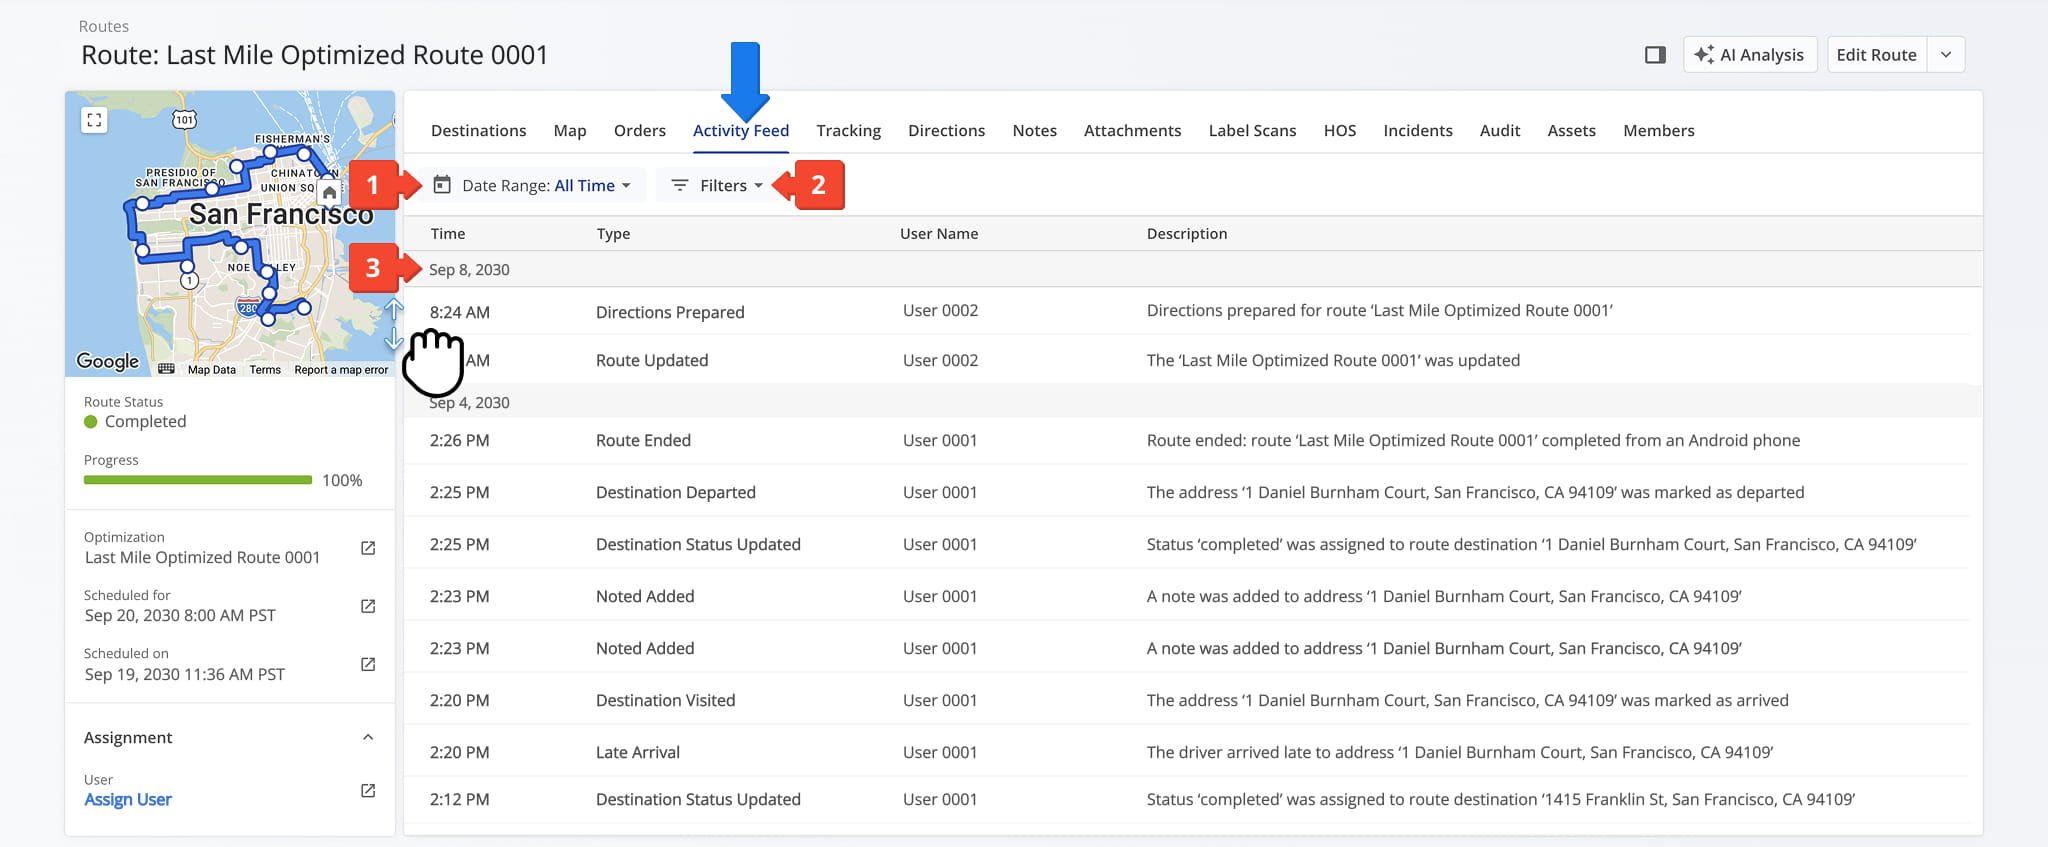
The Activity Feed tab shows a chronological list of route events, including destination updates and Route Editor changes, and matches the entries available in your standard Activity Feed. From this tab, you can:

  1. Filter activities by a specific date or date range.
  2. Refine the list by Filter options, detailed in the table below.
  3. Collapse or expand activities by date by clicking the arrow next to a specific date.

Use Filters or Data Range options to quickly locate data related to specific route activities.


Tracking Tab – Route Location Updates Overview

The Tracking tab displays all location updates associated with a route. Each update shows a timestamp, coordinates, vehicle details, operational status, movement, speed, and telemetry data when available via Telematics Integration.

Click the Info Icon to view the route’s tracked location on a map, along with latitude, longitude, and speed at that moment.
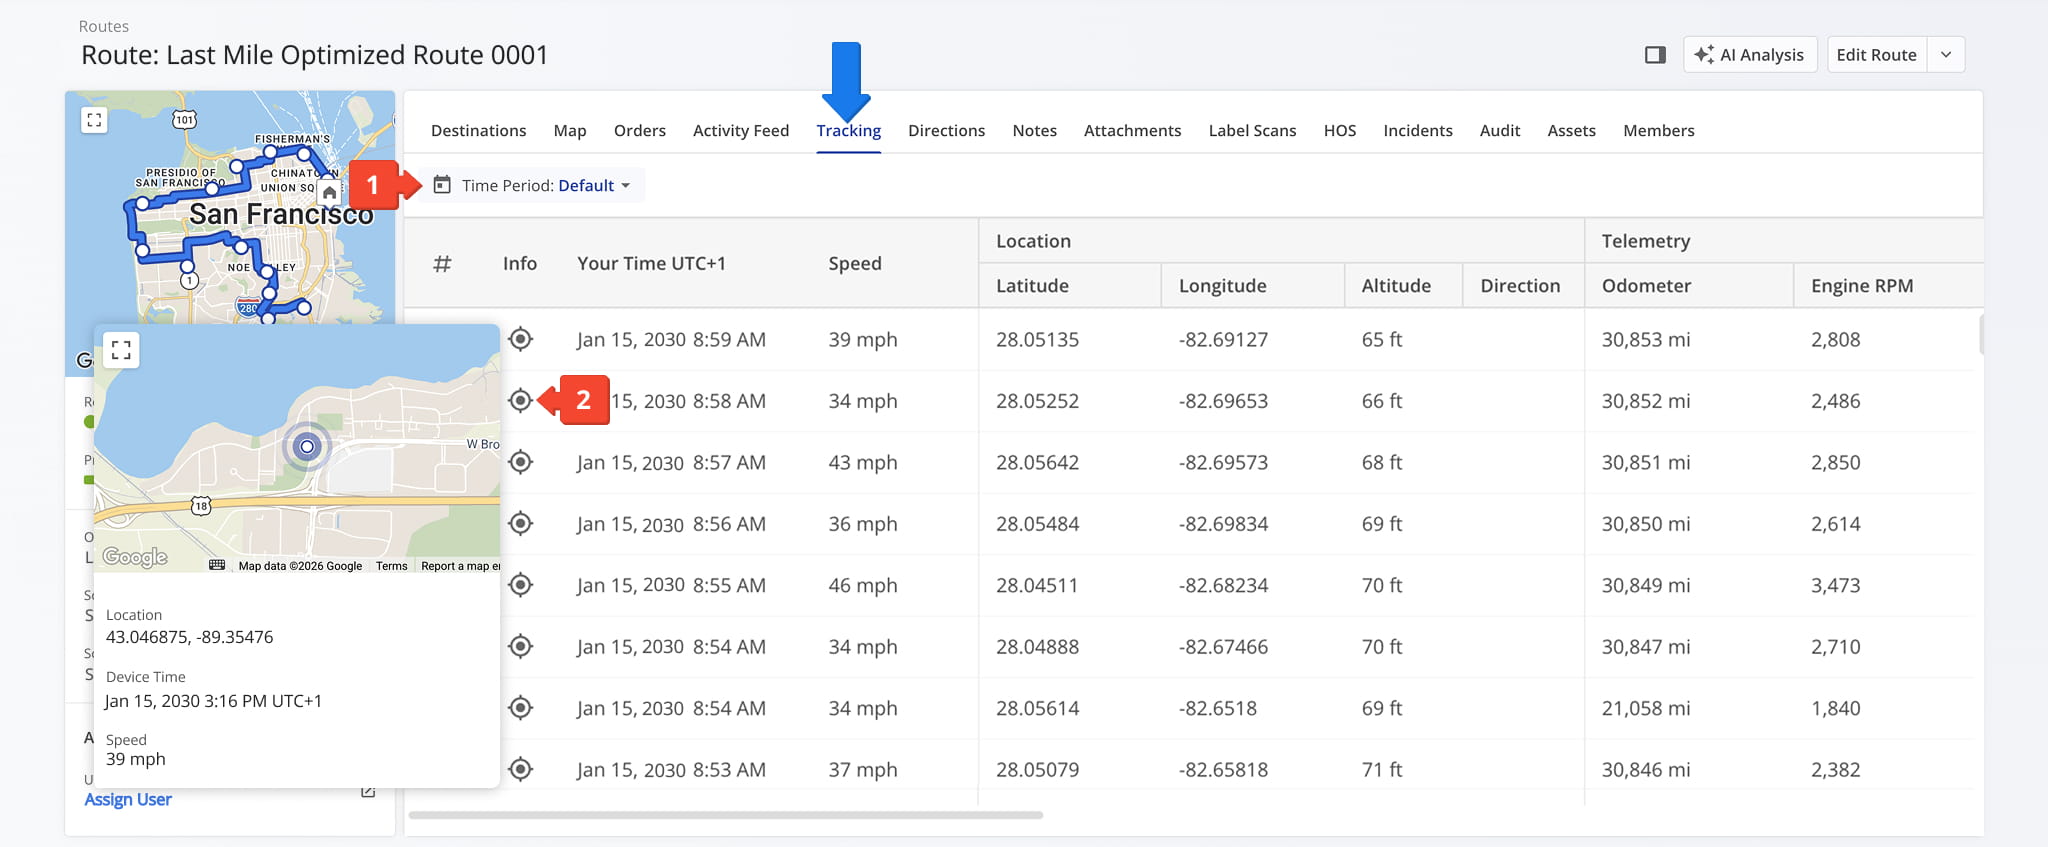
From the Tracking tab, click the Location Icon to vie a map with the destination


Directions Tab – Route Navigation Details

The Directions tab provides a detailed list of turn-by-turn navigation instructions for the selected route. Directions are organized by destination and include maneuvers, distances, and navigation events. From this tab, you can:

  1. View navigation directions organized by destination.
  2. Click the arrow next to a destination to expand and review its full list of maneuver instructions.
  3. Review the distance and estimated time to the next maneuver for each step.
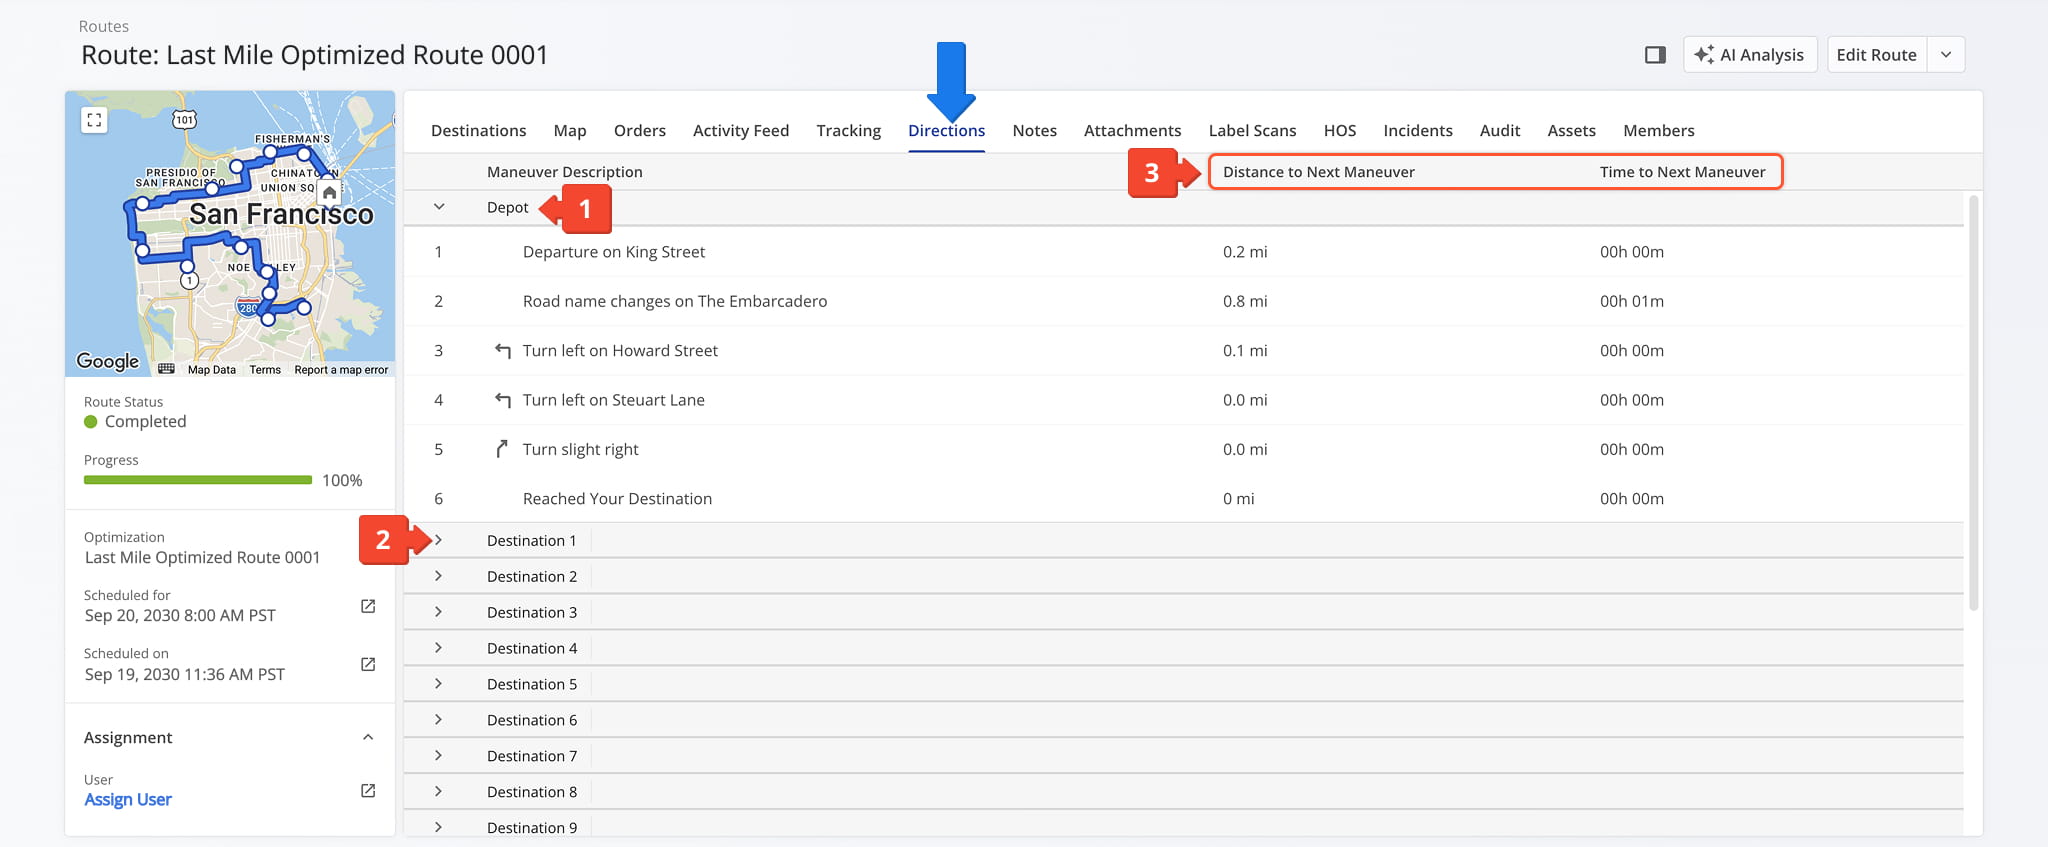
From the Directions Tab, get detailed turn-by-turn directions for every destination on the route.


Notes Tab – Route Activity And Destination Notes

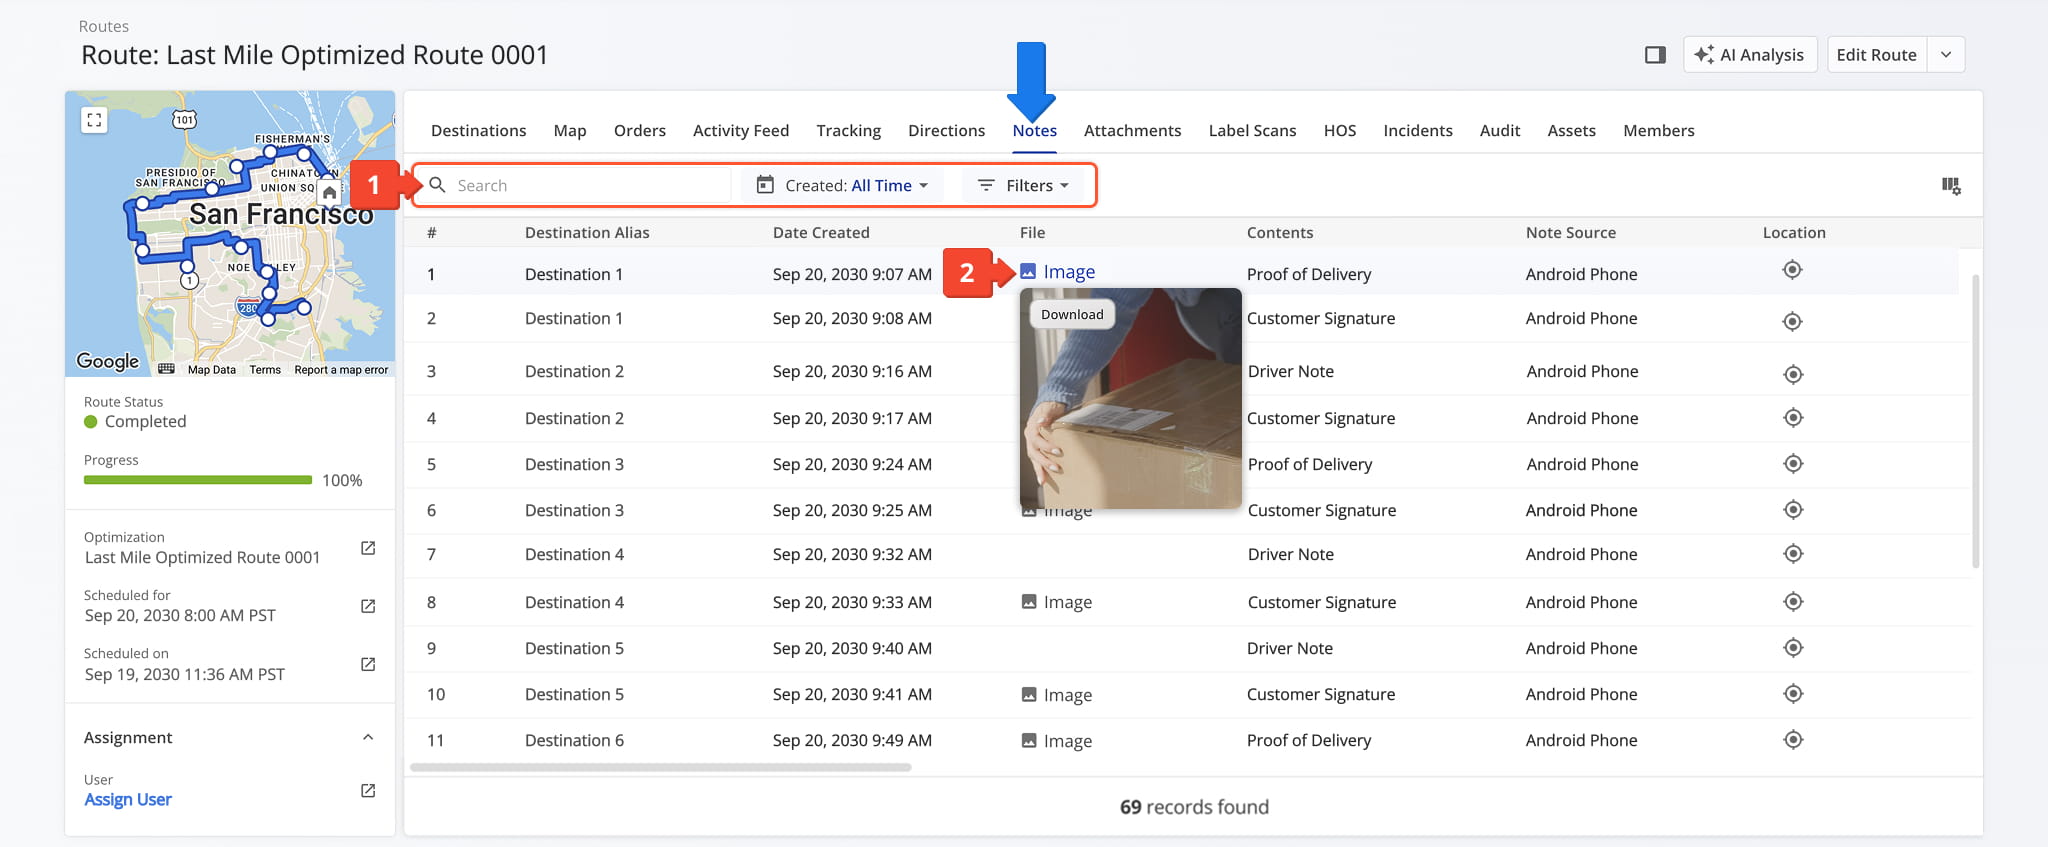
The Notes tab provides a list of Destination Status Notes added to each destination by the assigned user. From here, you can:

  1. Use the search field to quickly find specific Notes, apply filters (described below), or organize Notes using the Group By option.
  2. Click any image, such as a signature or photograph, to view an enlarged version.
  3. Click the Download Arrow Icon to save the image

From the Notes tab, you can view all notes attached to a route along with detailed Workflow and Workflow Actions information.


You can also customize the data displayed in the table. Click the Column Icon in the upper right corner to select which route data fields appear and adjust their order to suit your operational needs.

The table below provides an overview of all available data columns, which you can reorder by dragging them into place.
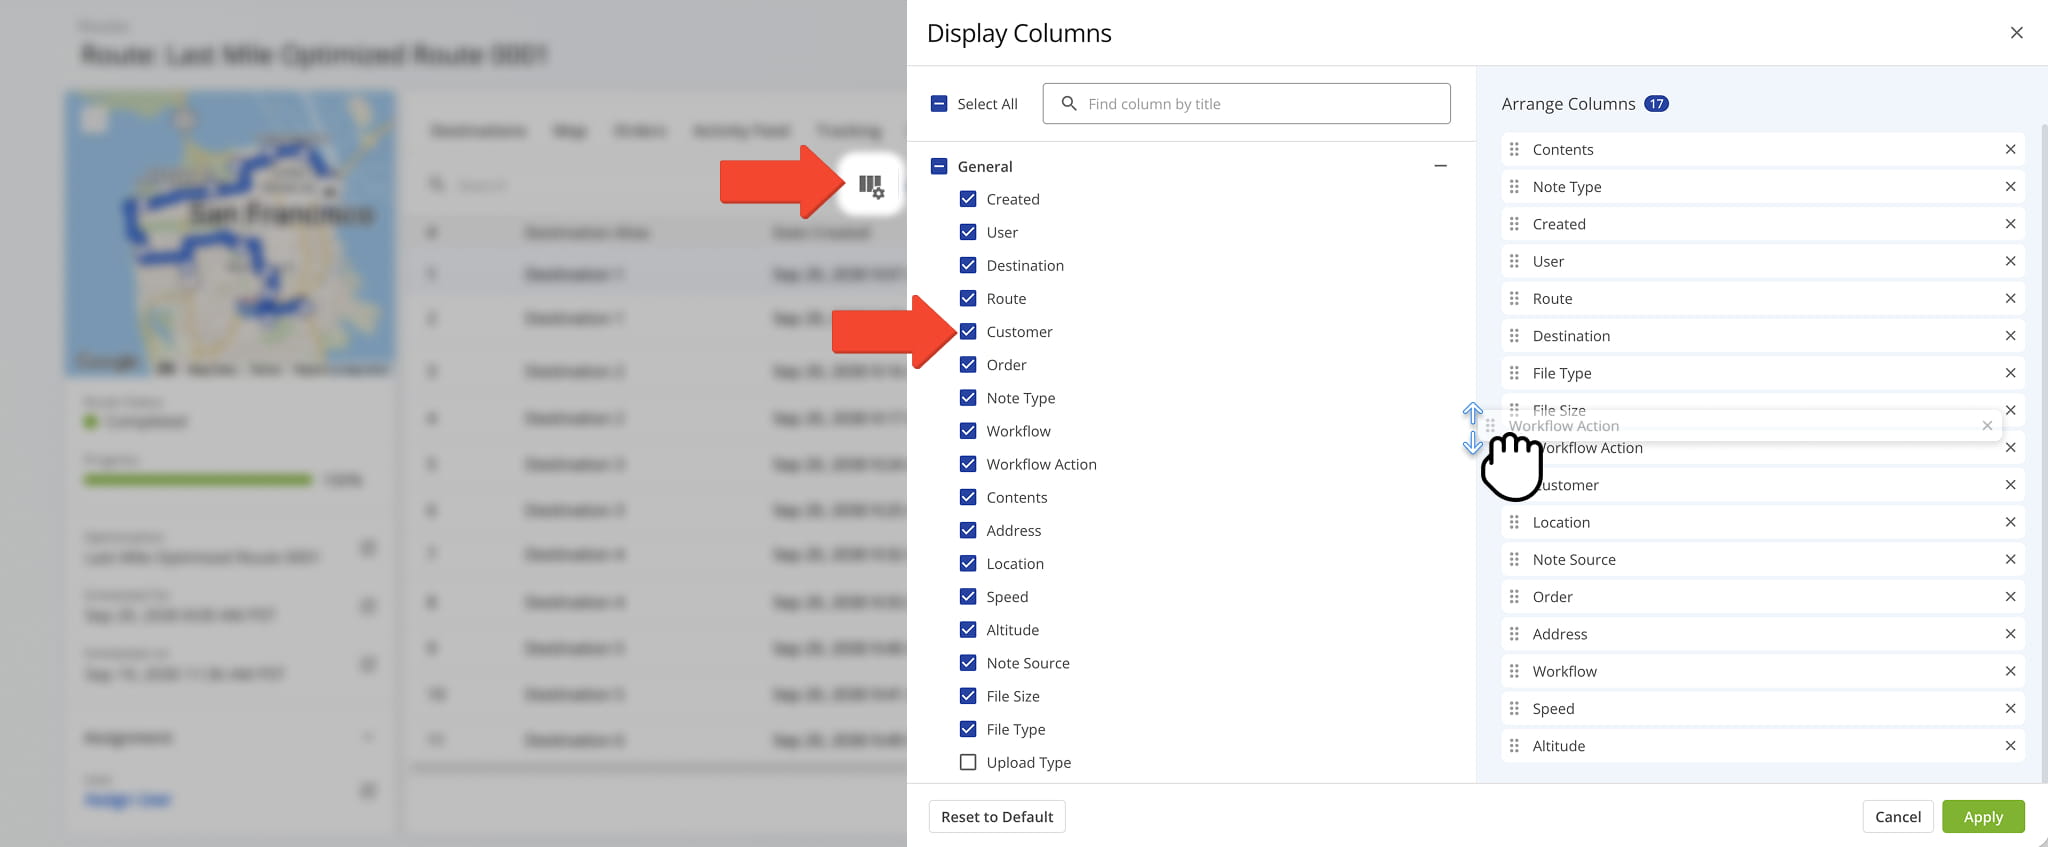
To customize data that appears on your Route Note Data Table, re-sequence data columns to meet your specific needs.


Attachments Tab – Destinations Files And Proof Of Visit

The Attachments tab provides an overview of all files linked to destinations, helping you quickly locate the attachments you need without switching between tabs or views. From this tab, you can:

  1. Use the search field to quickly find specific attachments.
  2. Use filter, described in the table below, to limit which attachments you see.
  3. Click the Information Icon to view attachment details.
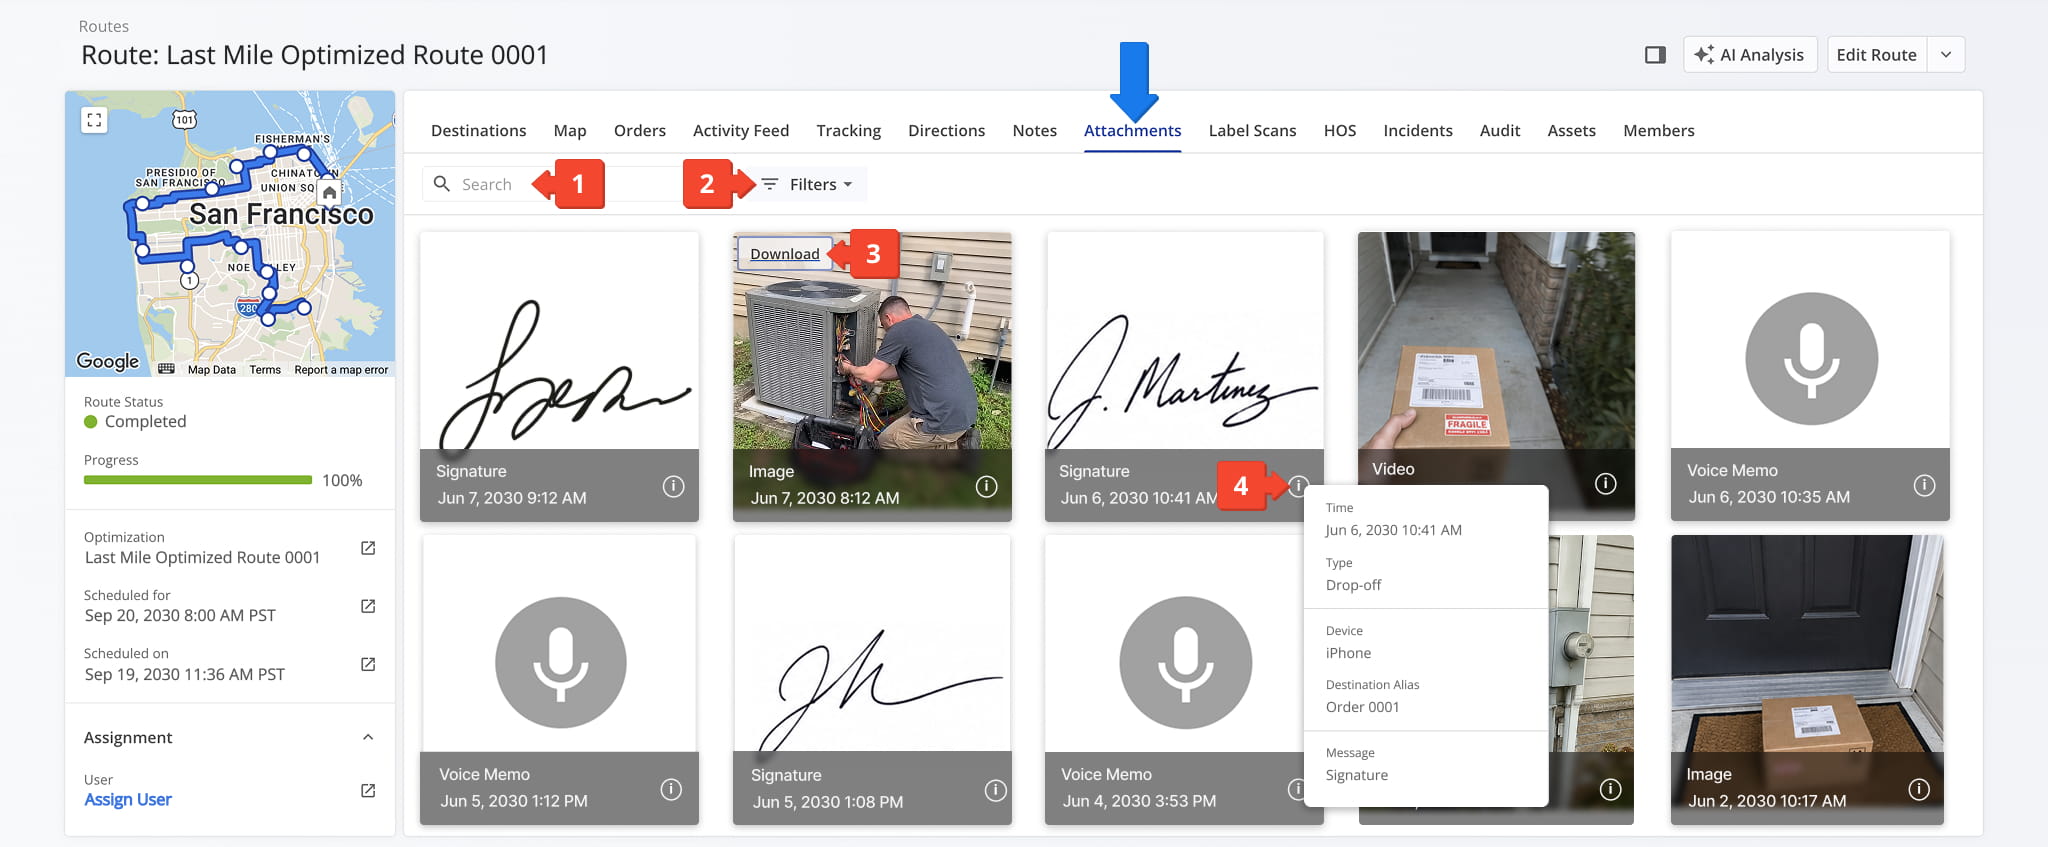
From the Attachments tab, view all images, signatures, videos, and voice memos attached to destinations on the route.


Label Scans Tab – Scan Activity Overview

The Label Scans tab displays all scan activity associated with a route. From this tab, you can review timestamps, actions, scan type details, user details, and location coordinates.
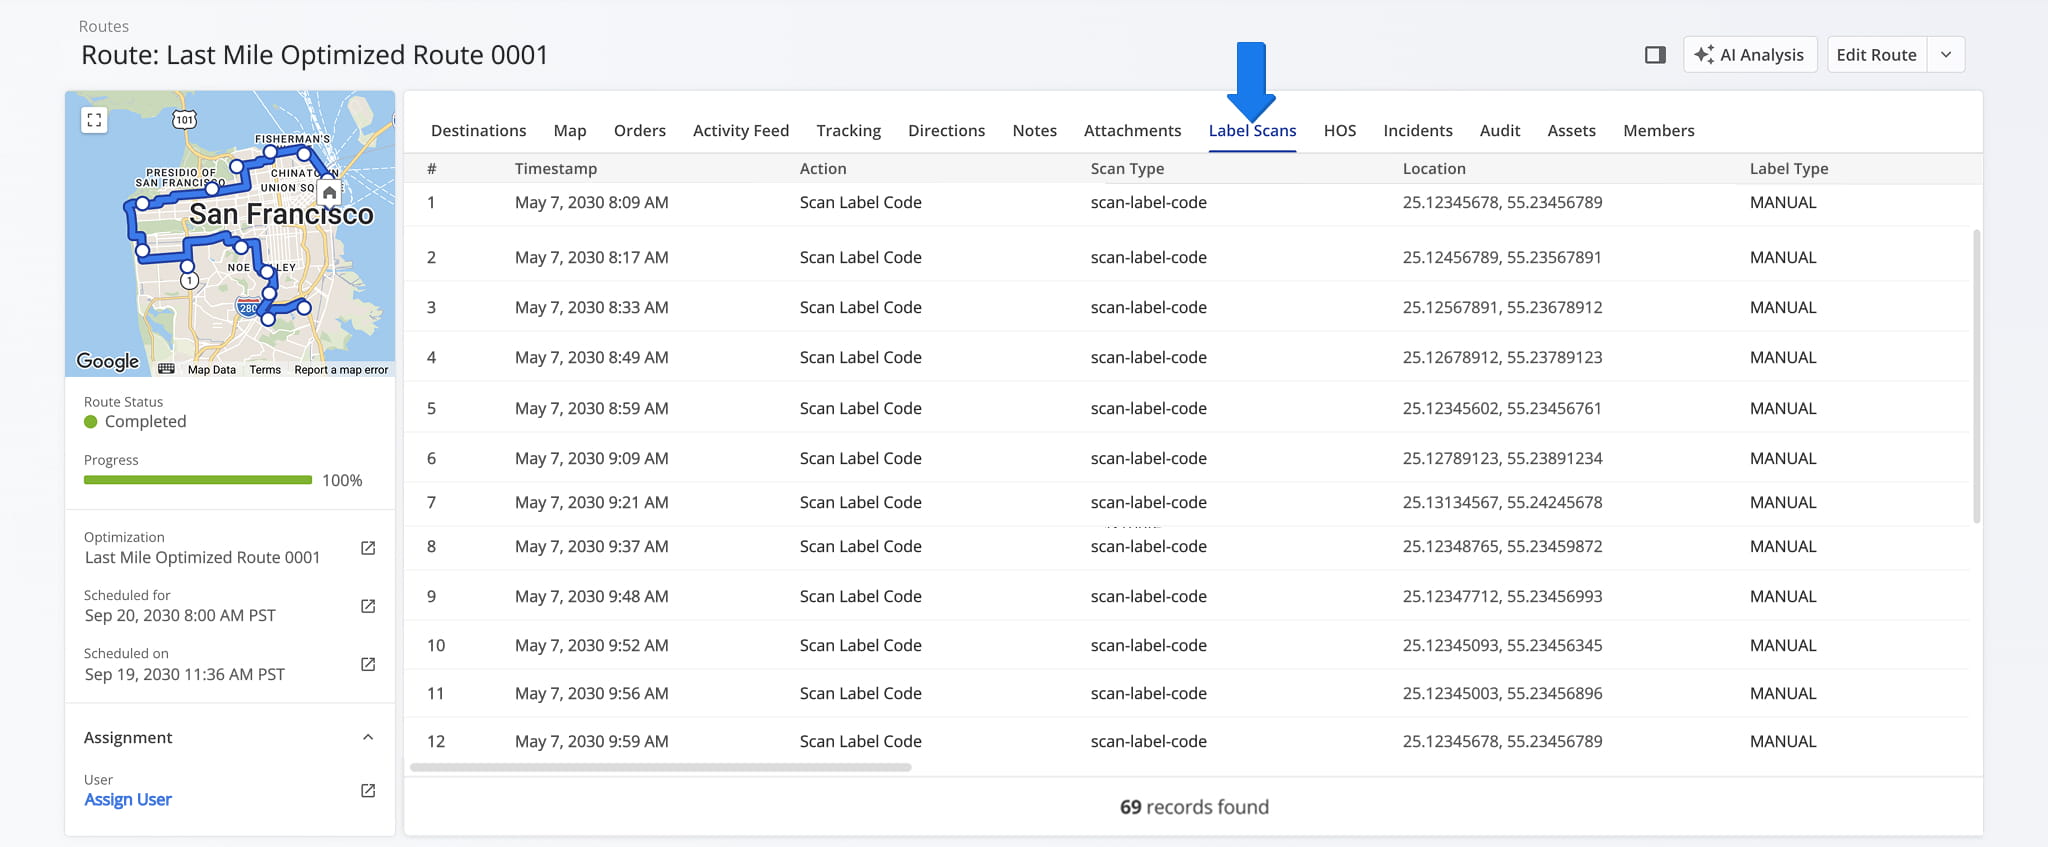
From the Label Scan tab in your Route Snapshot, you can access an overview of all scan activity associated with a route.


HOS Tab – Service Activity Overview

The HOS tab provides an overview of all Hours of Service activity associated with a route. From this tab, you can:

  1. Search for specific HOS activity using the available search field.
  2. Filter results by date or a selected date range.
  3. Refine the data table using filters, described in the table below.
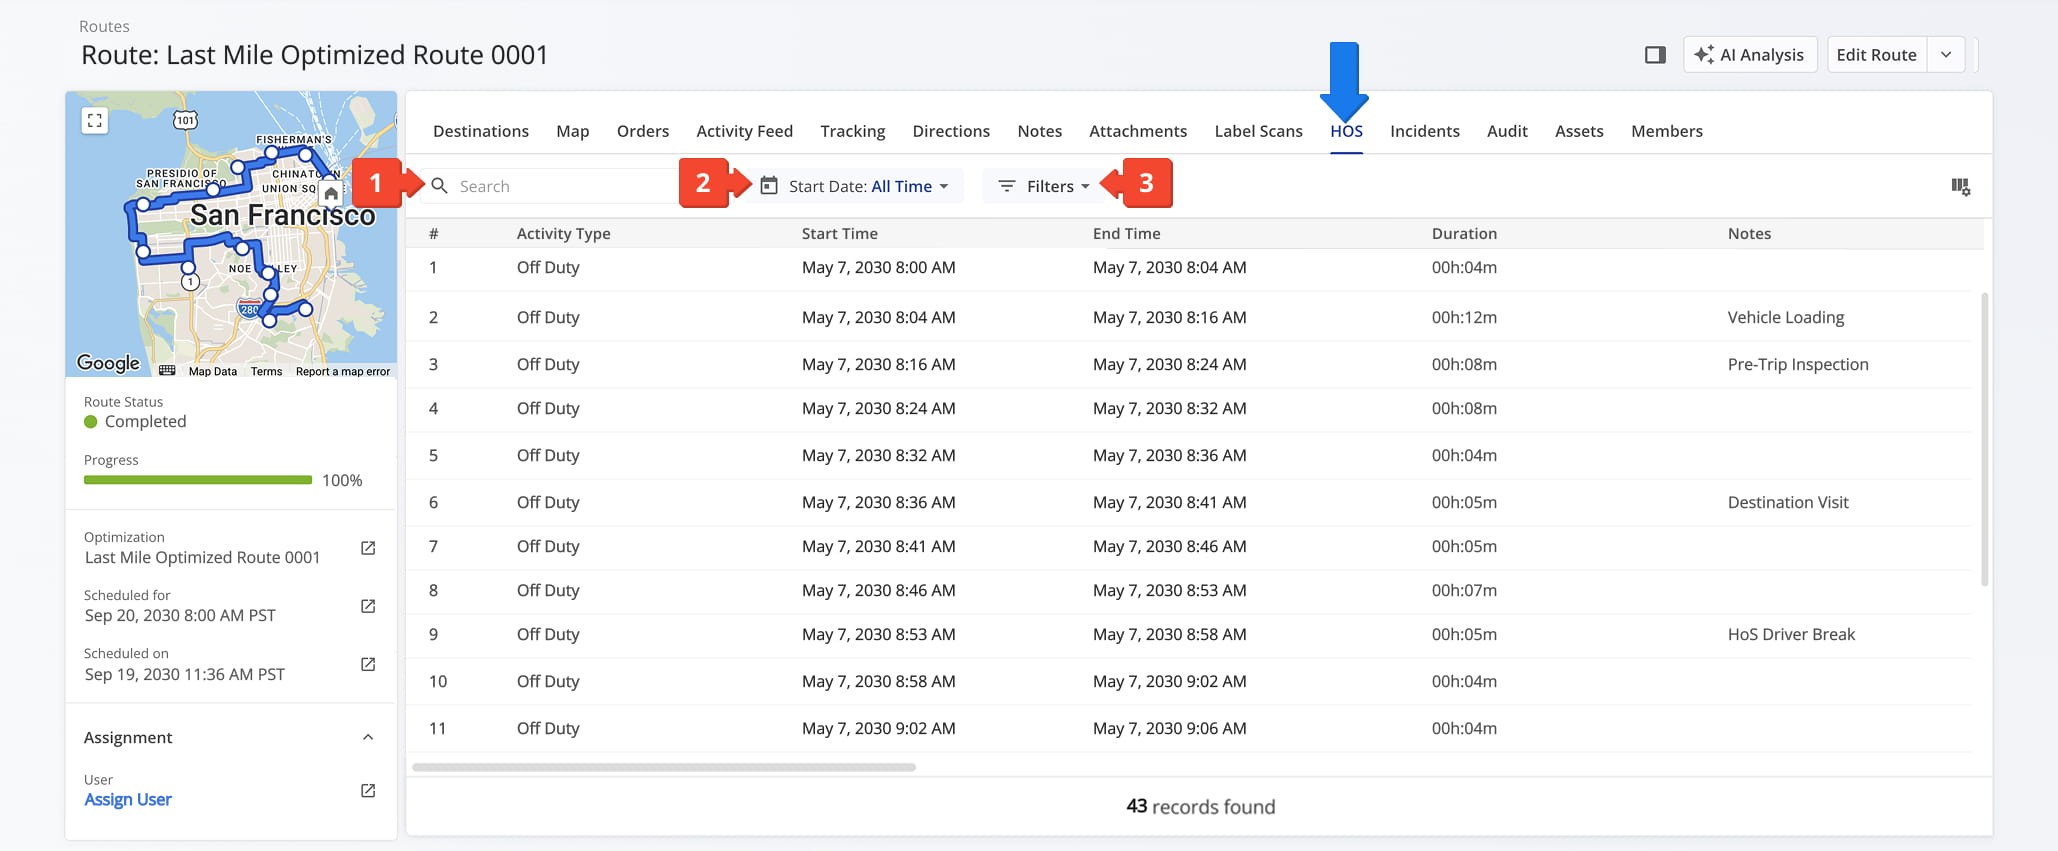
From the Hours of Service (HOS) tab of your Route Snapshot, review all service data associated with a specific last mile route.


You can also customize the data displayed in the table. Click the Column Icon in the upper right corner to select which route data fields appear and adjust their order to suit your operational needs.

The table below provides an overview of all available data columns, which you can reorder by dragging them into place.
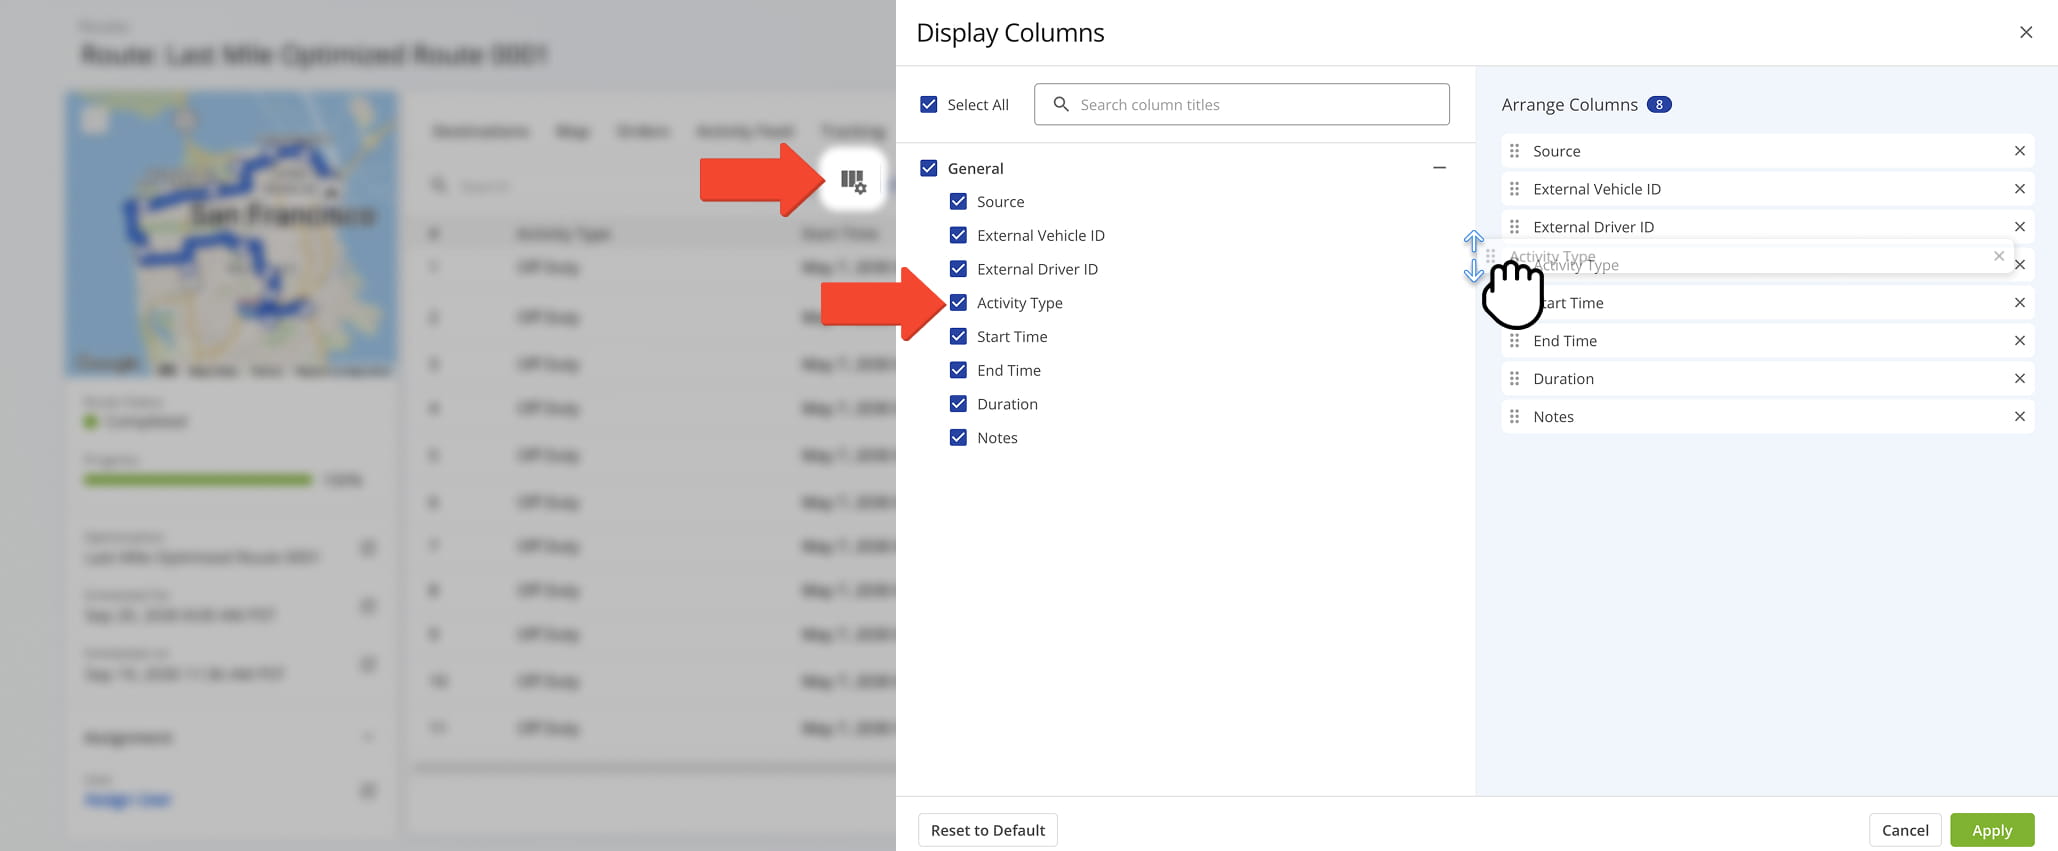
Customize the HOS data table by selecting data you wish to see and the order in which it appears.


Incidents Tab – Recorded Safety Incidents And Incident Data

The “Incidents” tab displays all recorded safety incidents – pulled from your telematics device and dash cams – along with their details. From this tab, you can:

  1. Use the Search field to locate specific incidents.
  2. Define an Event Time or use Filters, described in the table below, to narrow which incidents appear in the data table.
  3. Click the “View Media” button to open the media player and inspect the recording associated with an incident.

NOTE: Learn more about these features in our dedicated guide to Route4Me incidents reports.
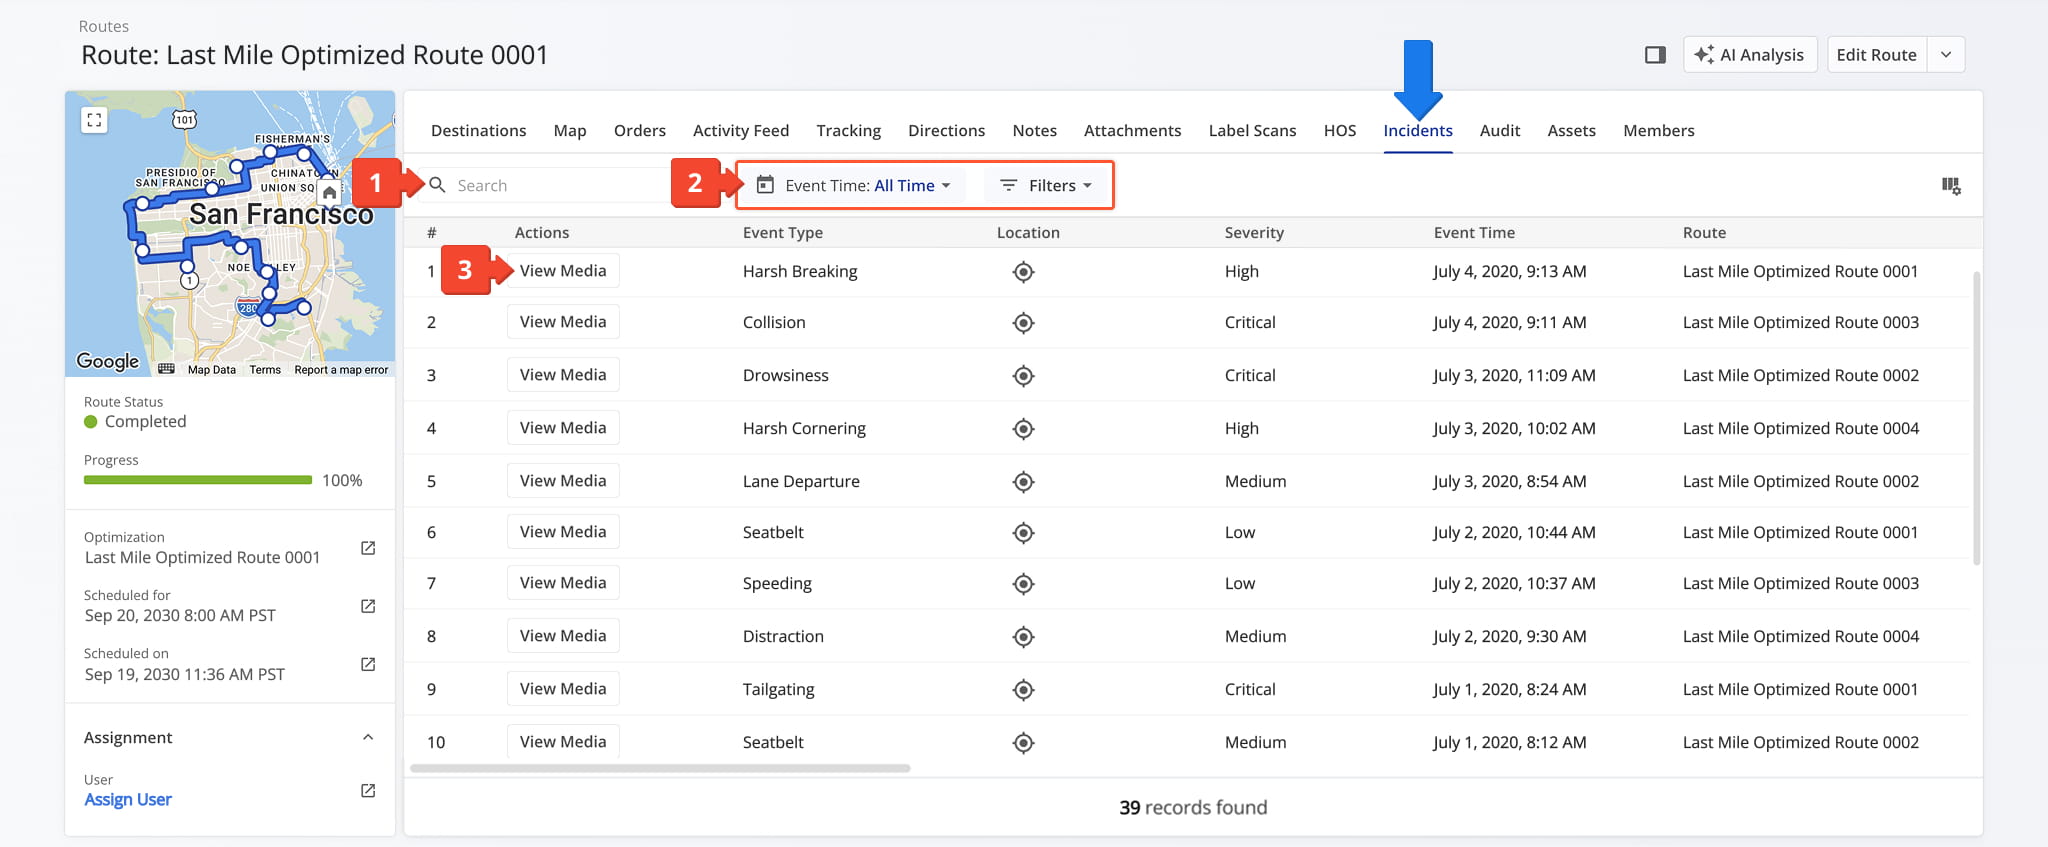
 

You can also customize the data displayed in the table. Click the Column Icon to select which route data fields appear and adjust their order to suit your operational needs.

The table below provides an overview of all available data columns, which you can reorder by dragging them into place.
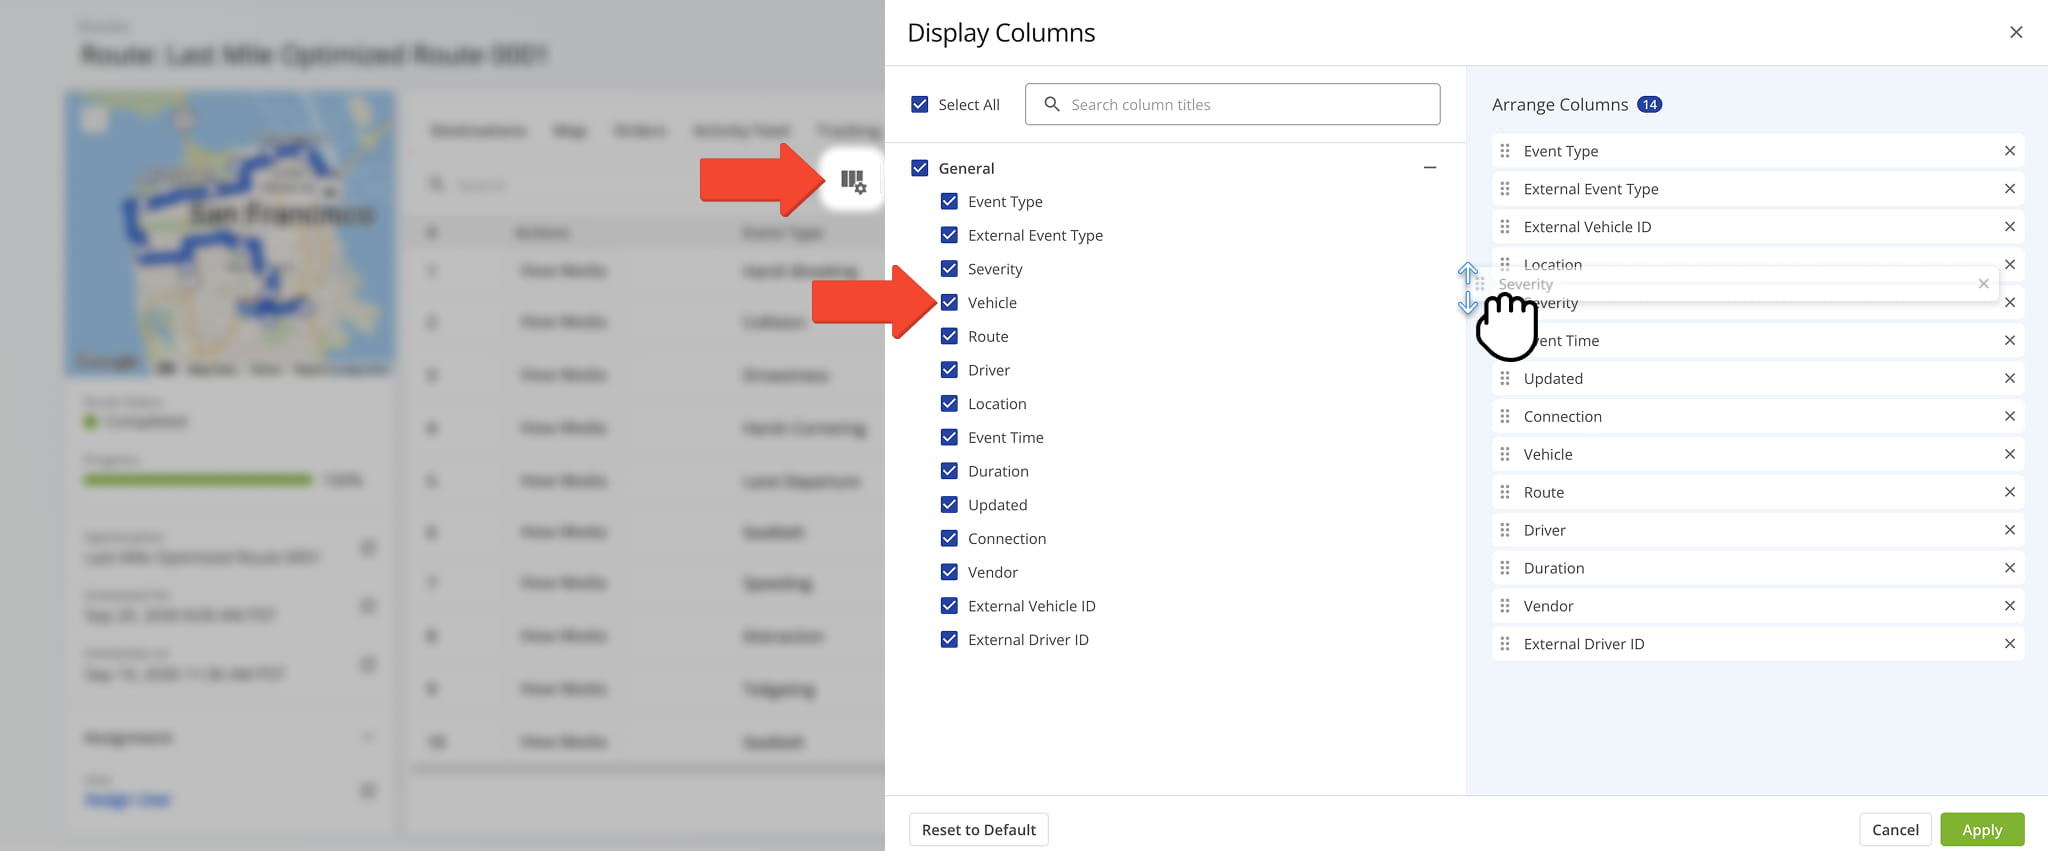
Customize the data displayed in the table.


Audit Tab – Route Performance Playback And Plan Vs. Actual Progress Overview

The Audit tab provides a real-time and historical view of route execution, allowing you to compare planned performance against actual driver progress. From this tab, you can:

  1. Click one of the playback view buttons to analyze route performance from a unique perspective.
  2. Use playback controls to replay route execution at speeds from 0.1× to 2× to review route progression over time.
  3. Use the route map and status bar to monitor route progress and overall completion.
  4. Review the “Progress” chart to compare actual completion against the plan.
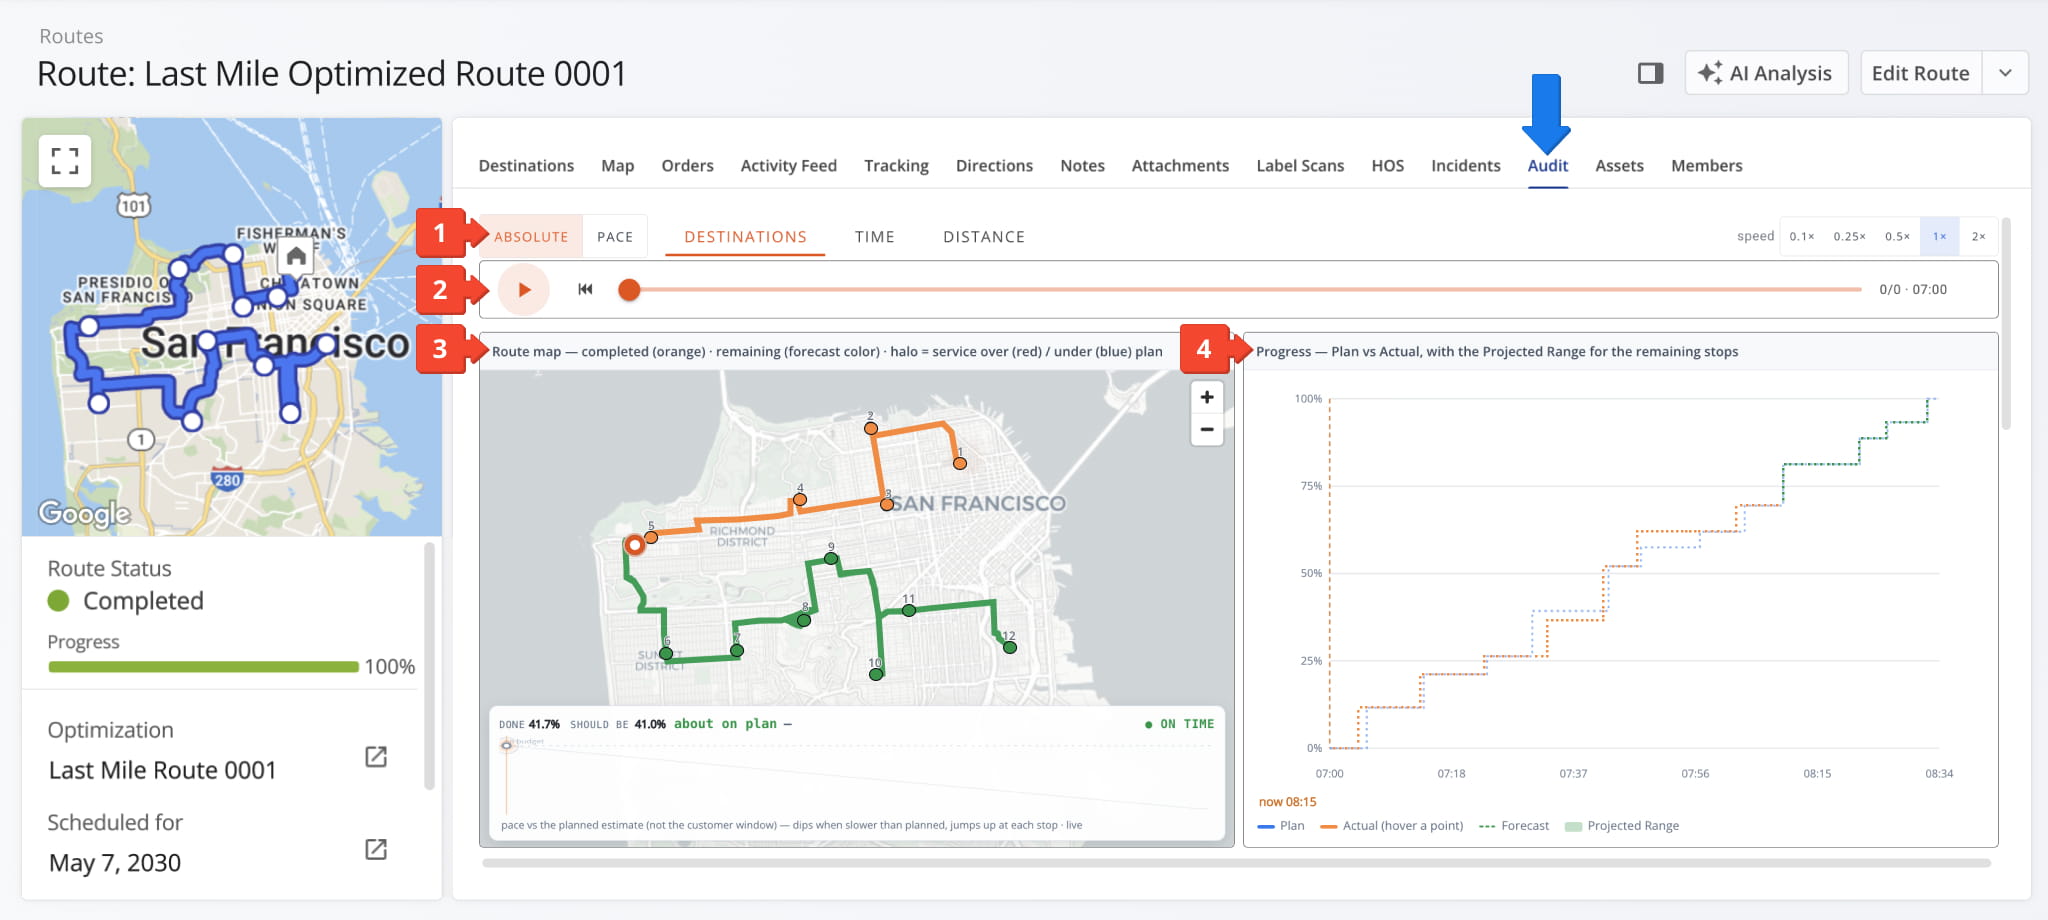
Use the Audit tab to analyze route execution and evaluate actual performance against the planned route.


Scroll down the Audit tab to review additional route performance panels, including “Route Health“, “Route Status Over Time“, “Window Adherence“, and more.
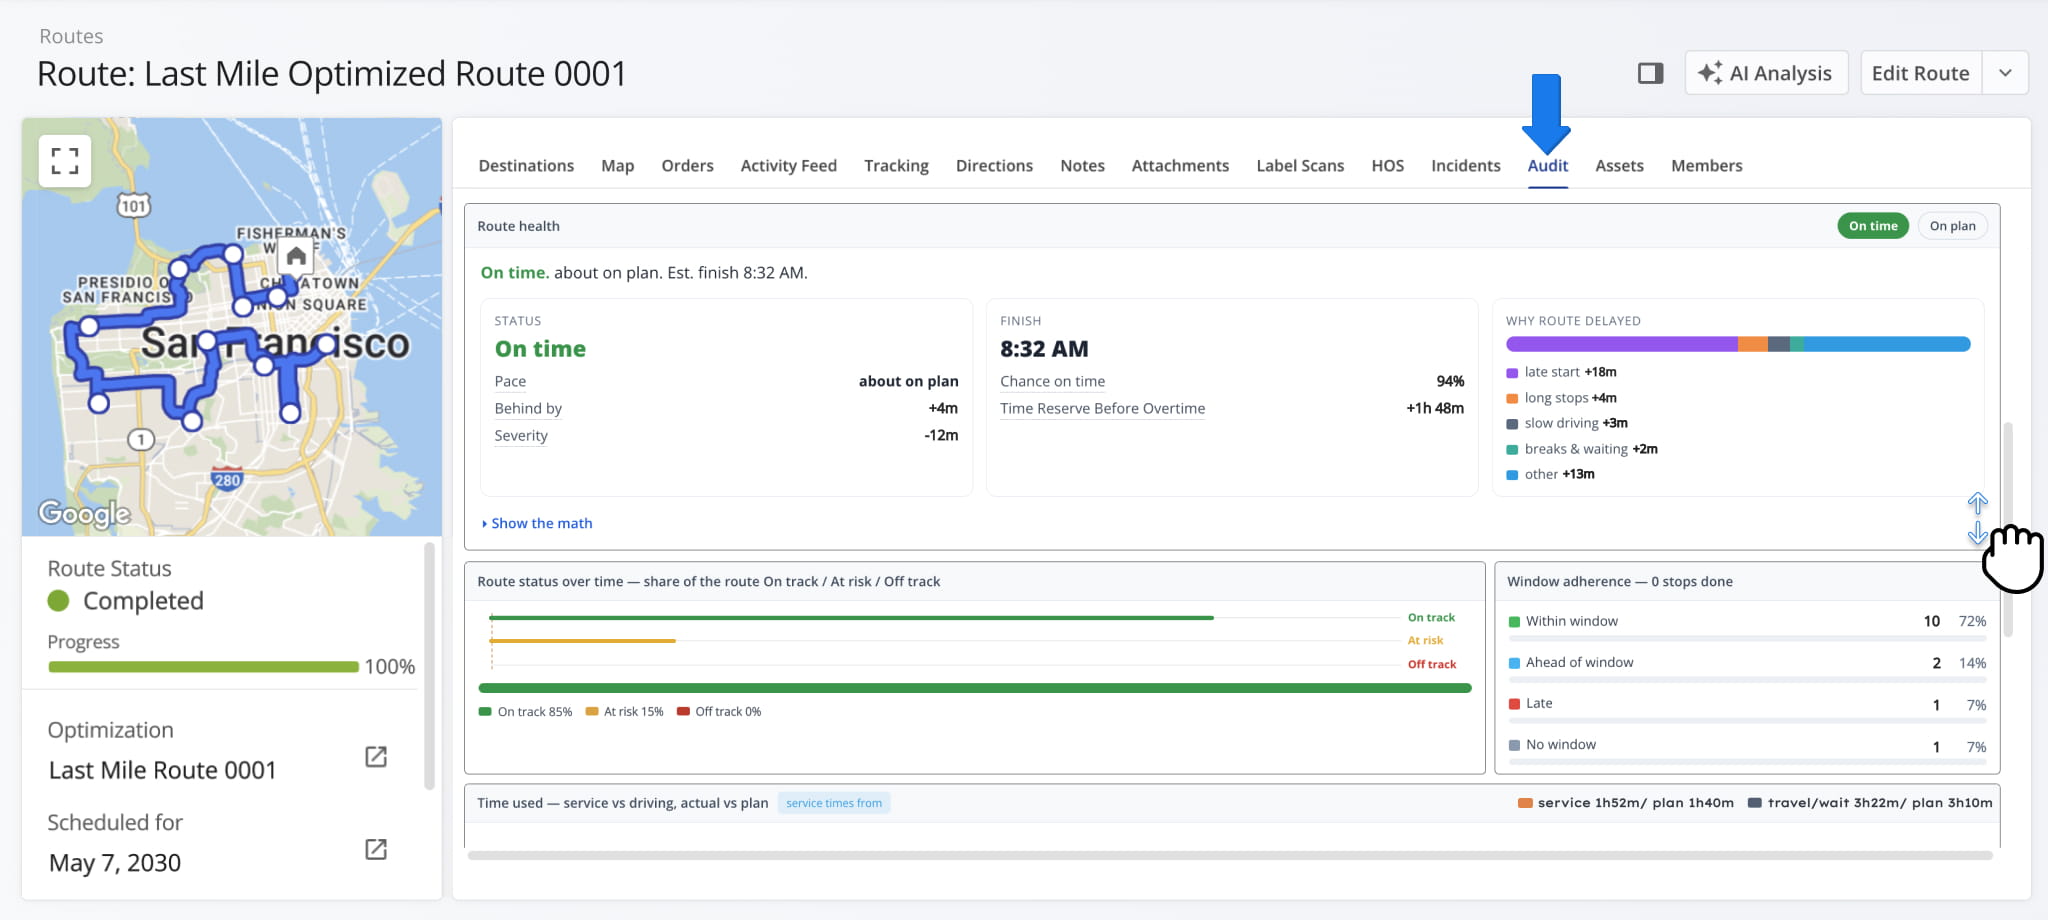
Review metrics related to route status over time, route health, window adherence, and more.


Assets Tab – Route Assets Overview

The Assets tab displays all assets associated with the selected route. From this tab, you can:

  1. Use the Search field to locate specific assets by name or identifier.
  2. Apply Filters to narrow down the asset list. See the table below for a full list of available filters.
  3. Use the Group By option to organize assets by asset type or whether they were externally originated.
  4. Click “Open” next to an asset to access its Asset Snapshot.
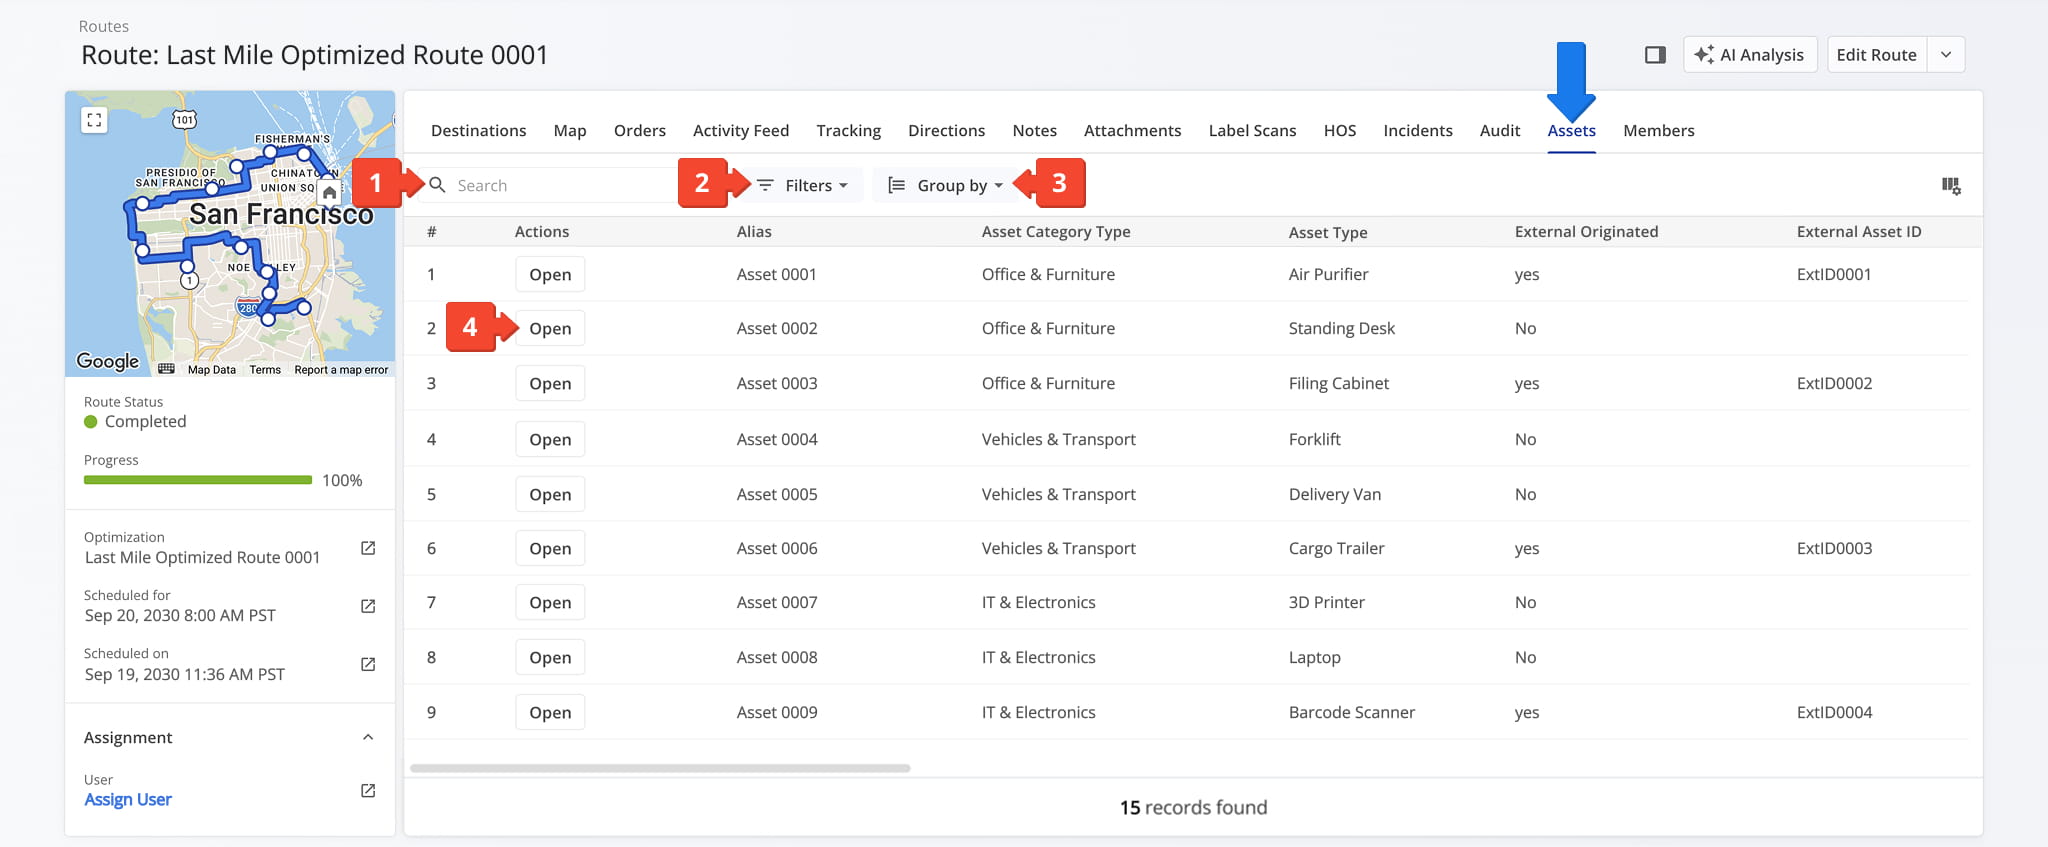
The Assets tab provides a searchable, filterable overview of all assets associated with the selected route.


You can also customize the data displayed in the table. Click the Column Icon in the upper right corner to select which route data fields appear and adjust their order to suit your operational needs.

The table below provides an overview of all available data columns, which you can reorder by dragging them into place.
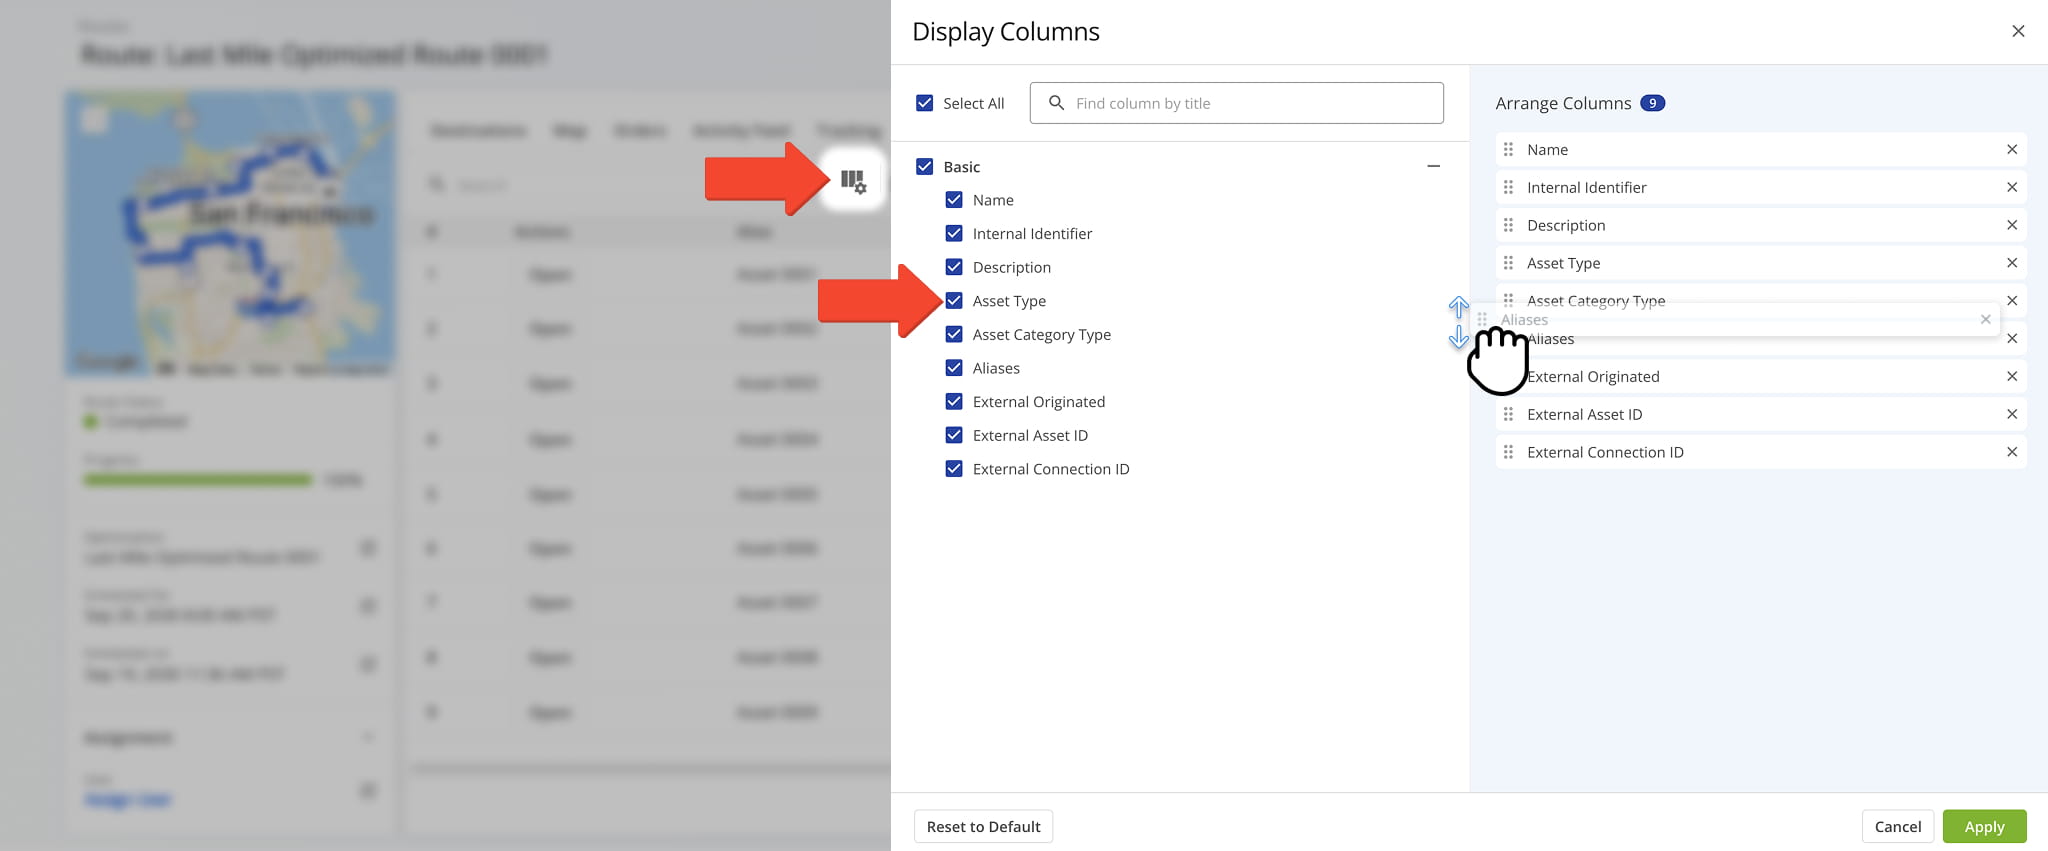
Customize the table by choosing which data columns to display and how they


Last Updated:

About author: Daniel Archer

Daniel ArcherWith a background in pedagogy and writing instruction, Daniel is a former tenured English Instructor who, after nearly 20 years of teaching, transitioned into content strategy and leading writing teams for global brands. Now, as Technical Documentation Manager at Route4Me, he translates complex logistics technology into clear, accessible content that empowers users.

Was this article helpful?
Still can't find what you're looking for? Contact us
Route4Me

About Route4Me

Route4Me has over 40,000 customers globally. Route4Me's Android and iPhone mobile apps have been downloaded over 2 million times since 2009. Extremely easy-to-use, Route4Me's apps create optimized routes, synchronize routes to mobile devices, enable communication with drivers and customers, offer turn-by-turn directions, delivery confirmation, and more. Behind the scenes, Route4Me's operational optimization platform combines high-performance algorithms with data science, machine learning, and big data to plan, optimize, and analyze routes of almost any size in real-time.