Route Metrics – Track Route Progress And Performance
The Route Metrics sidebar on the Routes Page provides quick insight into route progress and operational efficiency with planned vs. actual values for route duration, distance, asset utilization, and more. Enterprise teams can use this actionable intelligence to evaluate performance and identify trends across operations. This guide explains how to open, navigate, and customize the sidebar, review key metrics, and compare planned and actual values across multiple routes. Keep reading to learn more.

Table of Contents
Open The Route Metrics Panel On The Routes Page
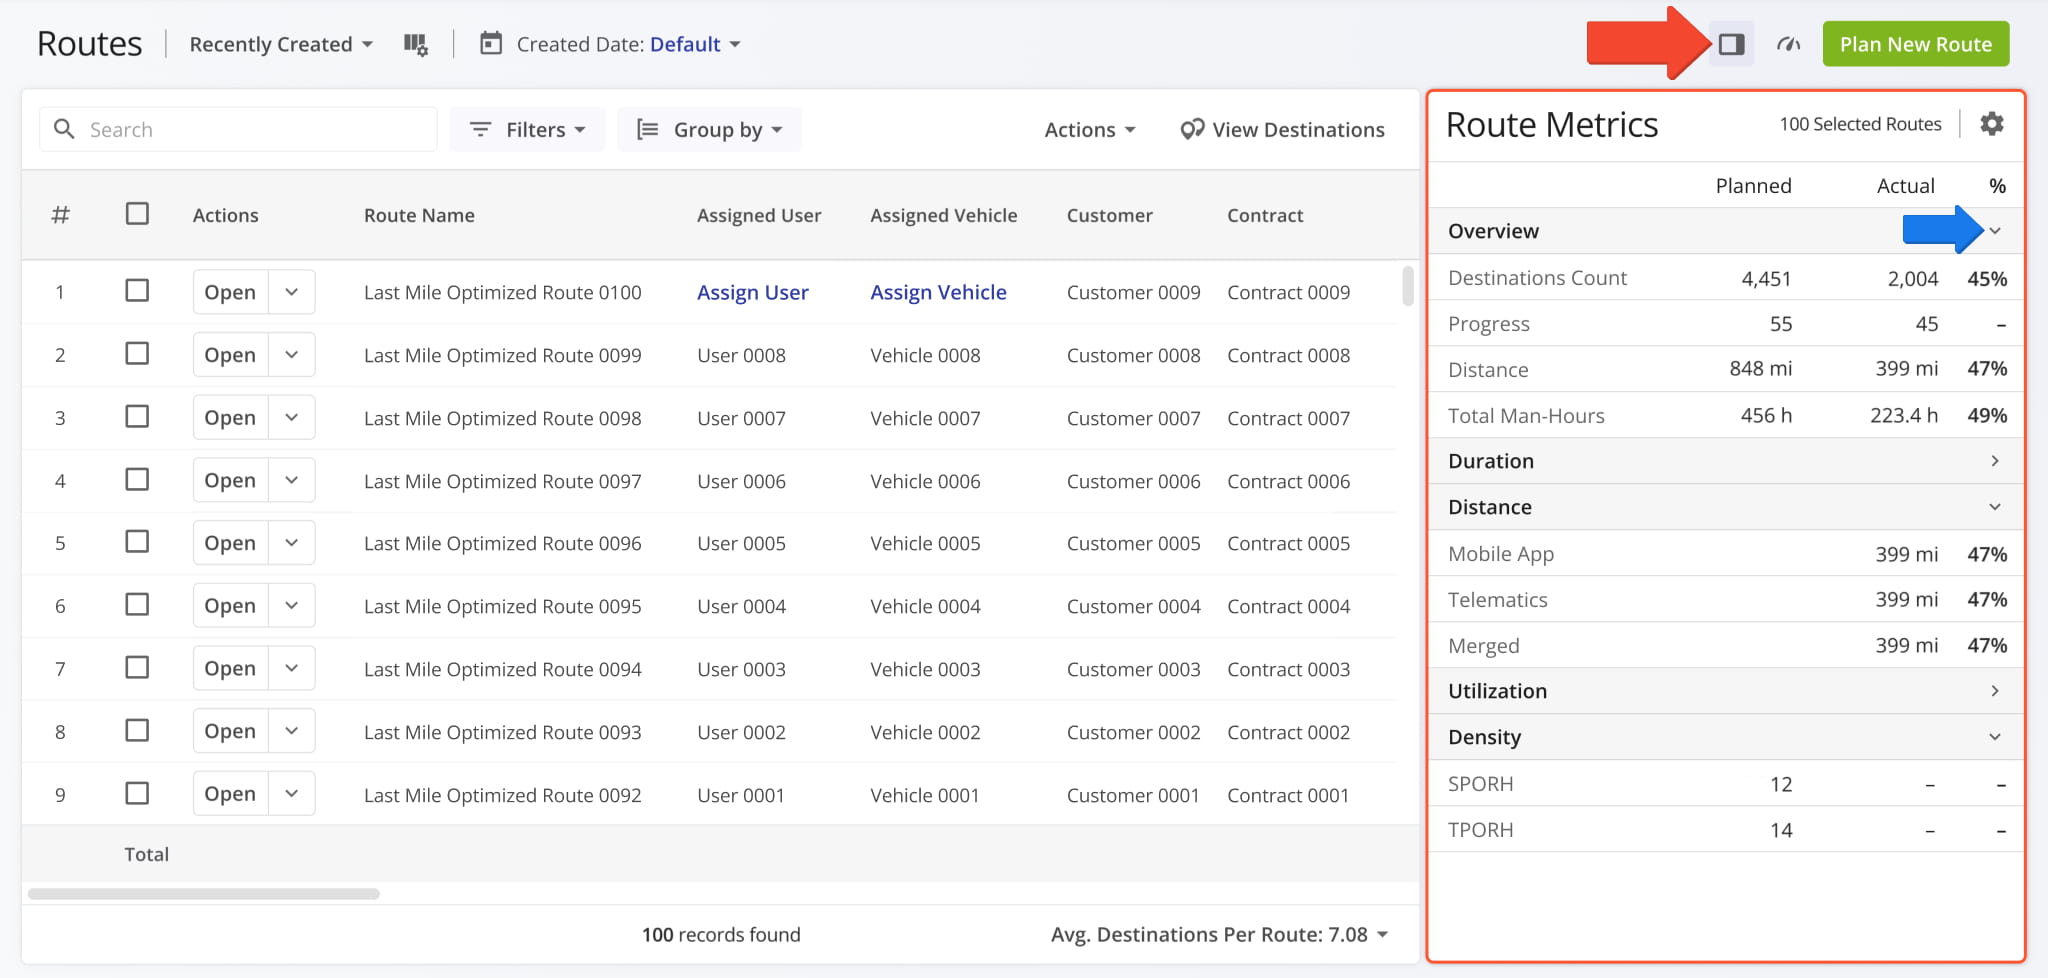
First, go to “Dynamic Routing” > “Routes” from the Navigation Menu to open your Routes Page. Then, click the Sidebar Button to open the Route Metrics interface. You can click the button again to close it.
The sidebar automatically shows planned and actual metrics for the currently visible routes, updating automatically when you adjust filters and view modes. You can collapse or expand data categories by clicking the Down Arrow in category headers.
Customize Route Metrics Data Fields And Categories
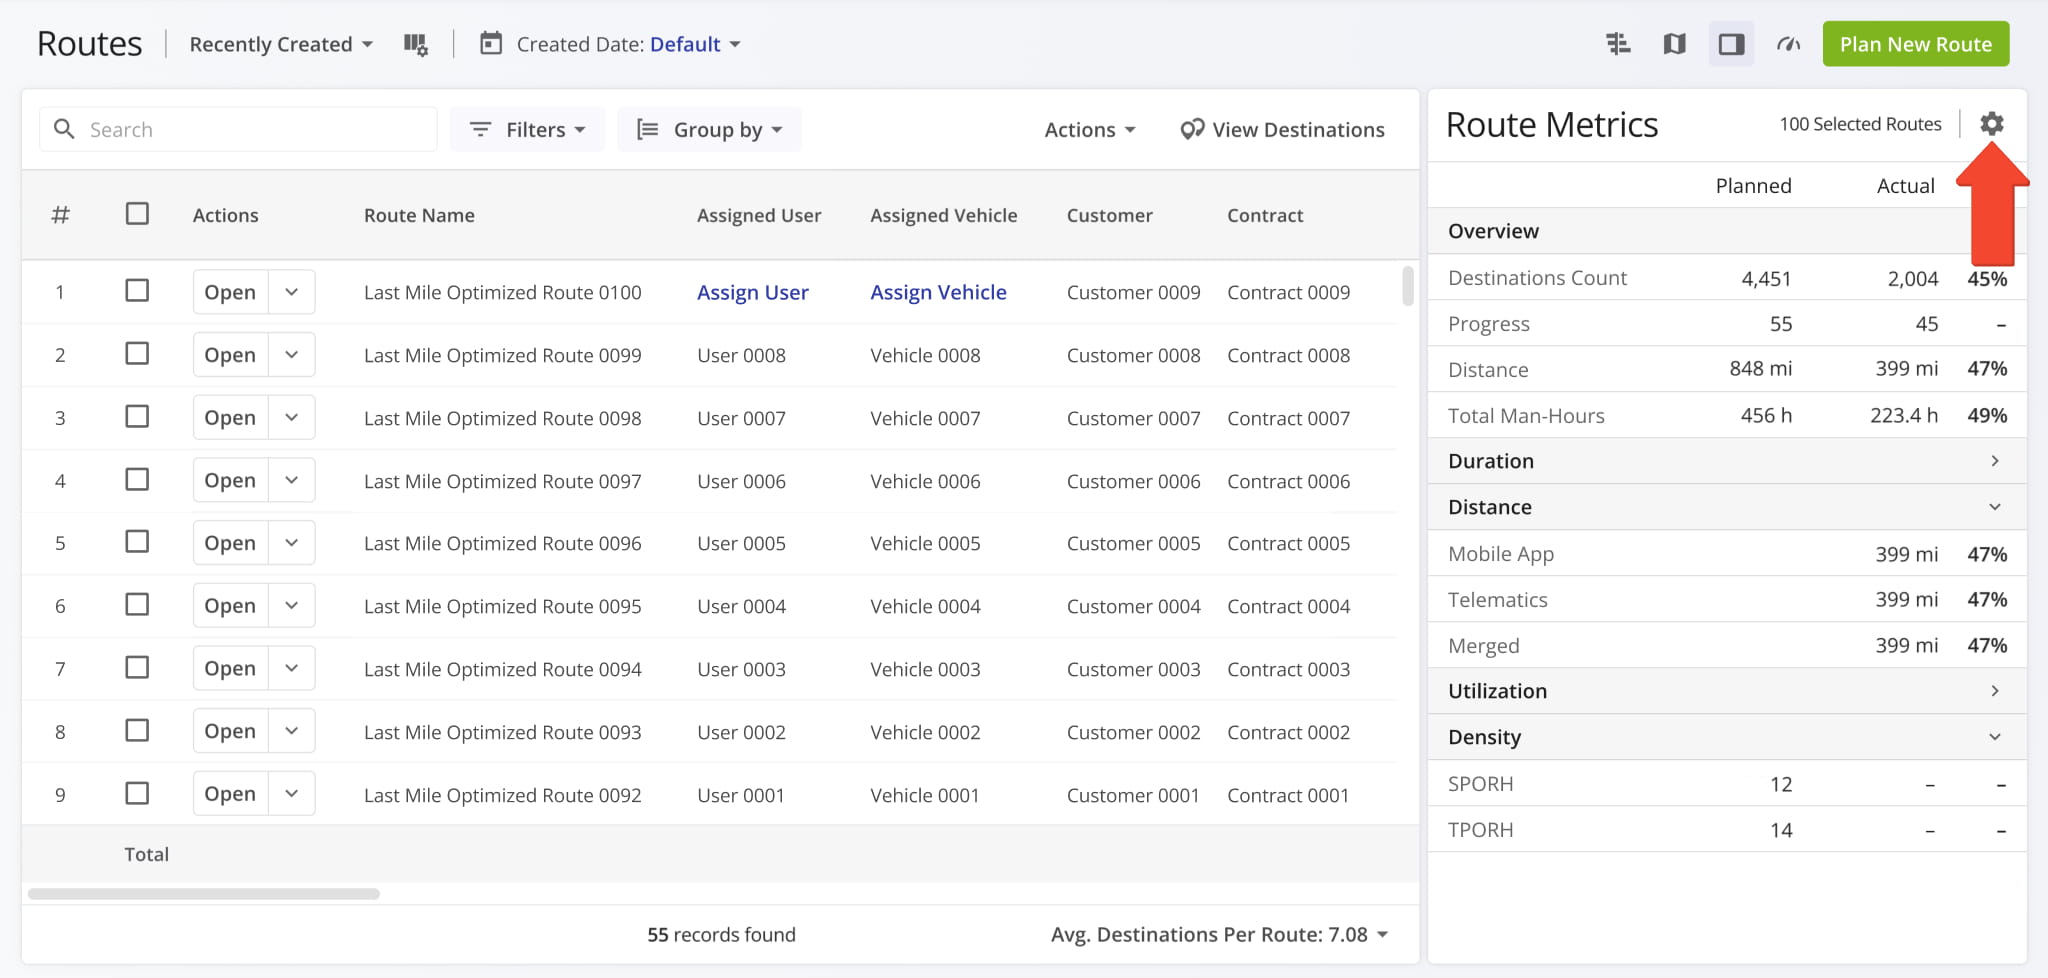
Just like other Route4Me tools, you can customize the data fields in the Route Metrics sidebar. To do so, simply click the Gear Icon.
NOTE: Data shown in Route Metrics is available for individual routes as Route Data Columns. The sidebar enables you to always see aggregate performance metrics without having to navigate the main data table or calculate values across multiple routes.
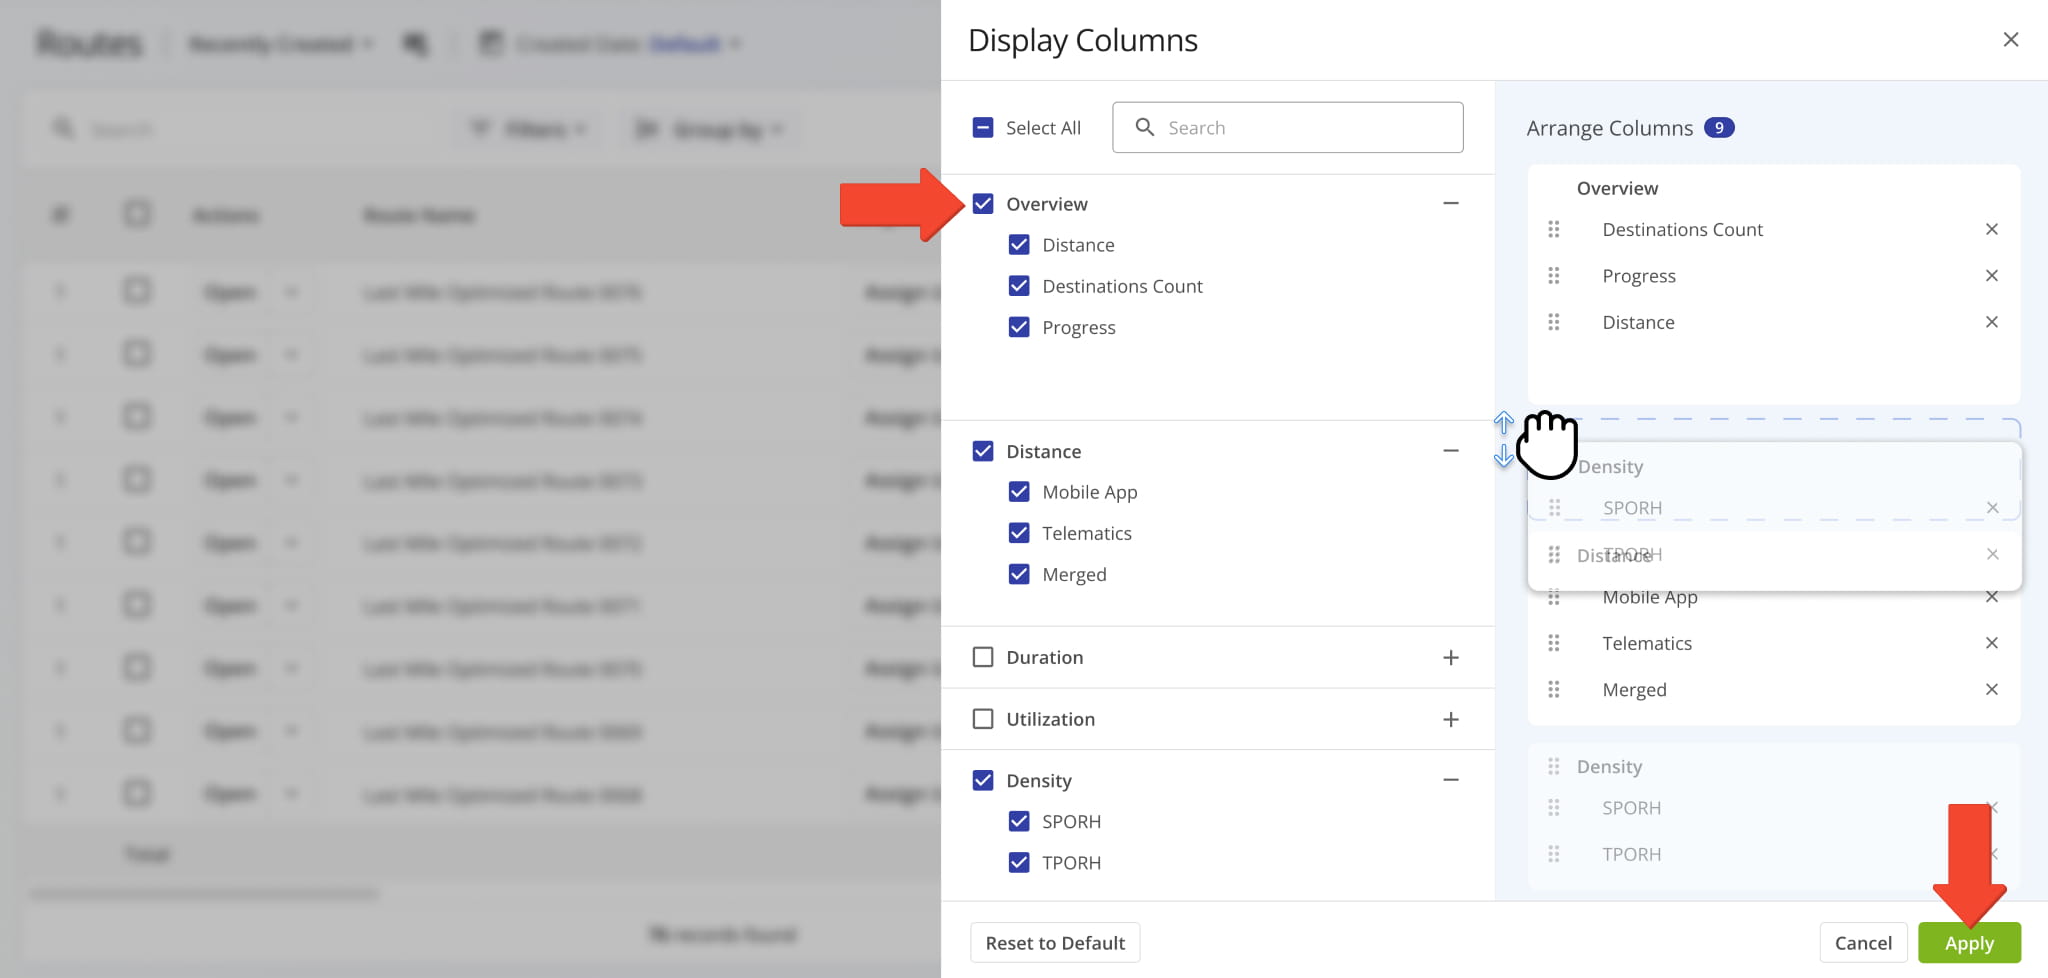
You’ll see the “Display Columns” panel where you can enable Route Metrics data fields by checking boxes. In the “Arrange Columns” section on the right, you can change the order of data fields by clicking and dragging. You can also arrange data categories in the same way; simply click and drag the category header.
The following section of this guide outlines the data fields available in your Route Metrics.
Route Metrics Supported Performance Data Fields
Route Metrics – Route Metrics Supported Performance Data Fields
Visit Route4Me's Marketplace to Check out Various Modules and Add-Ons:
- Route Optimization
Time Windows
- Operations
Advanced Team Management Add-On
About author: Kristian Andreev
Kristian is a Technical Writer at Route4Me. With over a decade of experience in writing and localization, he's an expert at communicating complex technical data in a clear, concise, and user-friendly way. Passionate about bridging the gap between engineers and users, he specializes in creating documentation to streamline onboarding, enhance product usability, and support global teams on the path to success.