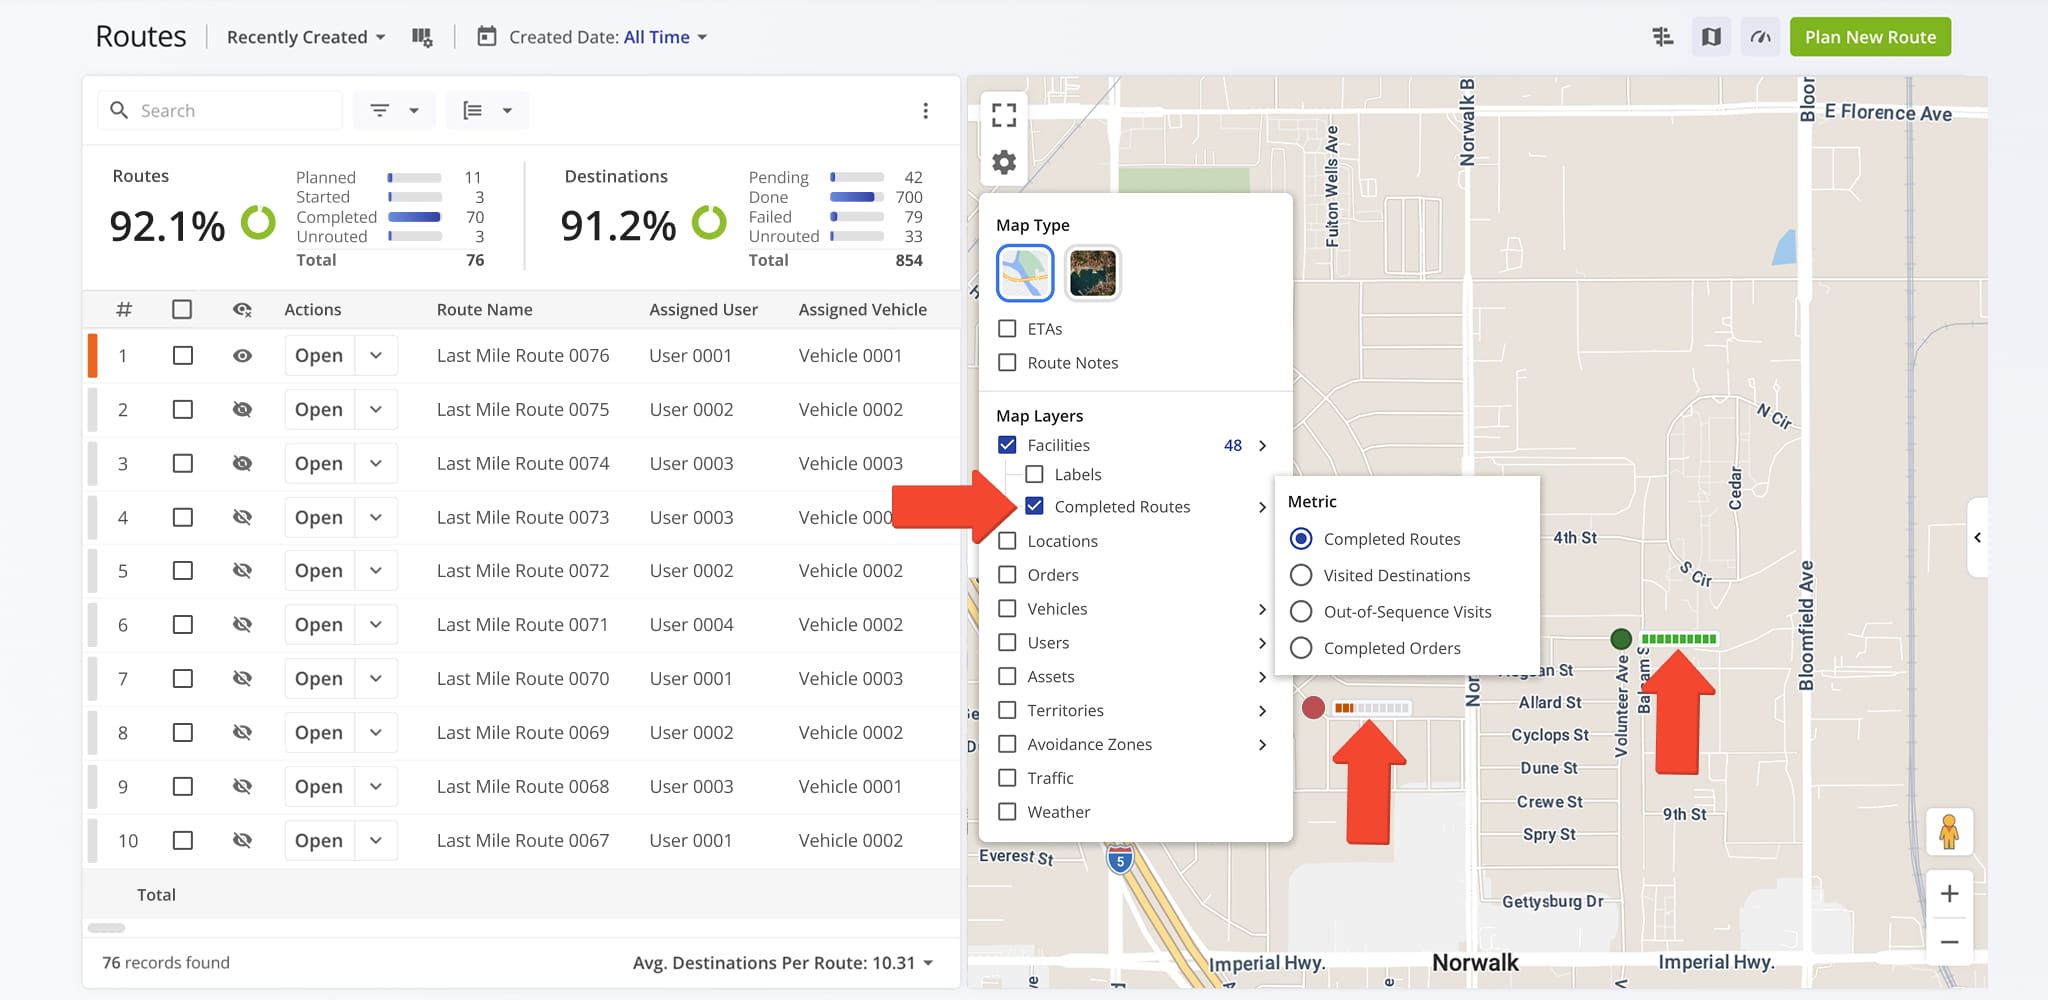
Routes Map Layers – View And Manage Operational Data On Dynamic Routes Map
For an enterprise business managing dozens or even hundreds of routes, the Routes Map is one of the most effective tools for last mile optimization. It gives dispatchers and route planners a visual way to monitor stops, drivers, and route progress in one place. With Map Layers, you can customize exactly what appears on the map, from destination markers and ETAs to vehicles, territories, and traffic. This guide explains each option so you can build the view that best fits how your team works.
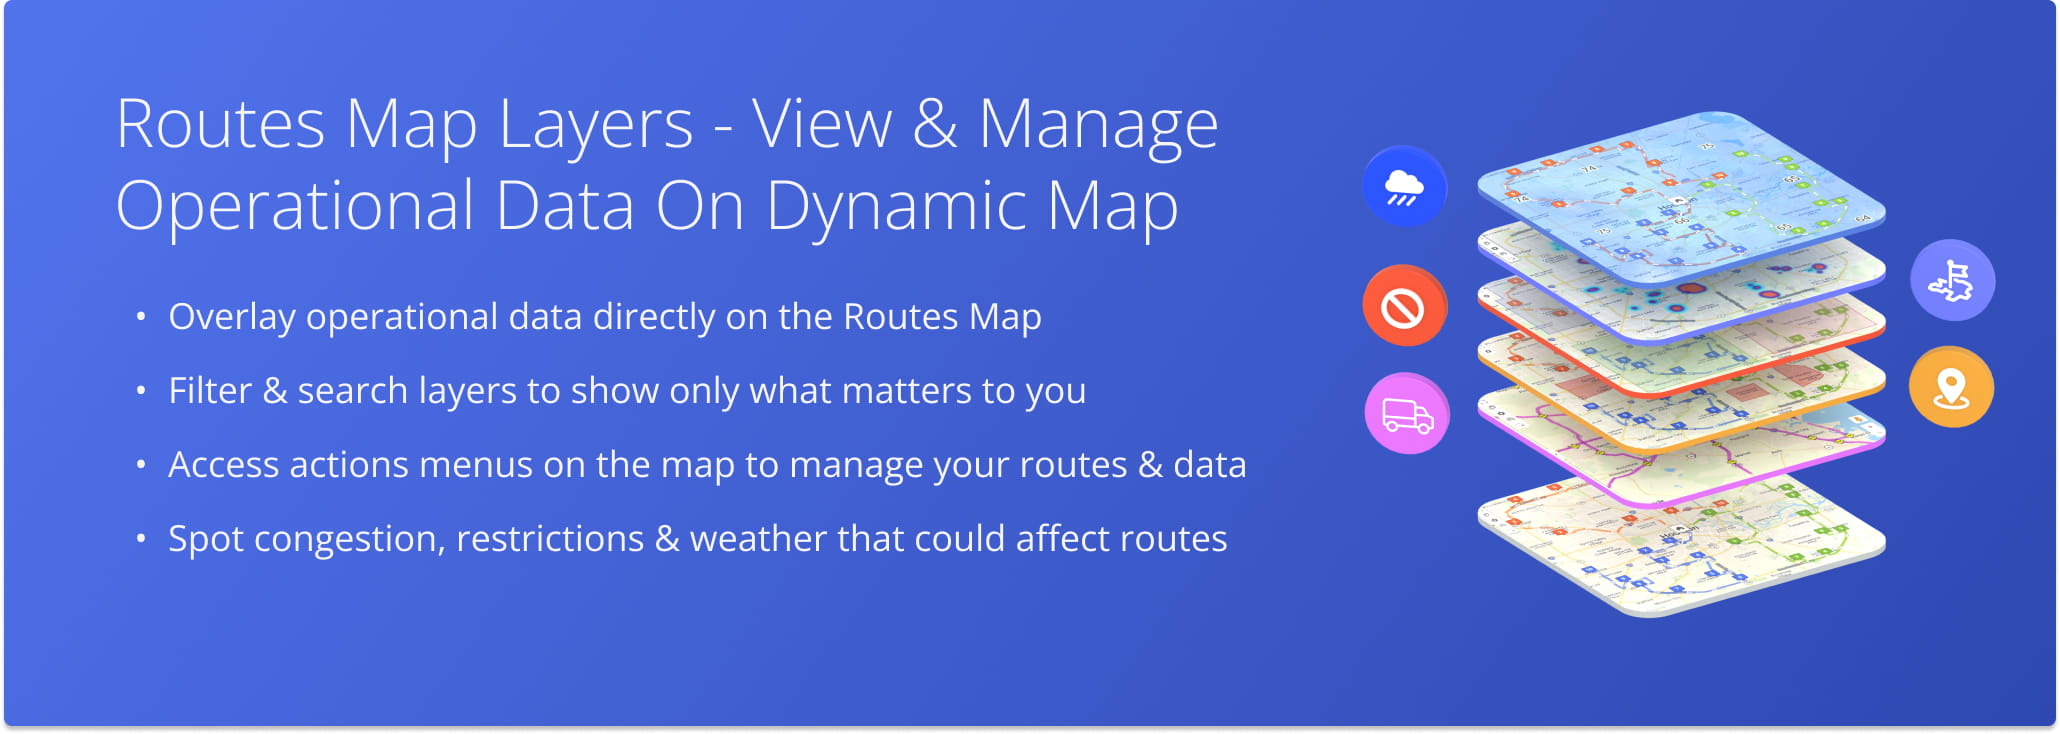
Table of Contents
Routes Map Overview – Customize Your View Of Route Activity
The Routes Map gives dispatchers and route planners a live visual of route activity, showing where stops are located, how routes connect, and how work is distributed across your team.
Because different teams look at the map for different reasons, you can customize what appears on it. Whether you’re checking route progress, spotting congestion, or comparing coverage areas, you can show only the information you need.
NOTE: Learn more about using the Routes Map.
Map Layers – Overlay Locations, Vehicles, Facilities, And More
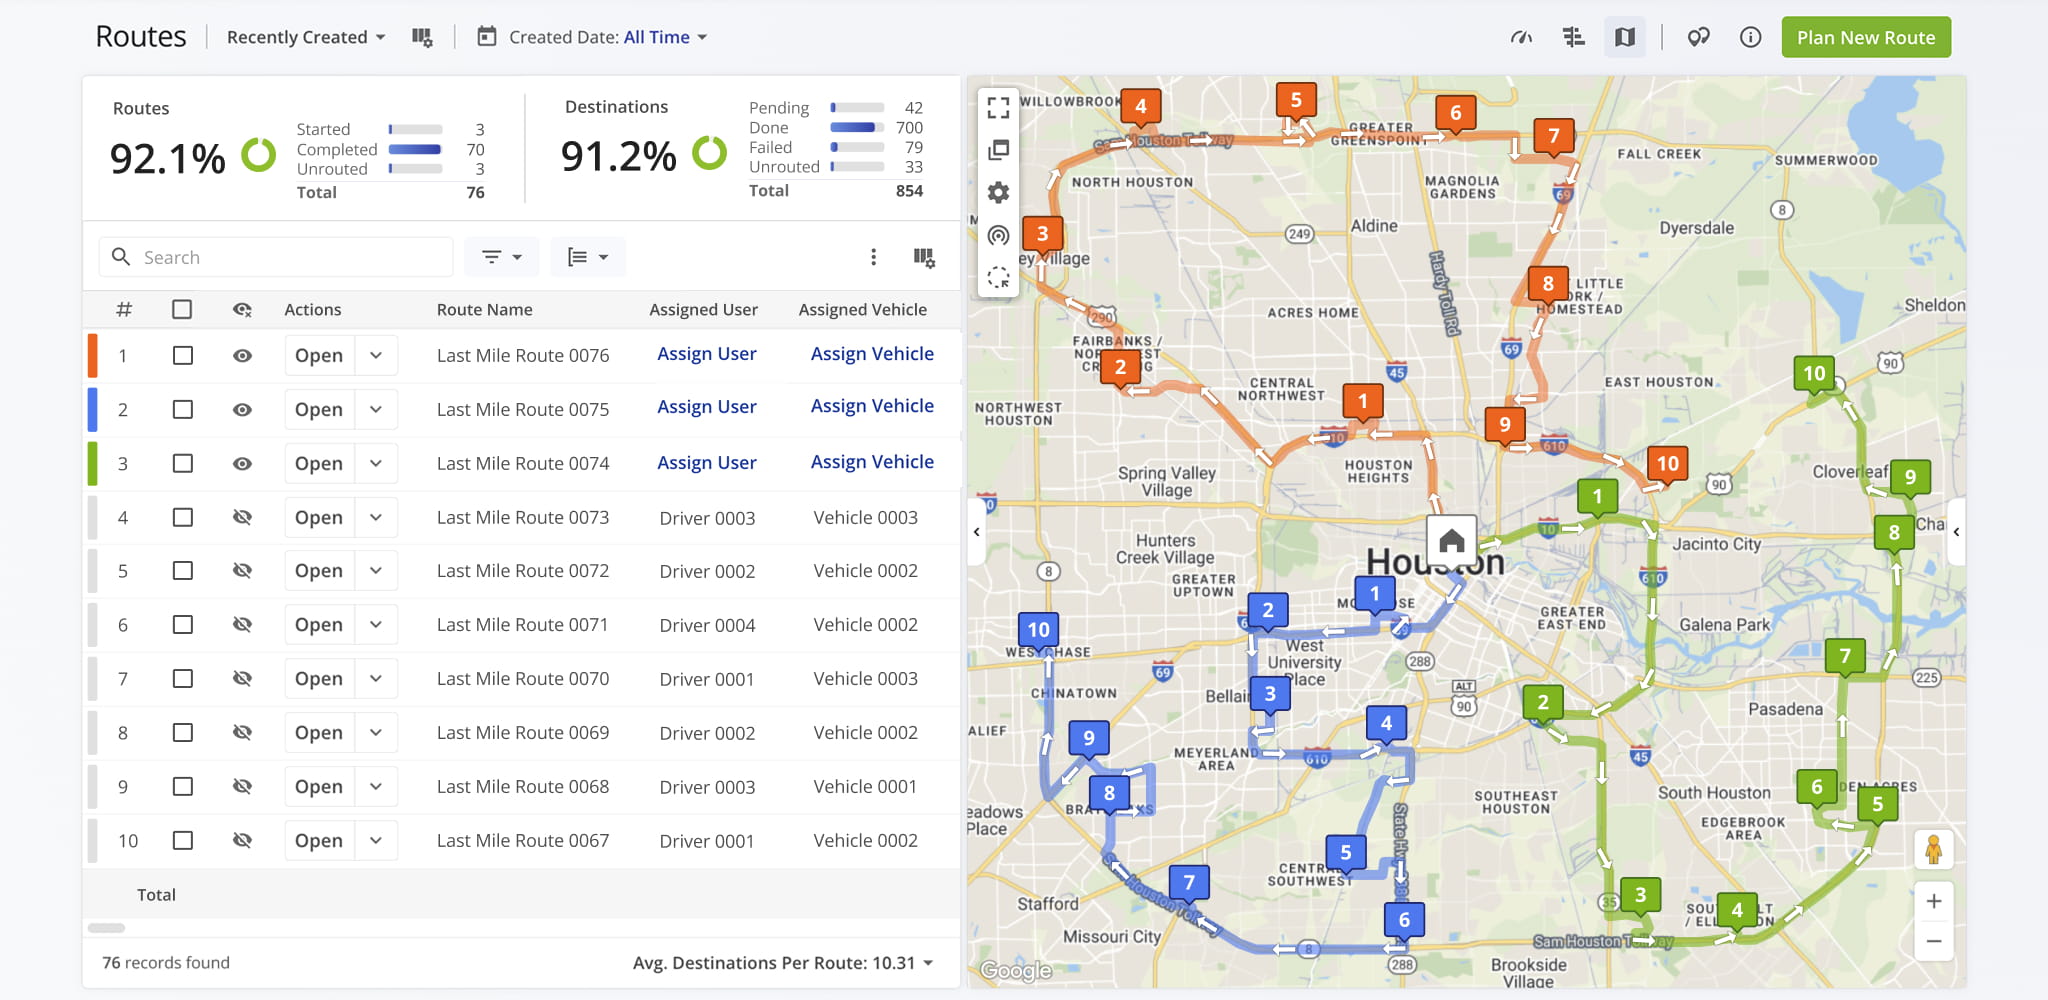
Map Layers, accessed via the Gear Icon, overlay contextual and operational data on the map, including locations, orders, vehicles, and other critical elements. You can select one or multiple layers depending on your needs.
Facilities Layer – Route Depot Information And Coordinates
The Facilities layer shows depot locations as map markers, each with a name label that you can show or hide using the “Labels” checkbox. You can also display a performance metric next to each facility, as detailed in the table below.
To choose which facilities appear, click “Facilities” to open the facility list, then select, deselect, or search for specific facilities. You can also filter by “Facility Type” or “Status” (Active or Archived).
Hover over any Facility Icon to view its details. Use the three-dot menu in the pop-up to insert the facility into a route.
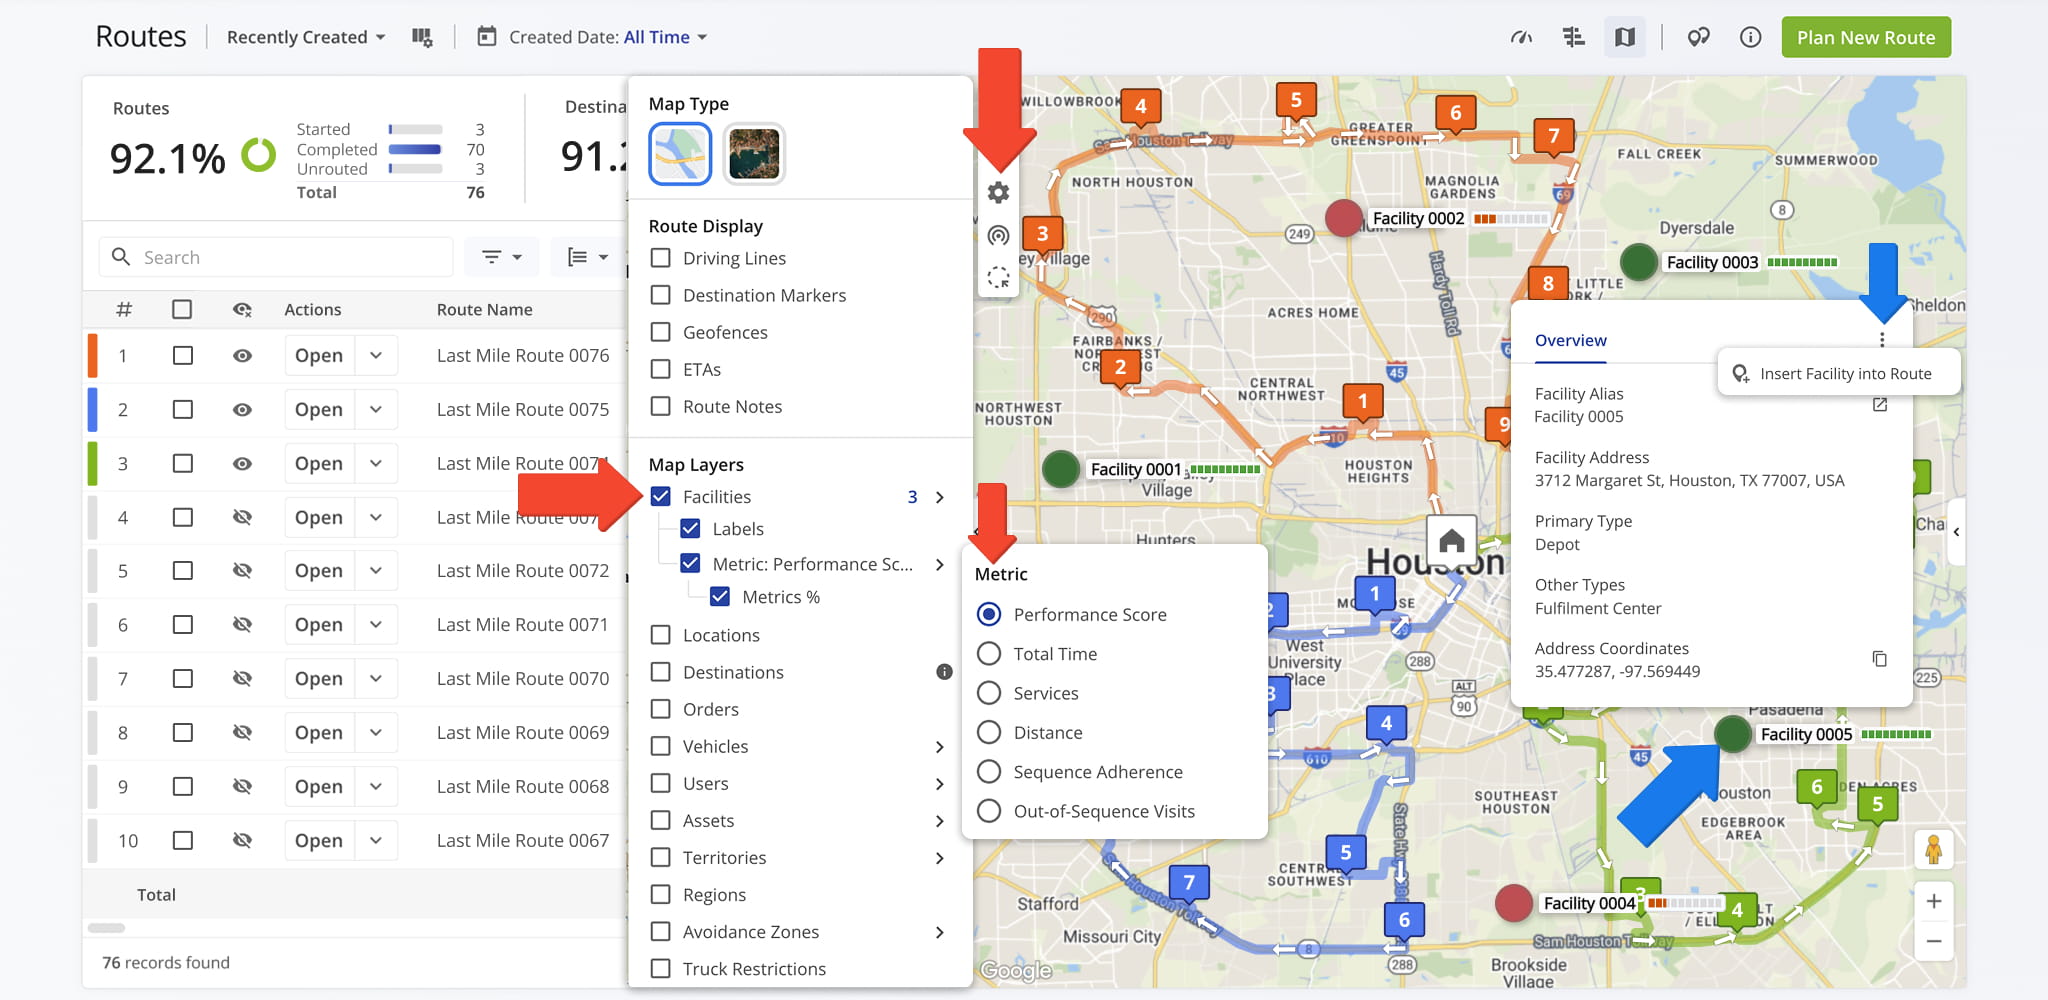
Facility Map Metrics
Locations Layer – Clustering And Heat Maps
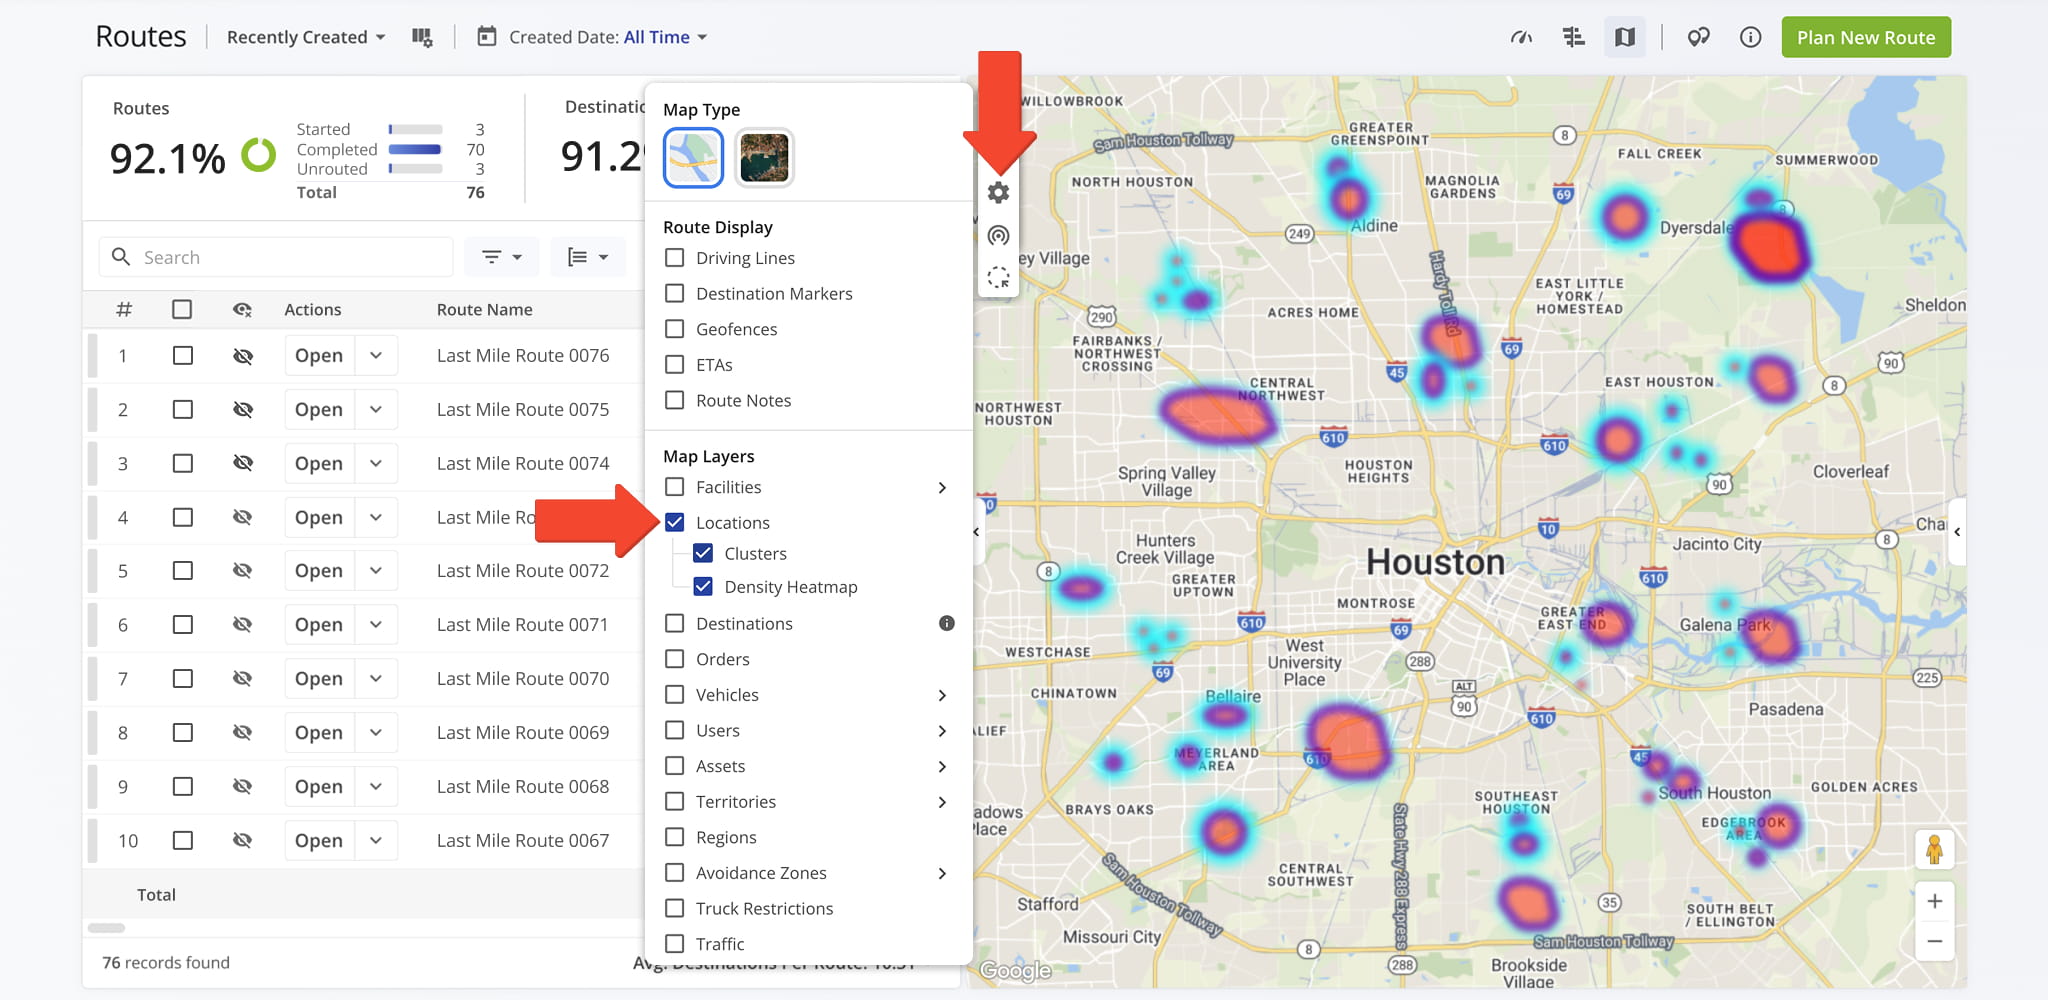
The Locations layer lets you view location clusters, a density heat map, or both to see where routes are concentrated. Clustering activates automatically for large datasets, with the heat map highlighting high-density areas to help you identify patterns.
Destinations Layer – View Destination Markers And Clusters
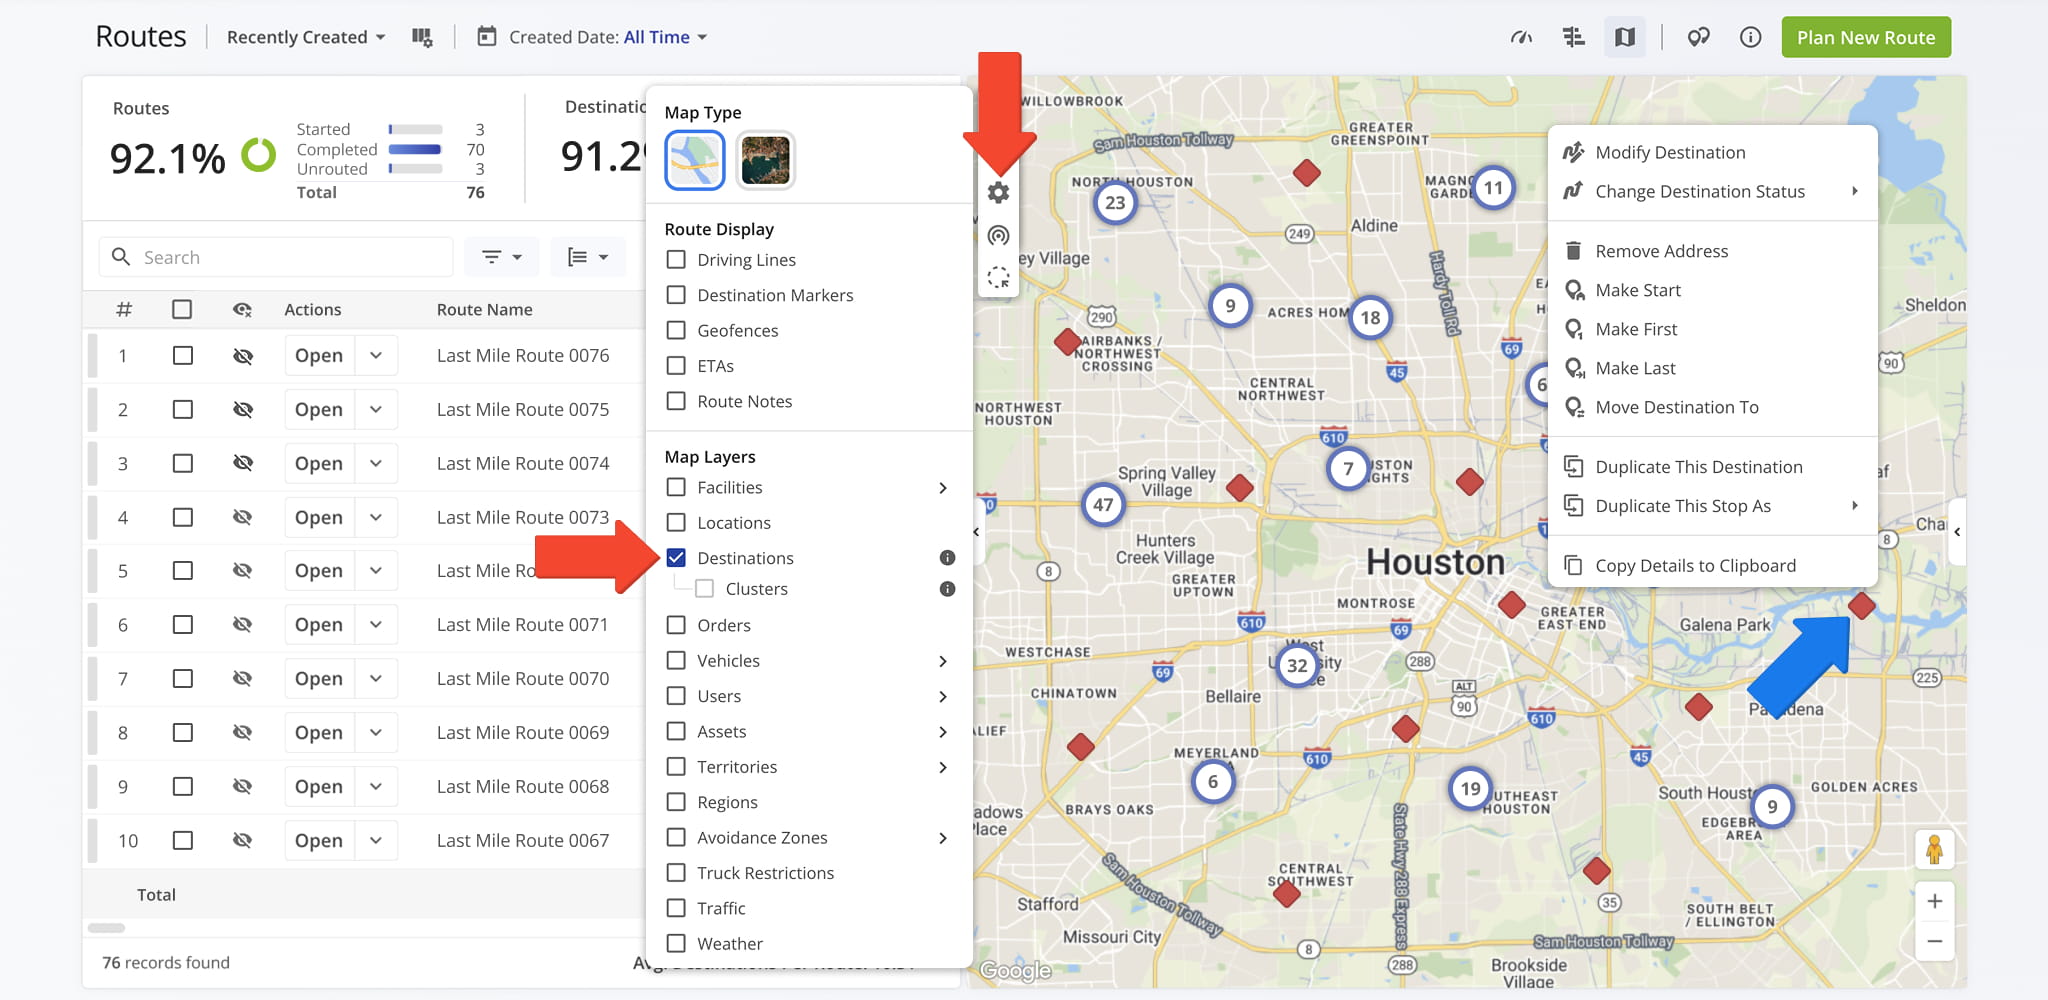
The Destinations layer displays individual destinations as markers on the map, helping you see where stops are located.
Enable “Clusters” to group nearby destinations into numbered clusters showing how many stops each contains, making large datasets easier to review. Click on an individual destination to access an actions menu, detailed in the table below.
Destination Actions Menu
Orders Layer – Visualize Distribution Across Routes
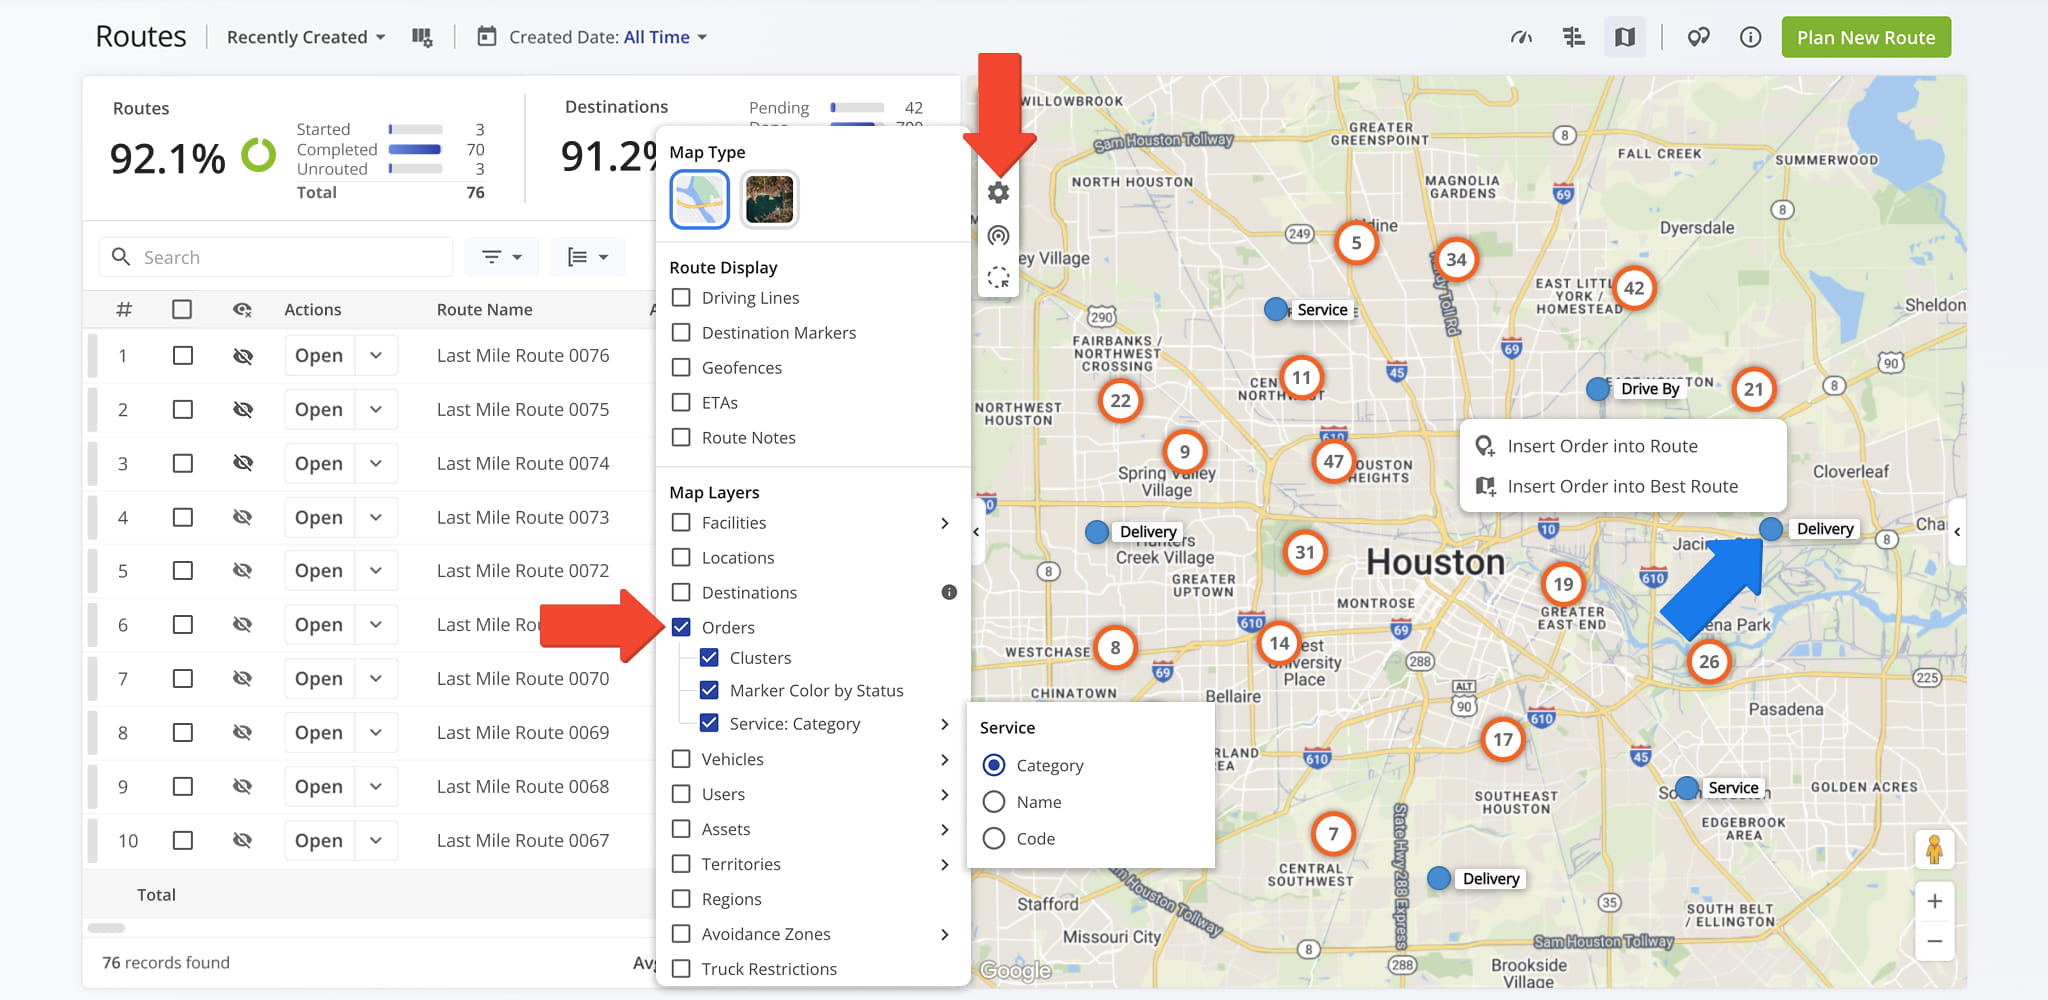
The Orders layer displays individual order locations or clusters of orders to visualize distribution across routes and destinations.
Enable “Clusters” to group nearby orders, “Marker Color by Status” to distinguish order statuses, and “Service” to label each order by Category, Name, or Code. You can also right-click any order to insert it into a specific route or into the best route.
Vehicles Layer – Track Vehicles On The Route Map
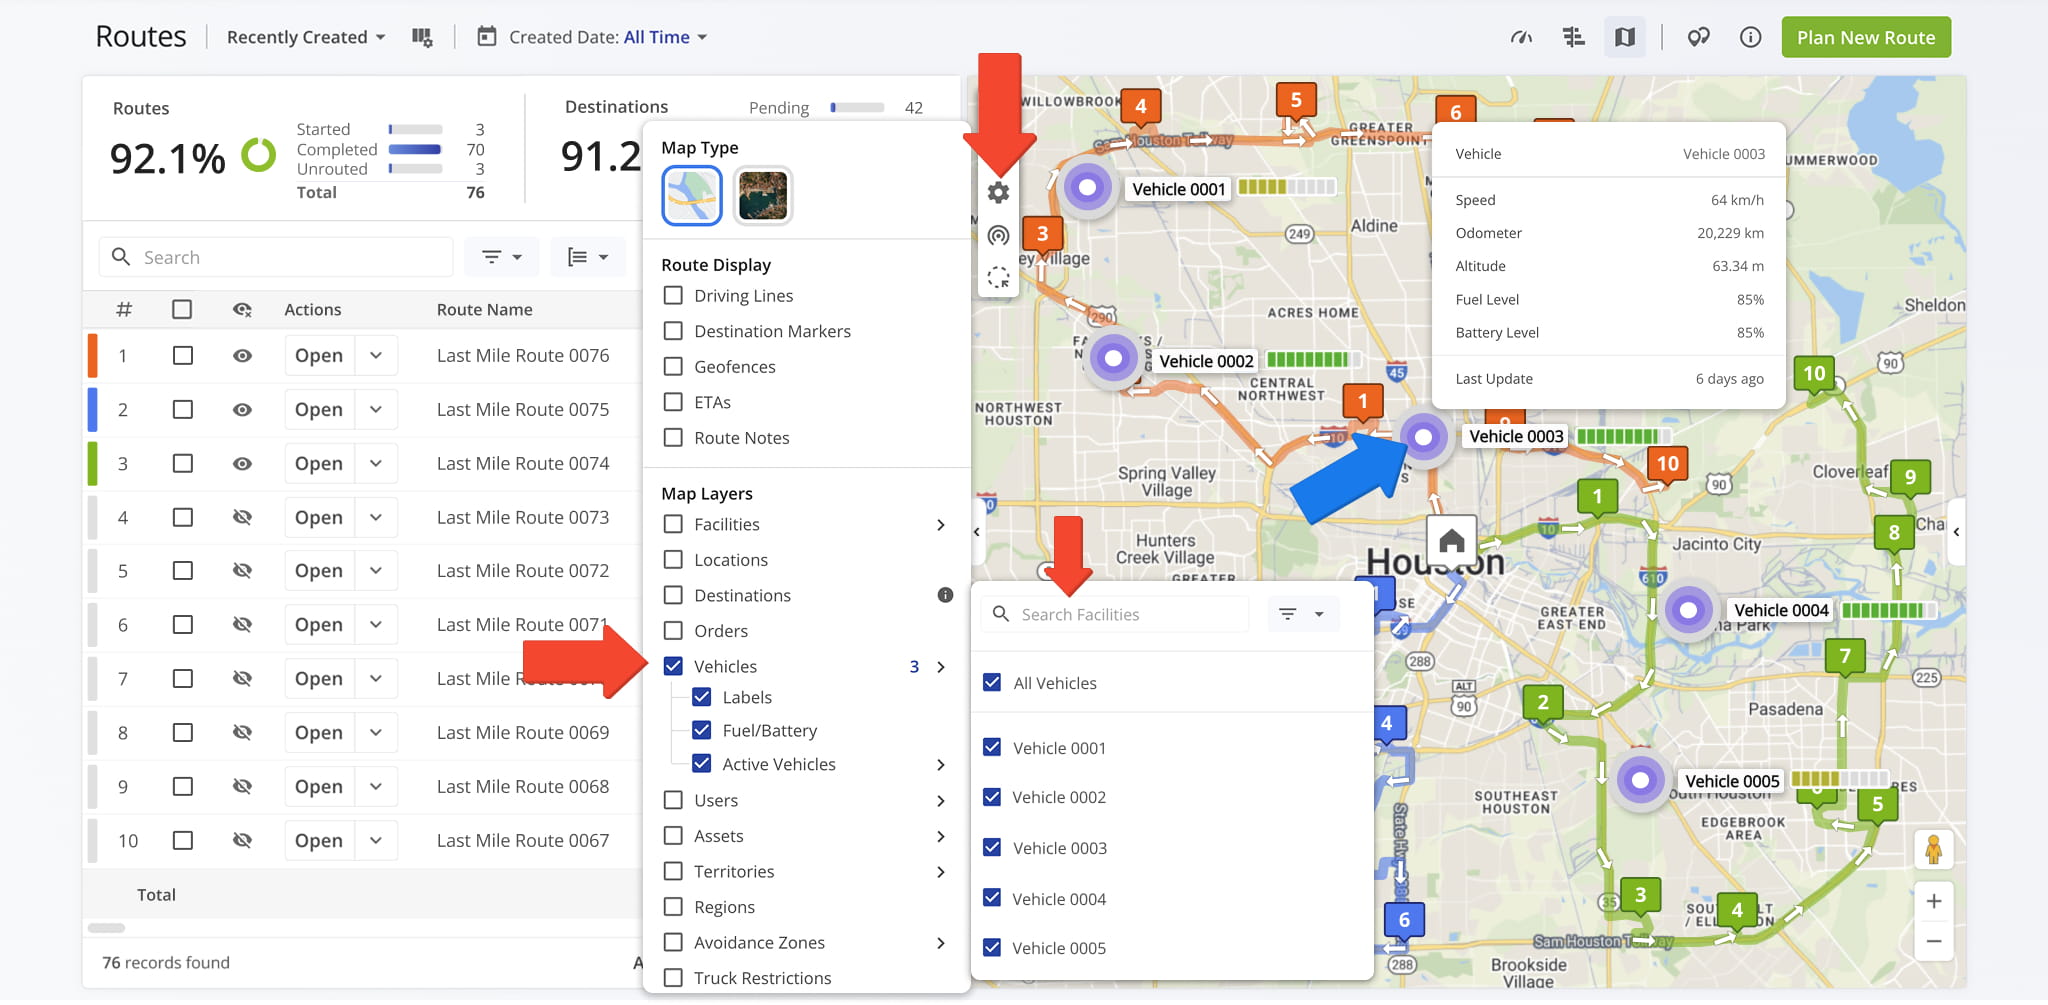
The Vehicles layer helps you track vehicles directly on the route map.
To choose which vehicles appear, click “Vehicles” to open the vehicle list, then use the “Search Vehicles” field or the checkboxes to show or hide specific vehicles. You can also select “Active Vehicles” to filter by last update time.
Enable “Labels” to display each vehicle’s Alias, and “Fuel / Battery” to show a progress bar with its current fuel and battery levels. Hover over any Vehicle Icon to view its key details.
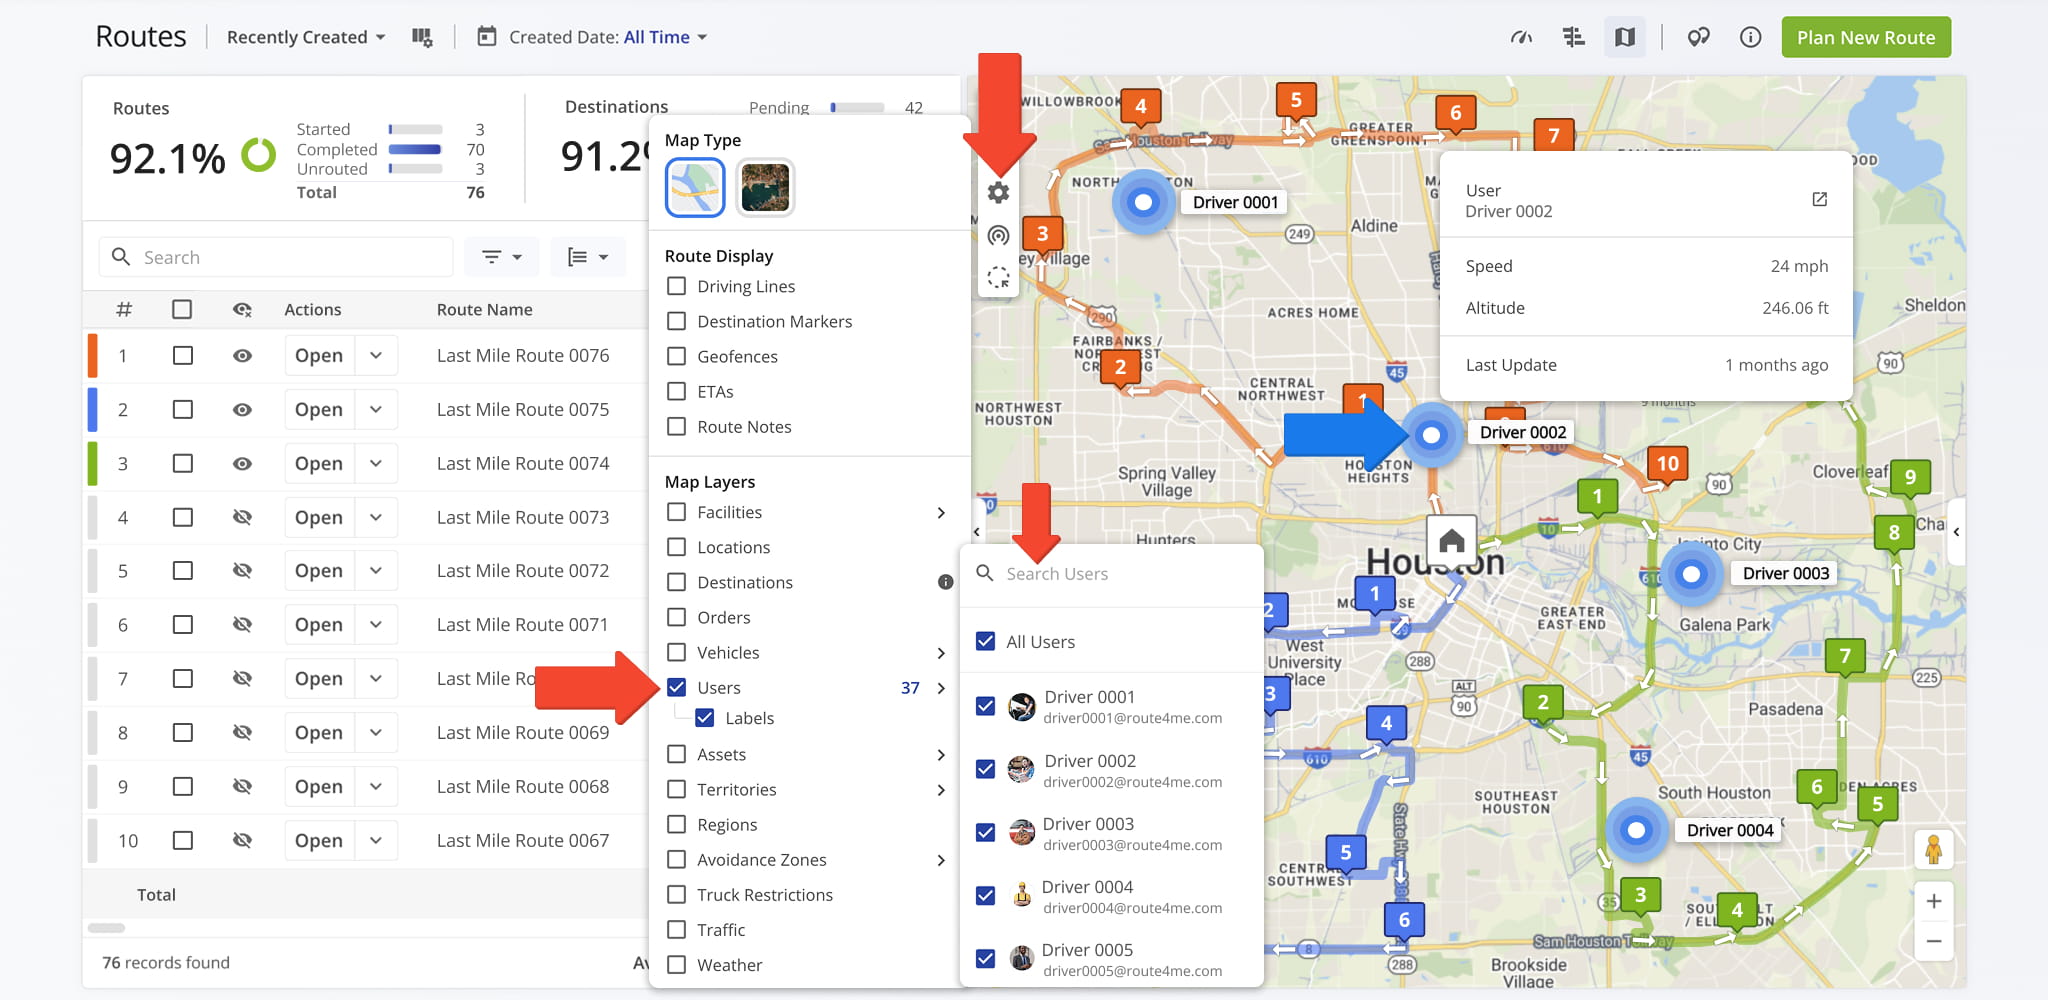
Users Layer – Monitor Assigned Team Members
The Users layer displays assigned Field Team members and Drivers on the map, improving visibility into workforce allocation and route assignments. Enable “Labels” to display each User’s name next to their marker.
To choose which Users appear, click “Users” to open the user list, then use the “Search Users” field or the checkboxes to show or hide specific team members. Hover over any User Icon to view their key details.
Assets Layer – View And Filter Asset Locations
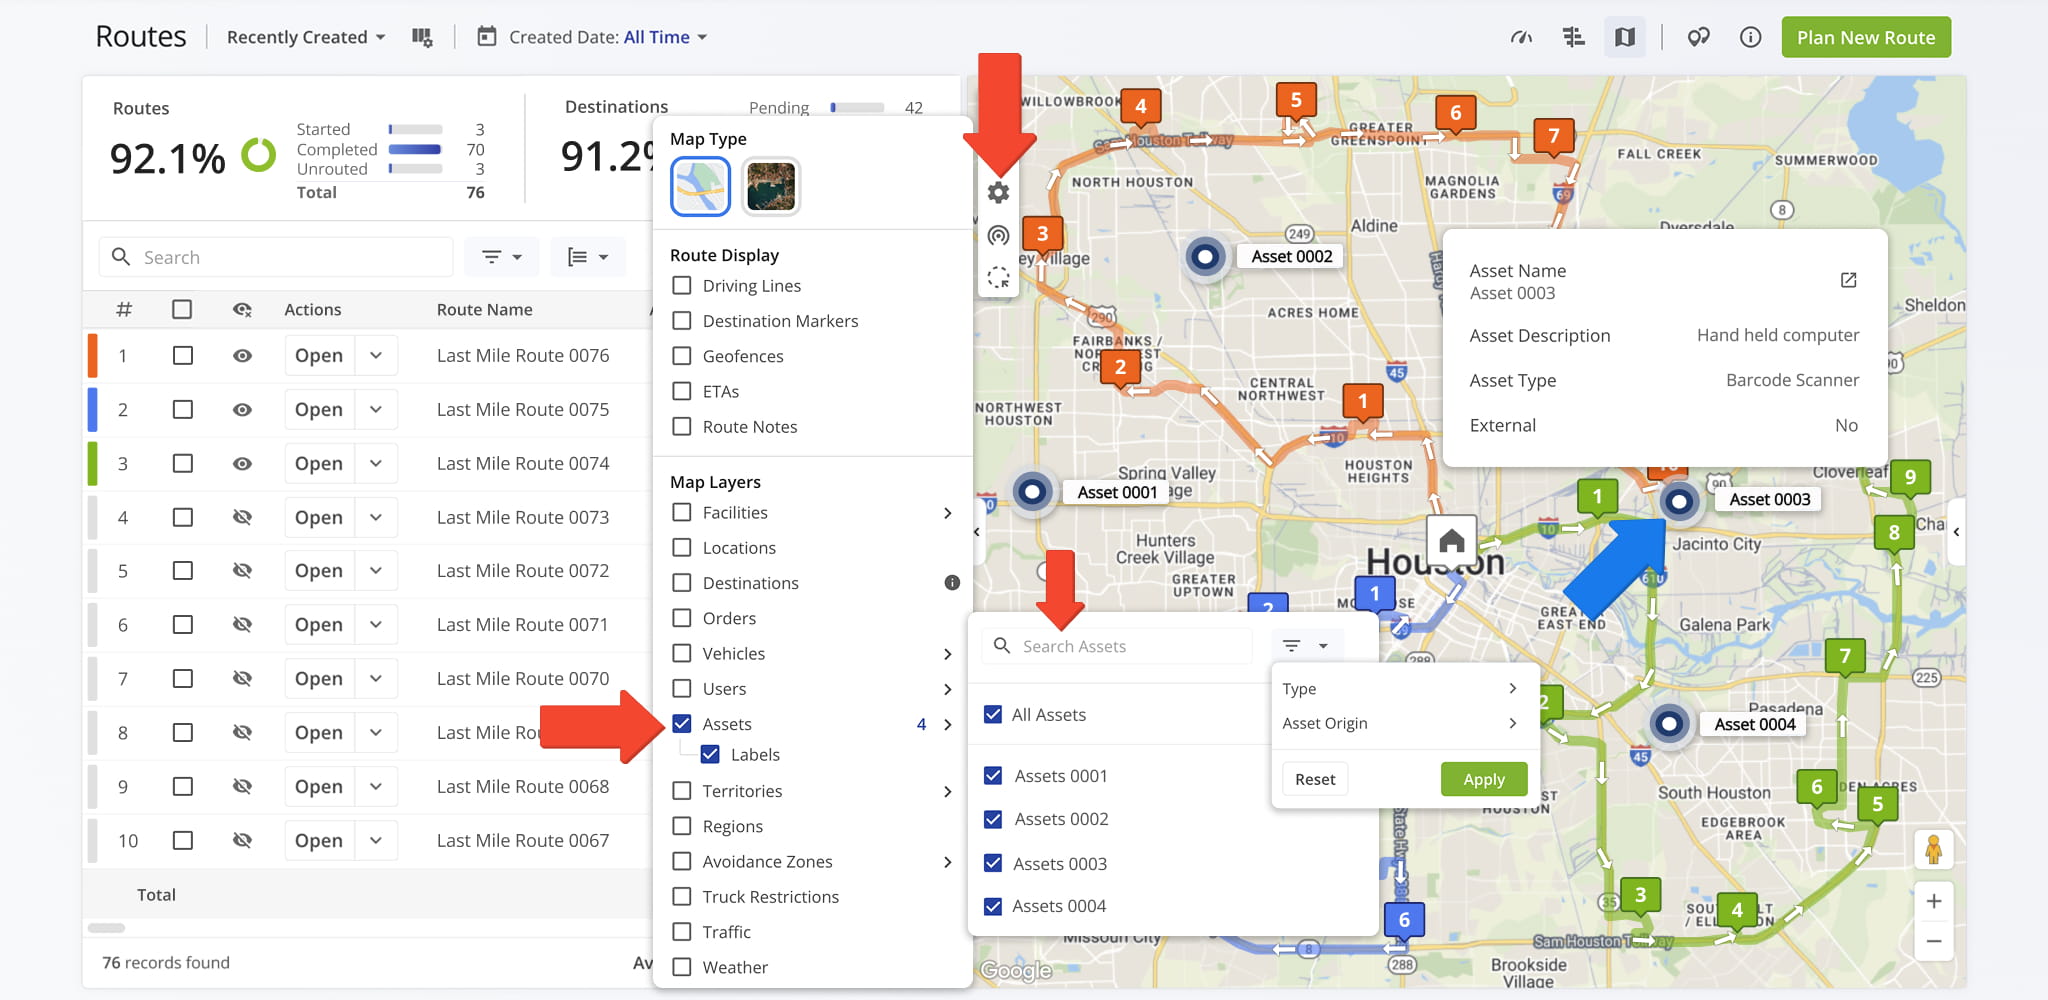
The Assets layer displays Asset icons on the map, showing you where your Assets are located. Enable “Labels” to display each Asset’s name next to its icon. Hover over any Asset Icon to view its key details.
To choose which Assets appear, click “Assets” to open the asset list, then use the “Search Assets” field or the checkboxes to show or hide specific Assets. You can also use the Filter menu to narrow visible Assets by “Type” or by “Asset Origin“.
Territories Layer – Display And Manage Route Coverage Areas
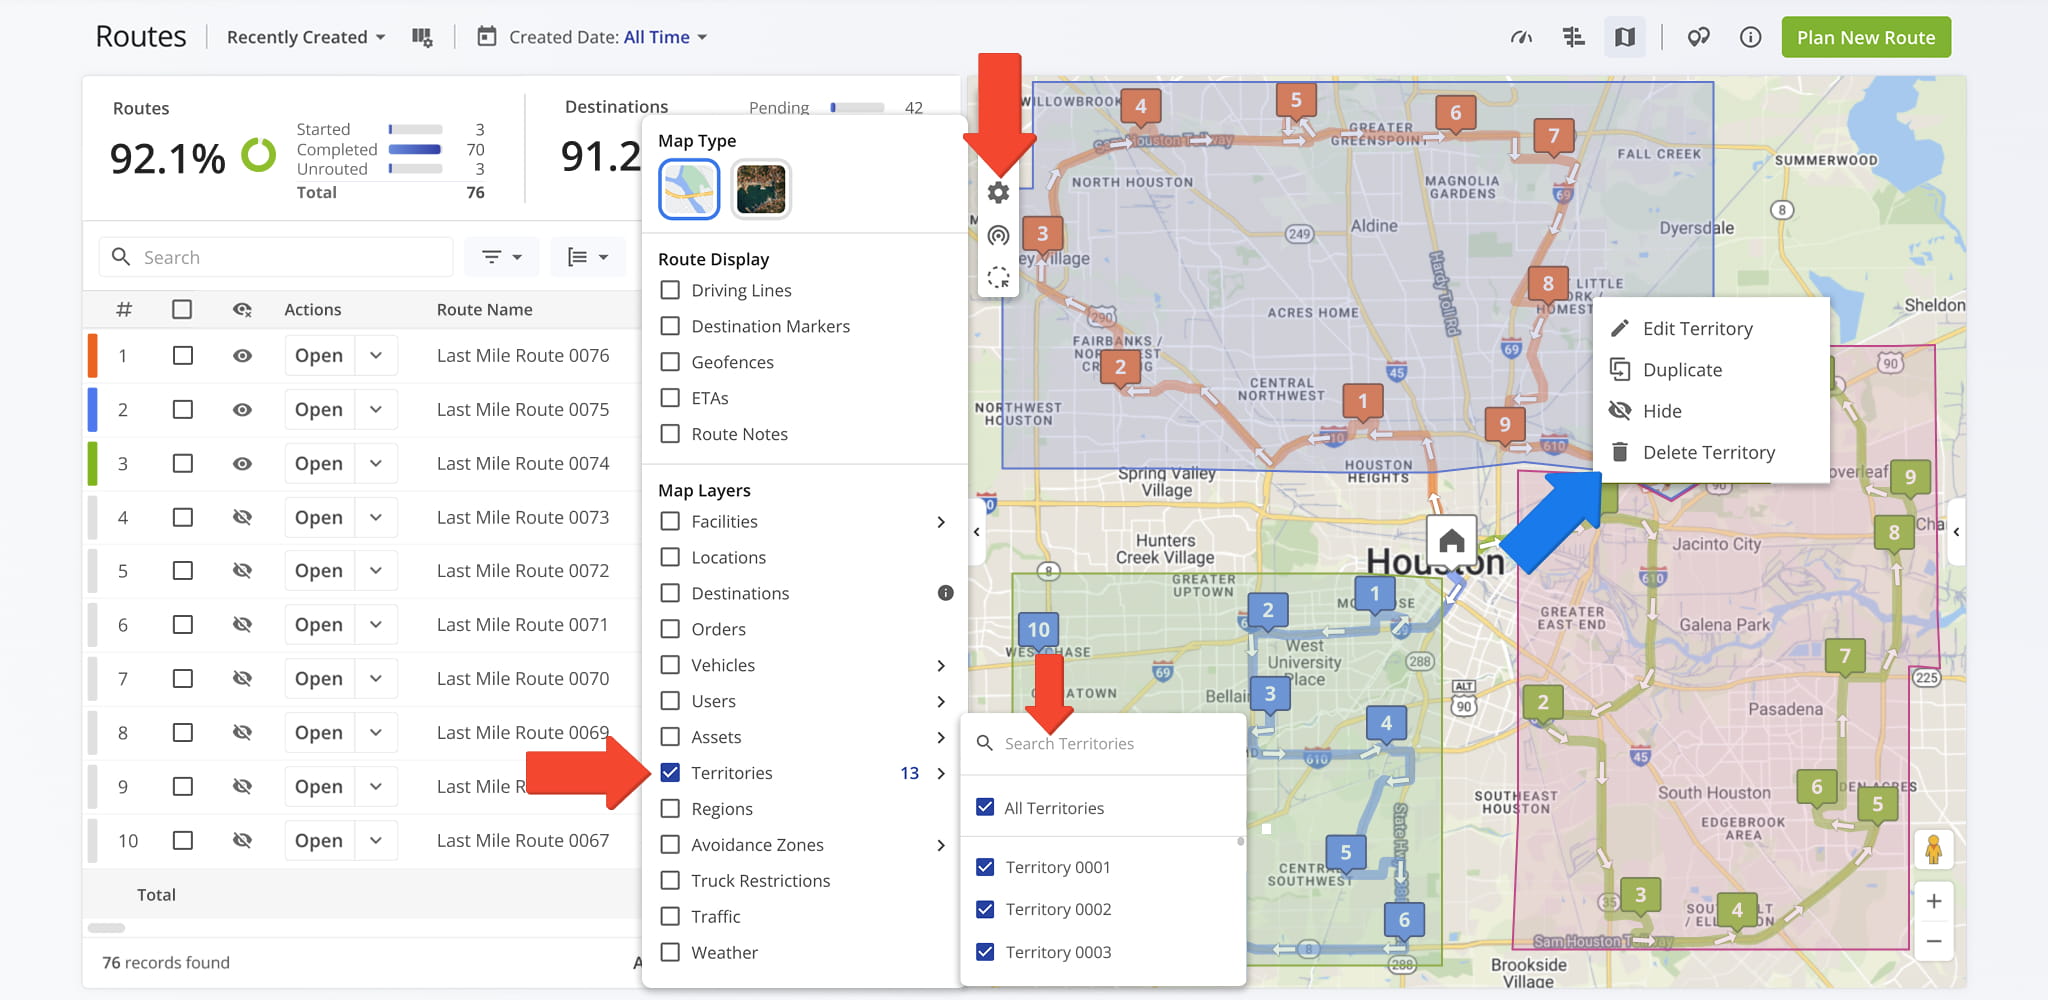
The Territories layer shows all configured territories on the map, helping you ensure that route planning aligns with assigned coverage areas.
To choose which territories appear, click “Territories” to open the territory list, then use the “Search Territories” field or the checkboxes to show or hide specific territories.
Right-click any territory on the map to open an actions menu with options for managing it, as detailed in the table below.
Territory Actions Menu
Regions Layer – View Regional Boundaries And Performance
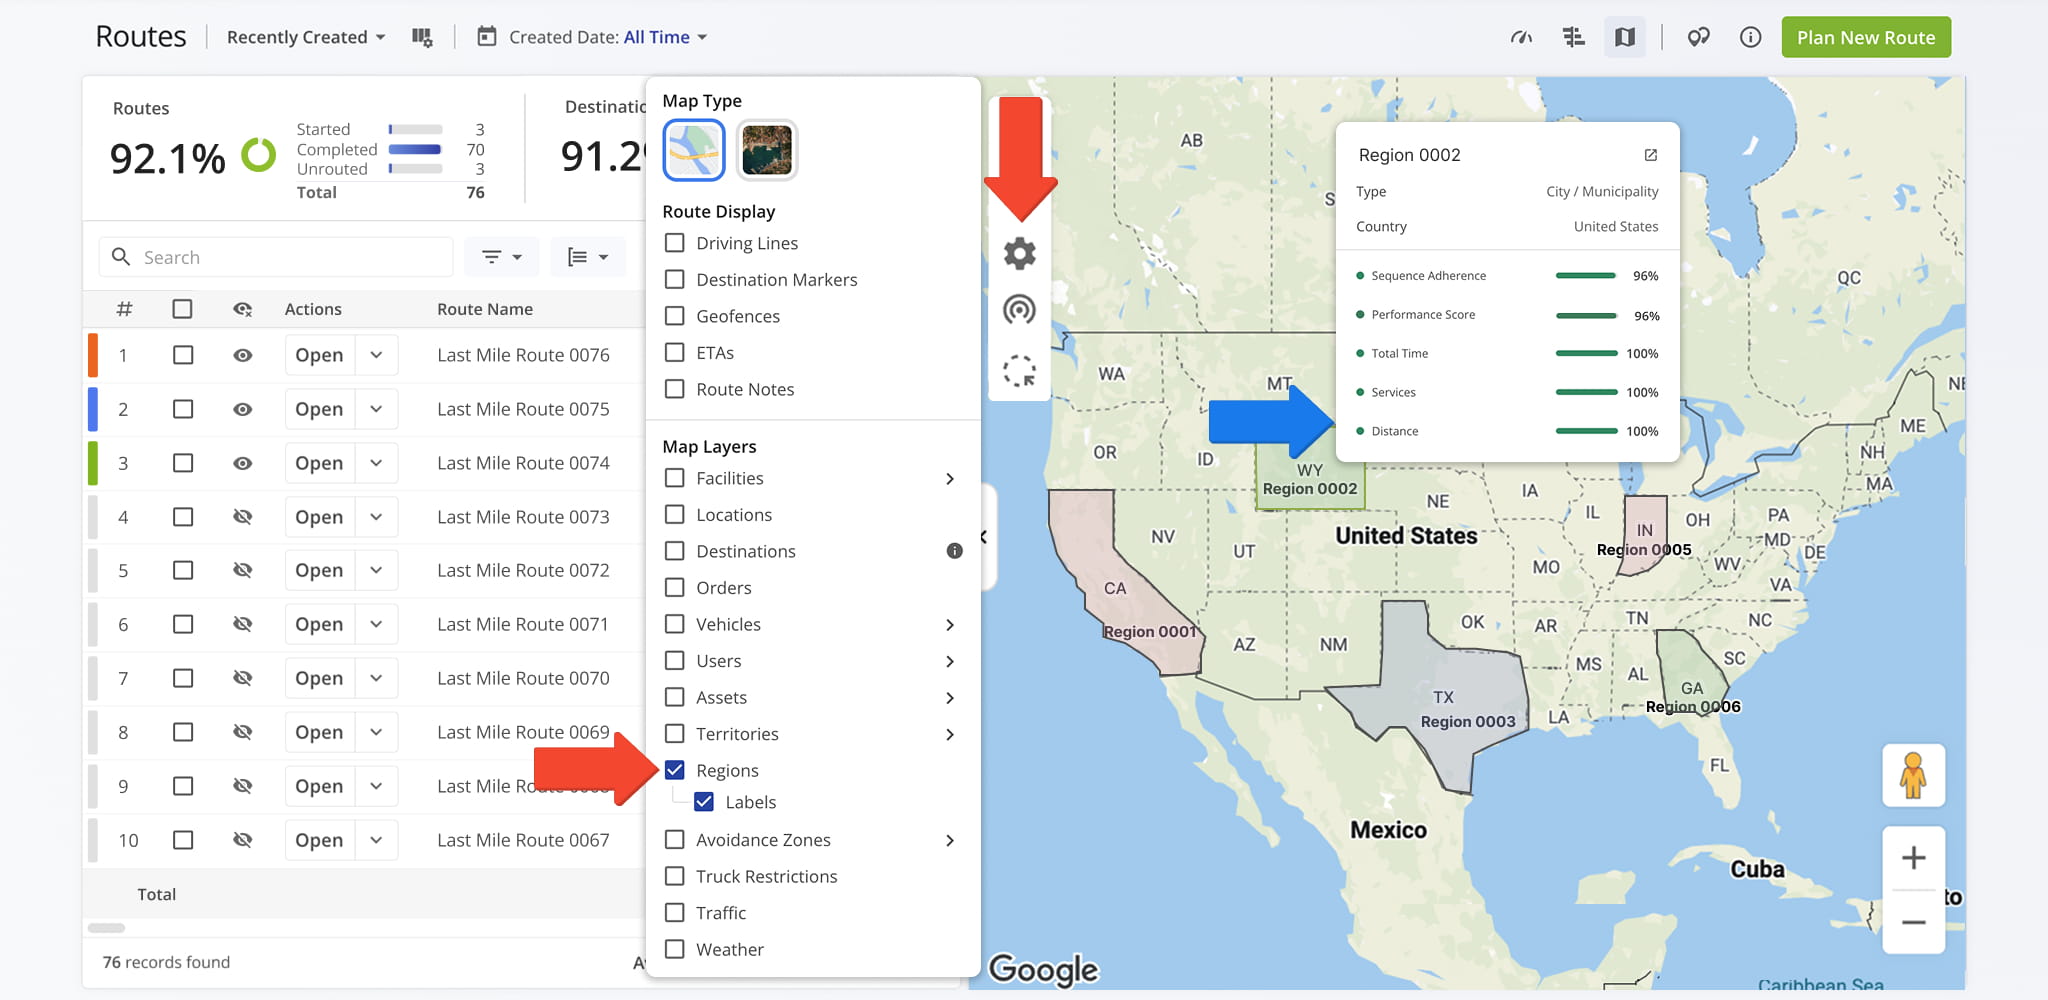
The Regions layer displays configured regions as shaded areas on the map, helping you see geographic boundaries and compare how routes perform across them.
Enable “Labels” to display each Region’s name on the map. Hover over any Region to view its details and performance metrics, such as Sequence Adherence, Performance Score, and Total Time.
Avoidance Zones Layer – Ensure Compliance And Safety
The Avoidance Zones layer displays all defined restricted areas on the map, helping ensure that routes comply with operational or regulatory constraints.
To choose which zones appear, click “Avoidance Zones” to open the zone list, then use the “Search Avoidance Zones” field or the checkboxes to show or hide specific zones.
Right-click any Avoidance Zone on the map to open an actions menu with options for managing it, as detailed in the table below.
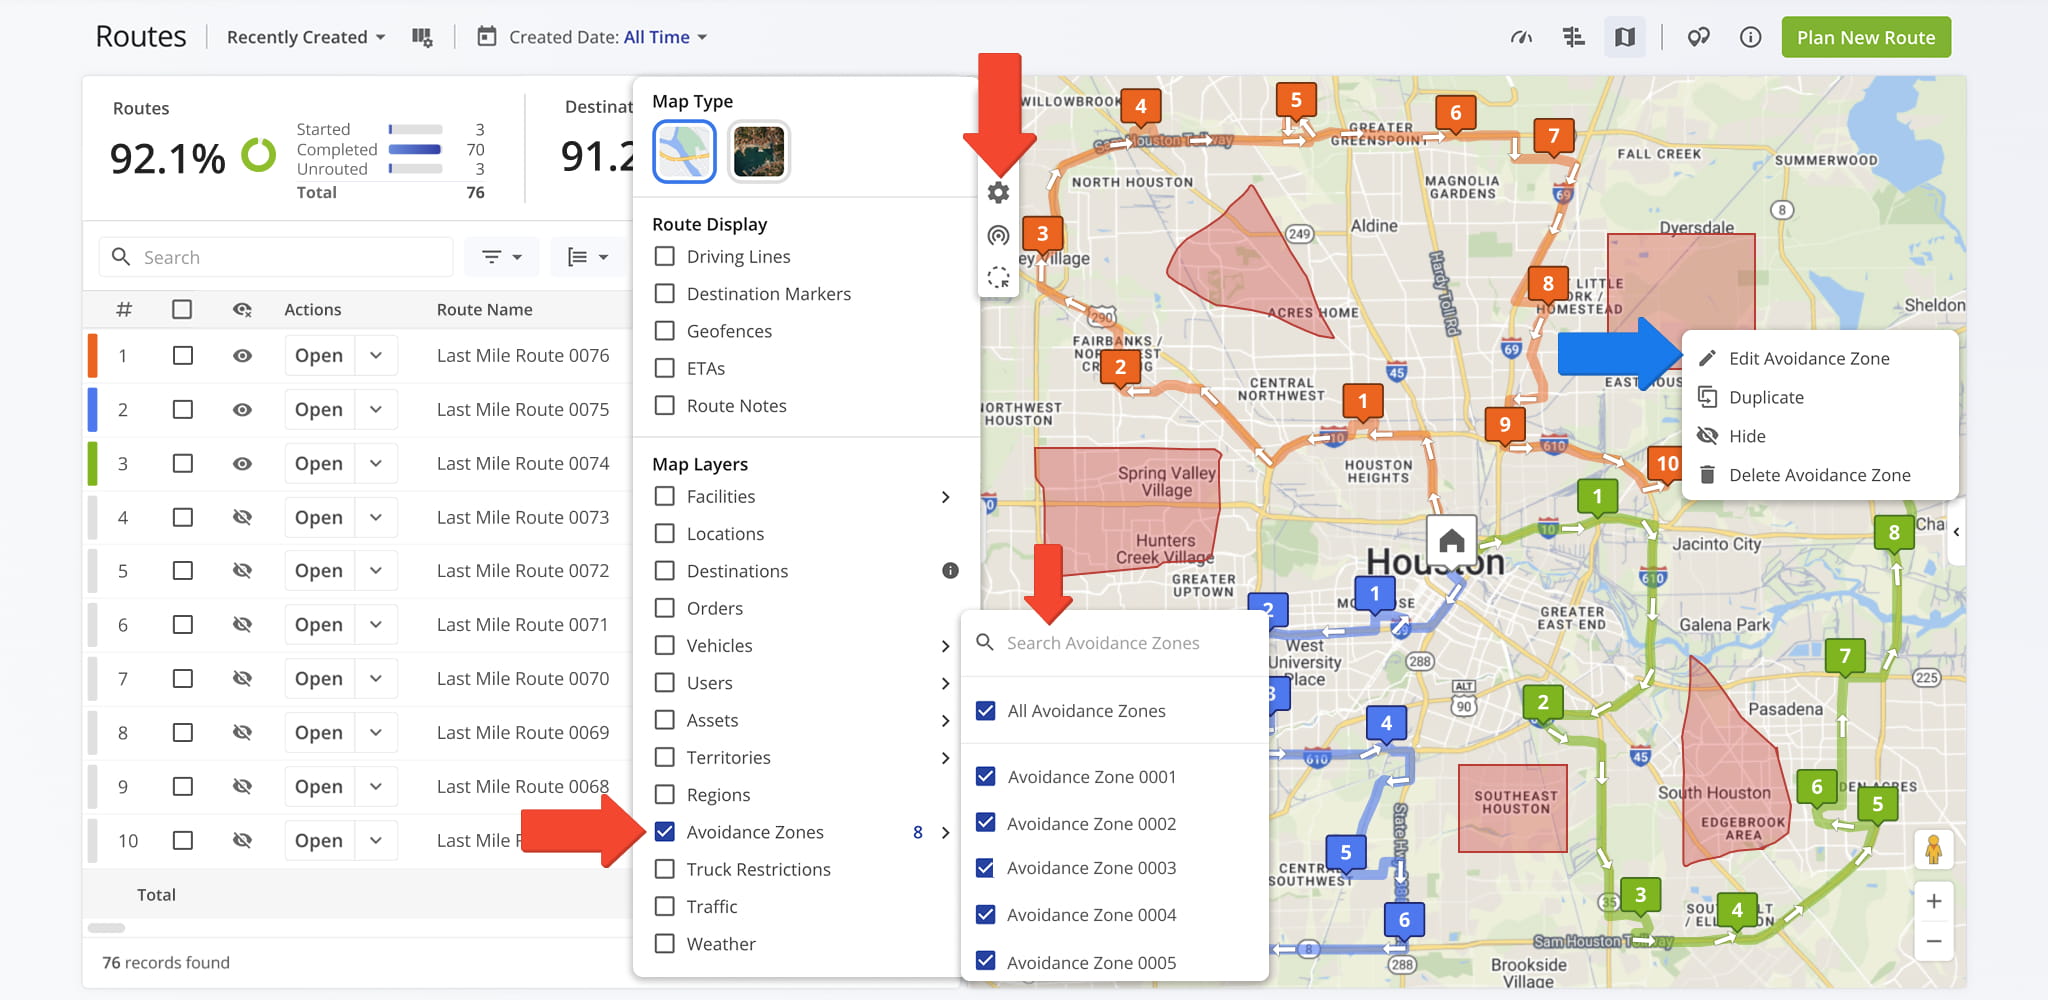
Avoidance Zone Actions Menu
Truck Restriction Layer – View Commercial Vehicle Constraints
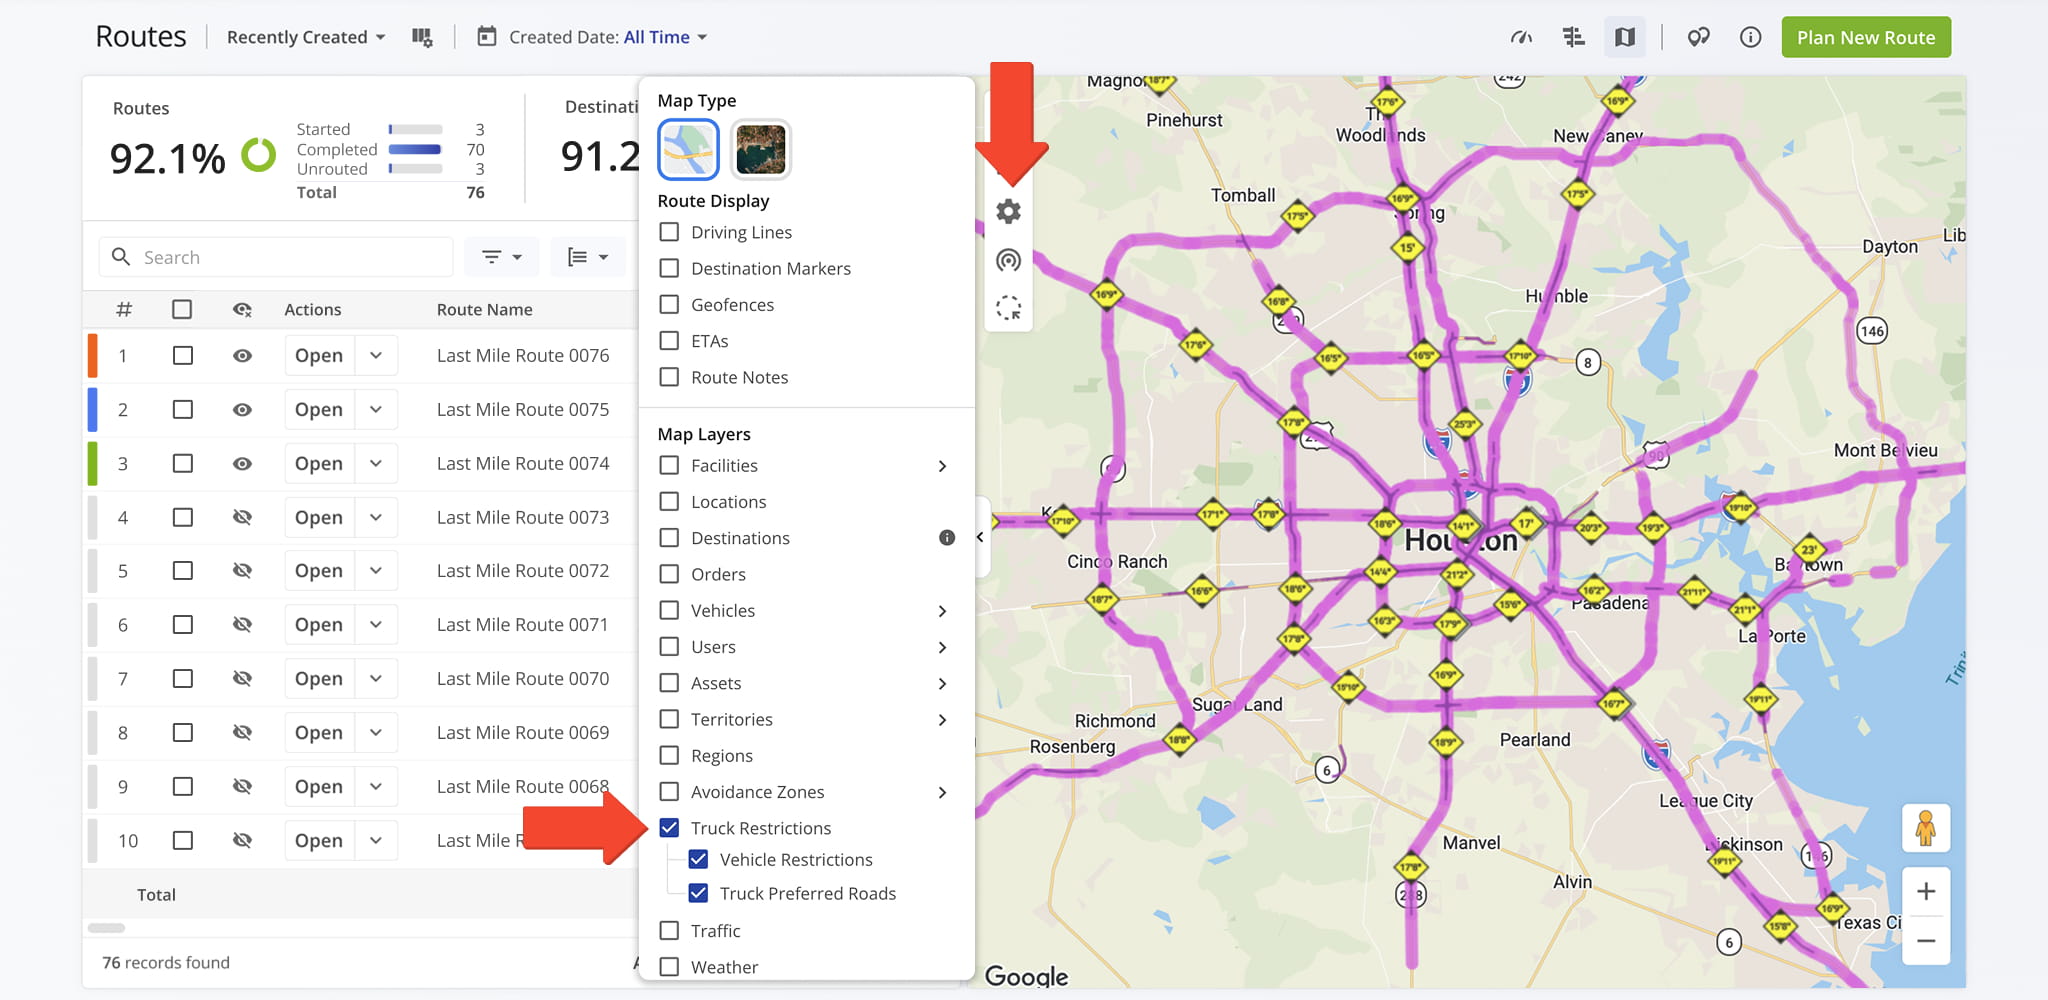
The Truck Restrictions layer lets you view commercial vehicle constraints and designated truck routes directly on the map.
Enable “Vehicle Restrictions” to display restriction signs, such as height, weight, length, bridge clearance, and hazardous materials limits. Enable “Truck Preferred Roads” to display designated or recommended commercial truck corridors.
Traffic Layer – Identify Congestion And Delays
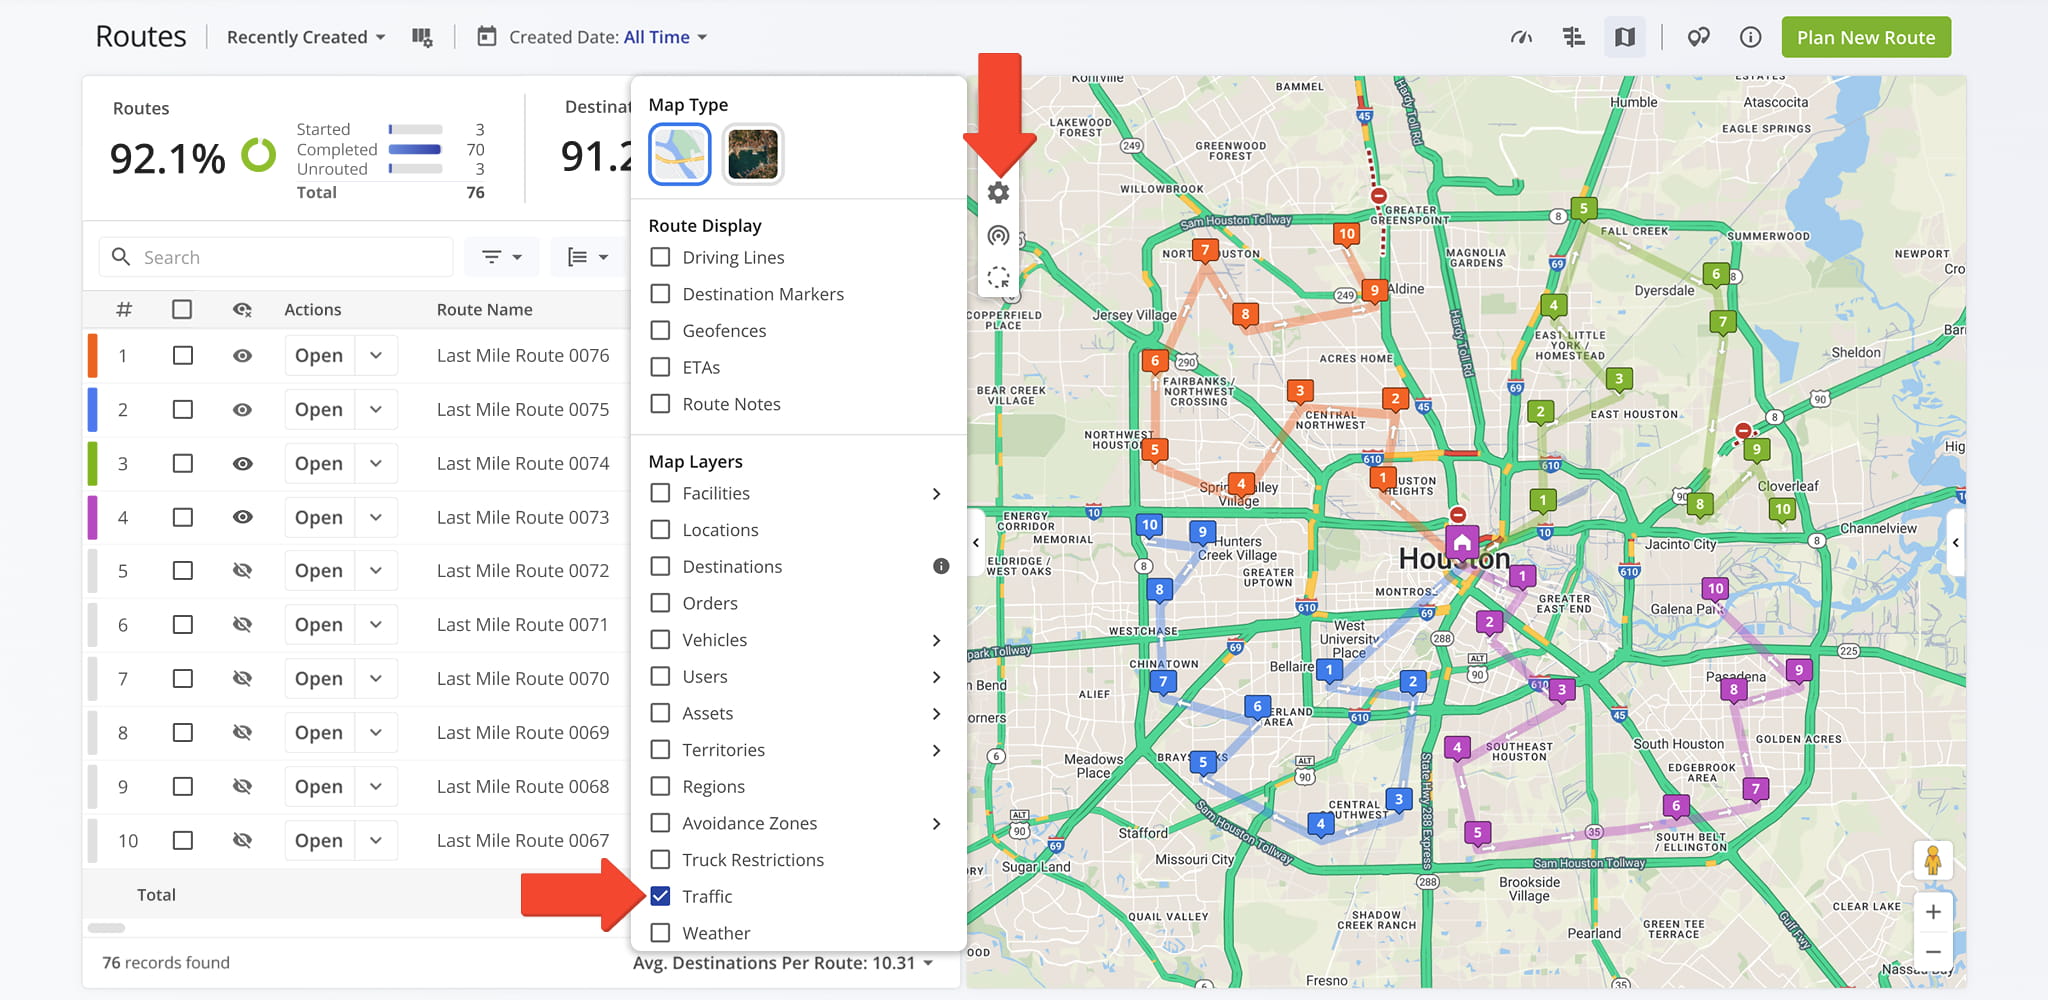
The Traffic layer overlays current traffic conditions on the map. This helps you identify congestion and adjust route planning to minimize delays and improve on-time performance.
Weather Layer – Radar, Storms, And Temperatures
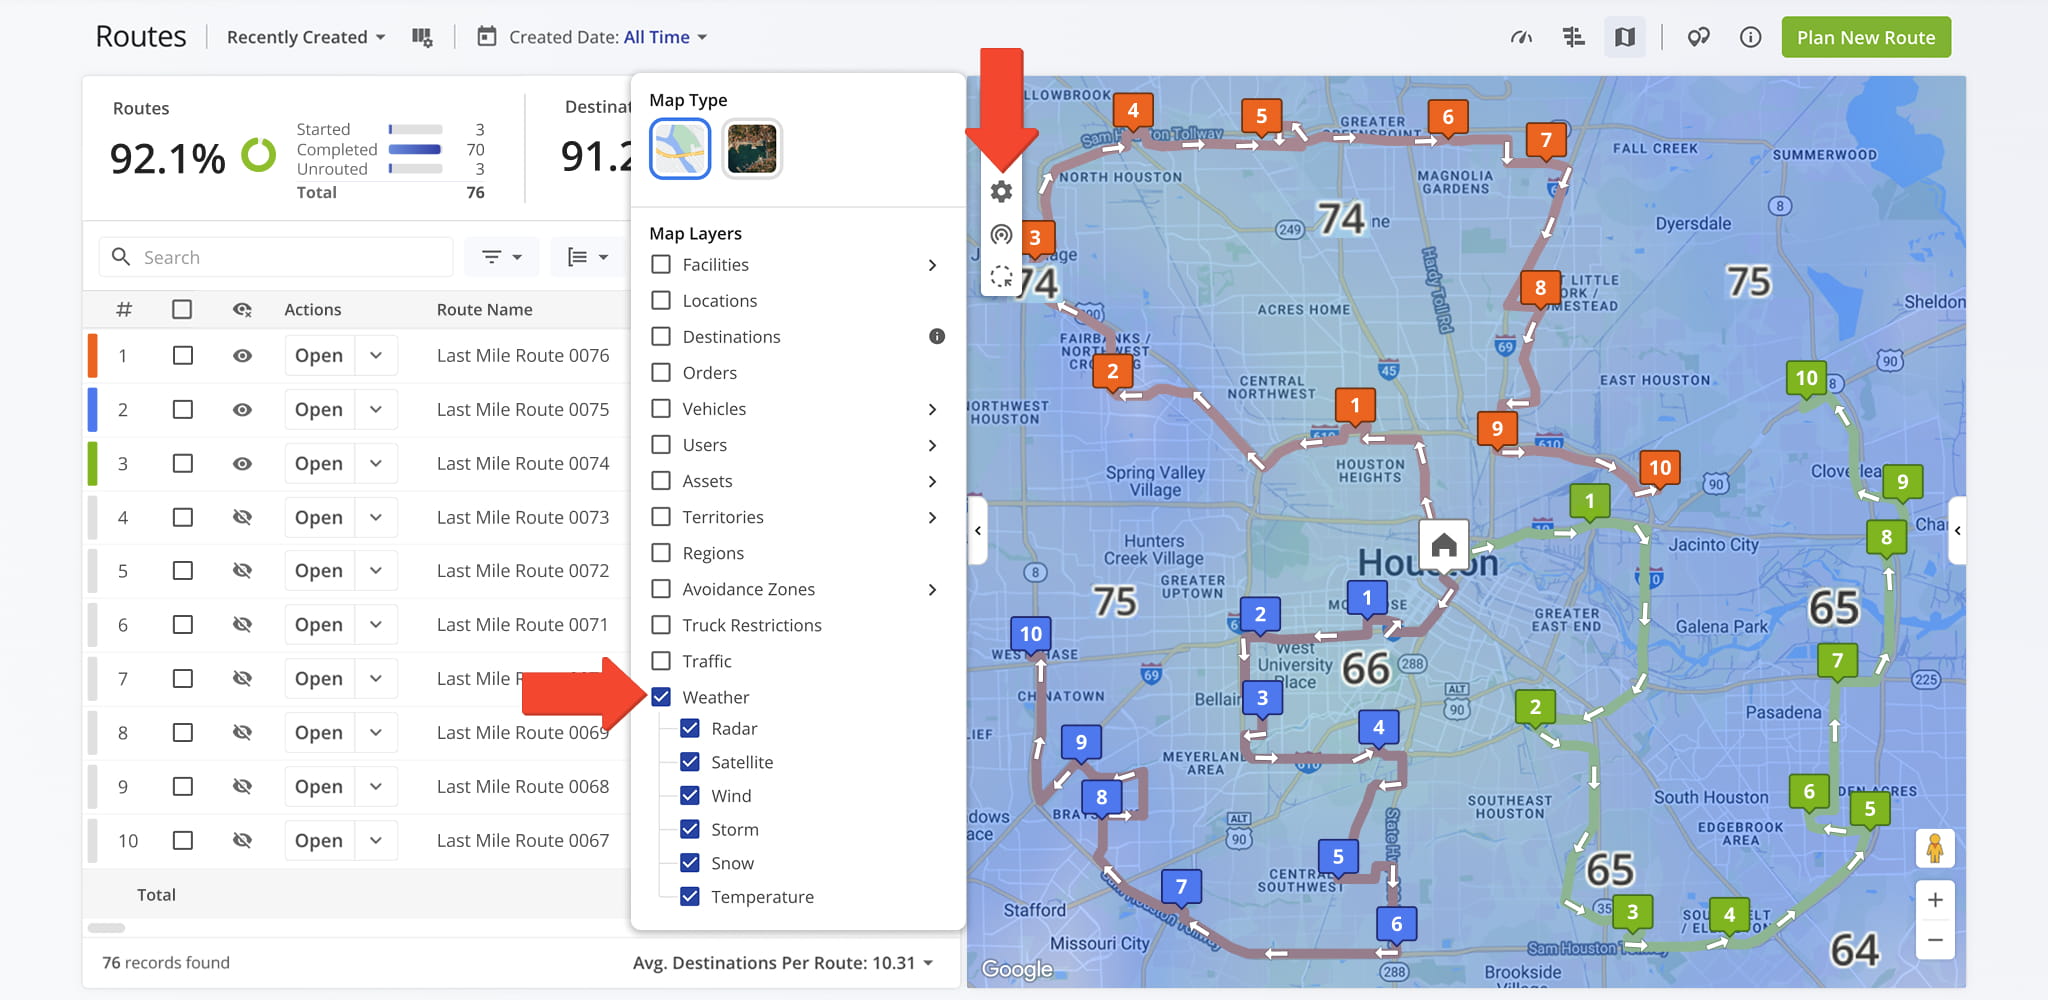
The Weather display overlays one or multiple weather-related layers on the map. View radar or satellite imagery, monitor wind patterns, track storms, see snow coverage, and display temperature to anticipate how weather will impact routes.
Visit Route4Me's Marketplace to Check out Associated Modules:
- Operations
Custom Data Add-On
- Operations
Advanced Team Management Add-On
About author: Daniel Archer