Contract Snapshot – Centralized Contract Overview
Route4Me’s Contract Snapshot gives enterprise business users a centralized view of detailed Contract data linked to customers, routes, and operational performance. Quickly review Contract terms, track associated activity, and analyze key metrics in one place. Filters, search, and customizable columns streamline Contract oversight and ensure fast access to information.
Table of Contents
Access Contract Snapshot – View Detailed Customer Contract Data
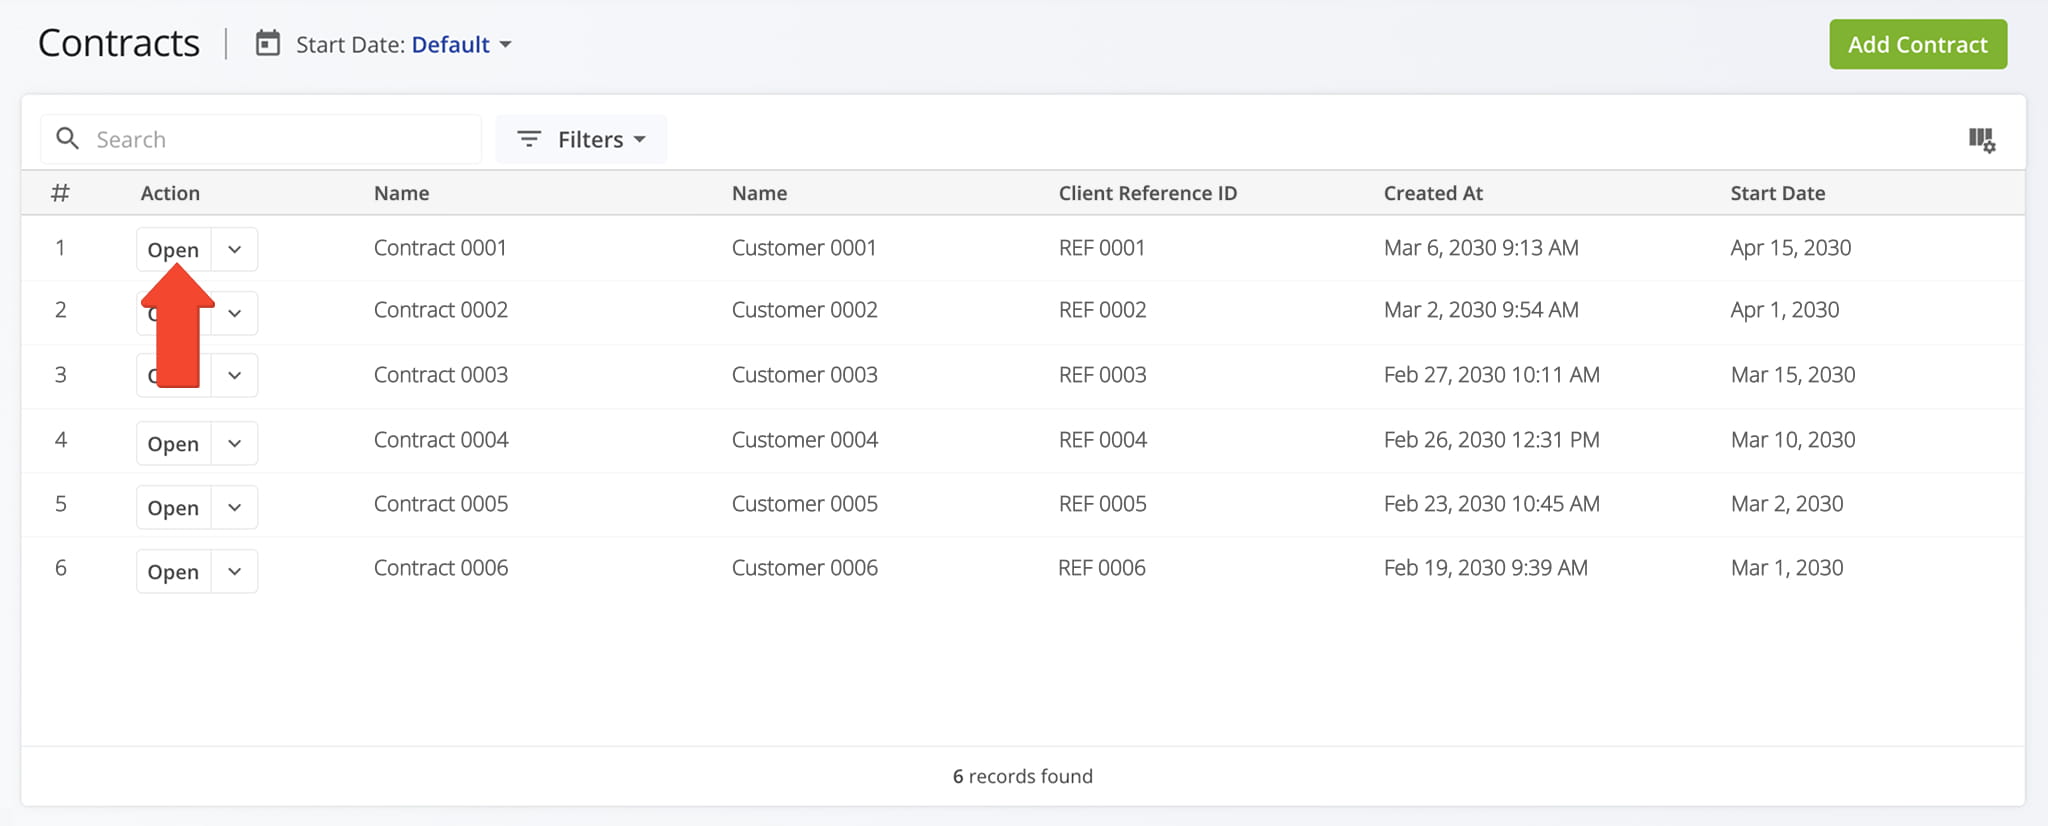
To open the Contract Snapshot for any Contract, select “ERP” > “Contracts” from the Navigation Menu. Then, from the Contracts Page, click “Open” next to the desired contract.
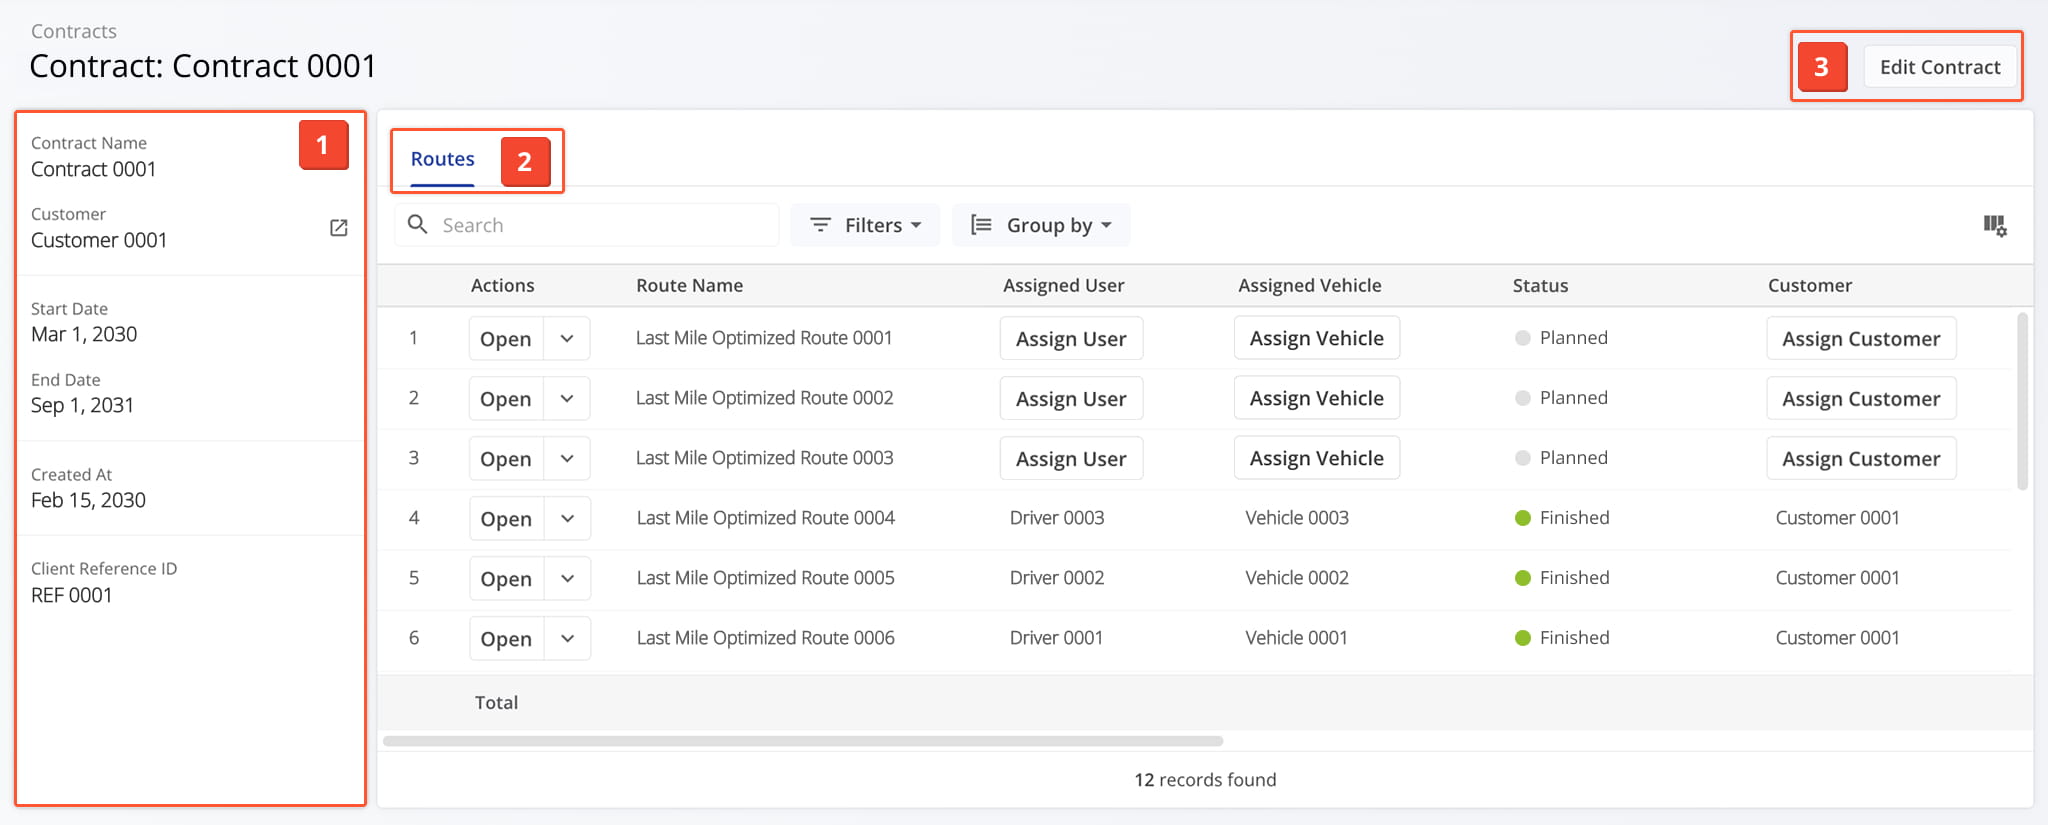
Once opened, you’ll see a detailed interface designed to help you review and manage all Contract data in one place:
- Summary Panel: Overview of key information about the Contract.
- Contract Data Tab: Explore Contract-related data, which you can filter and customize as needed.
- Edit Controls: Click the “Edit Contract” button in the top-right corner to modify Contract details.
Contract Overview – Detailed Snapshot Information Panel
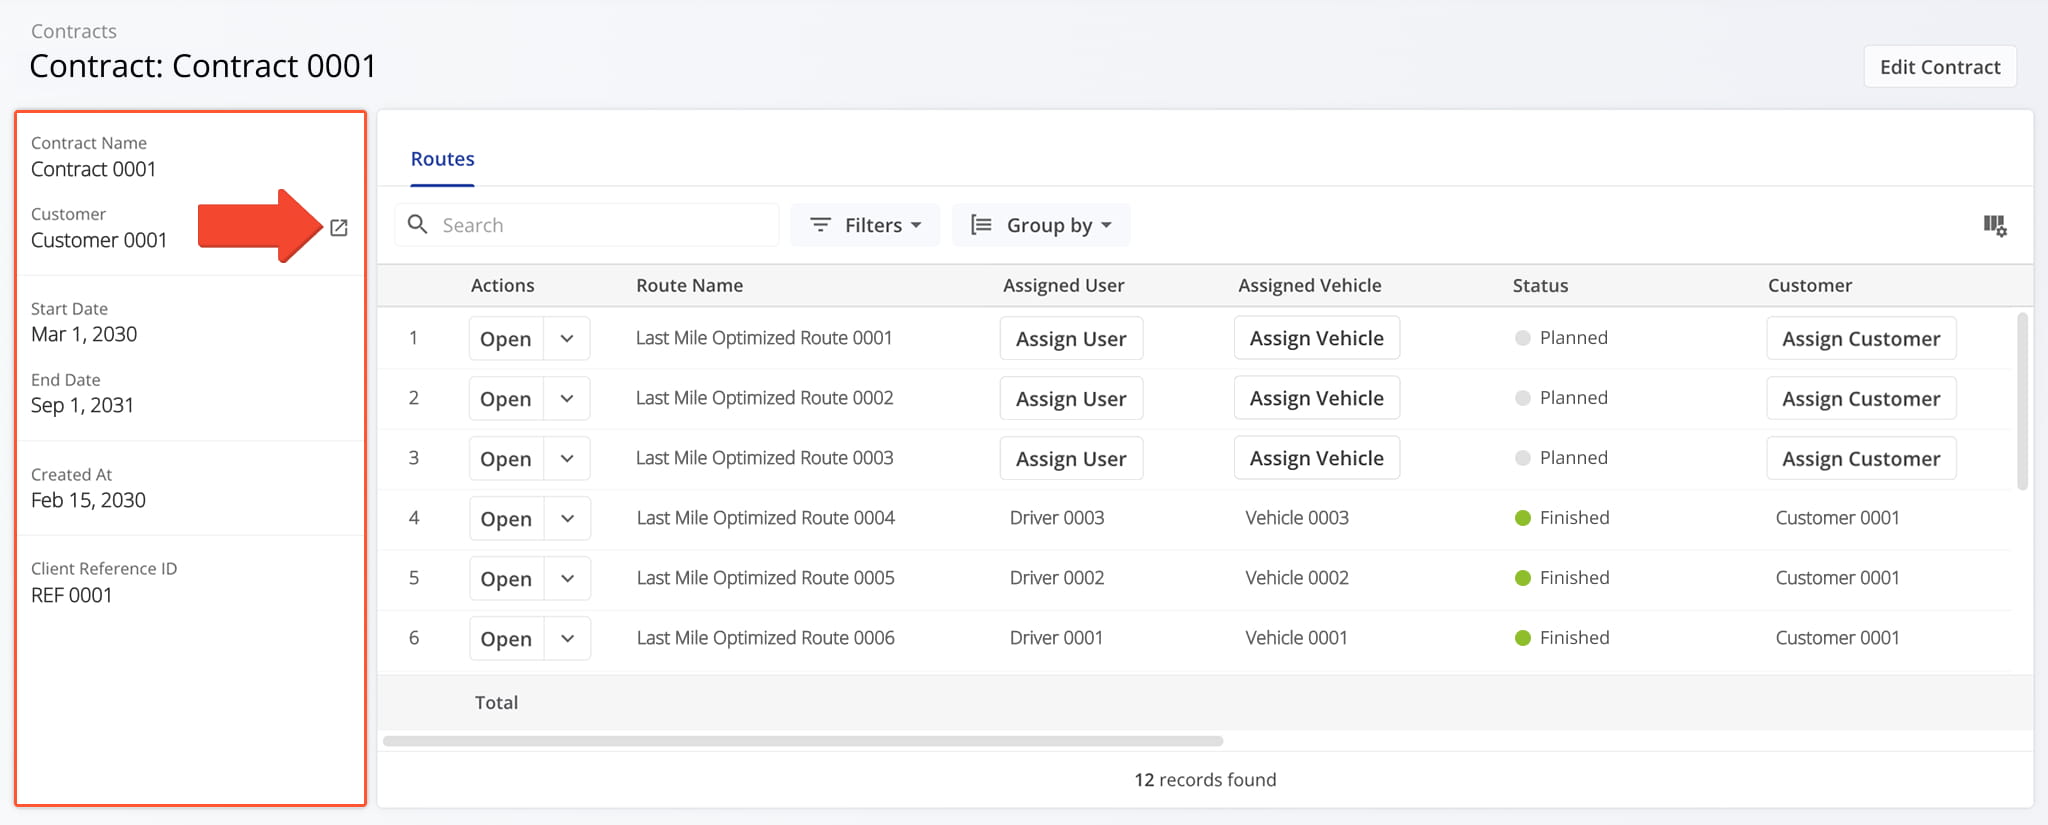
The Contract Summary Panel provides an overview of key contract details, including the contract name and important dates.
It also displays Customer information associated with the contract. To view additional Customer details, click the Go-To Icon next to “Customer” to open the Customer Snapshot.
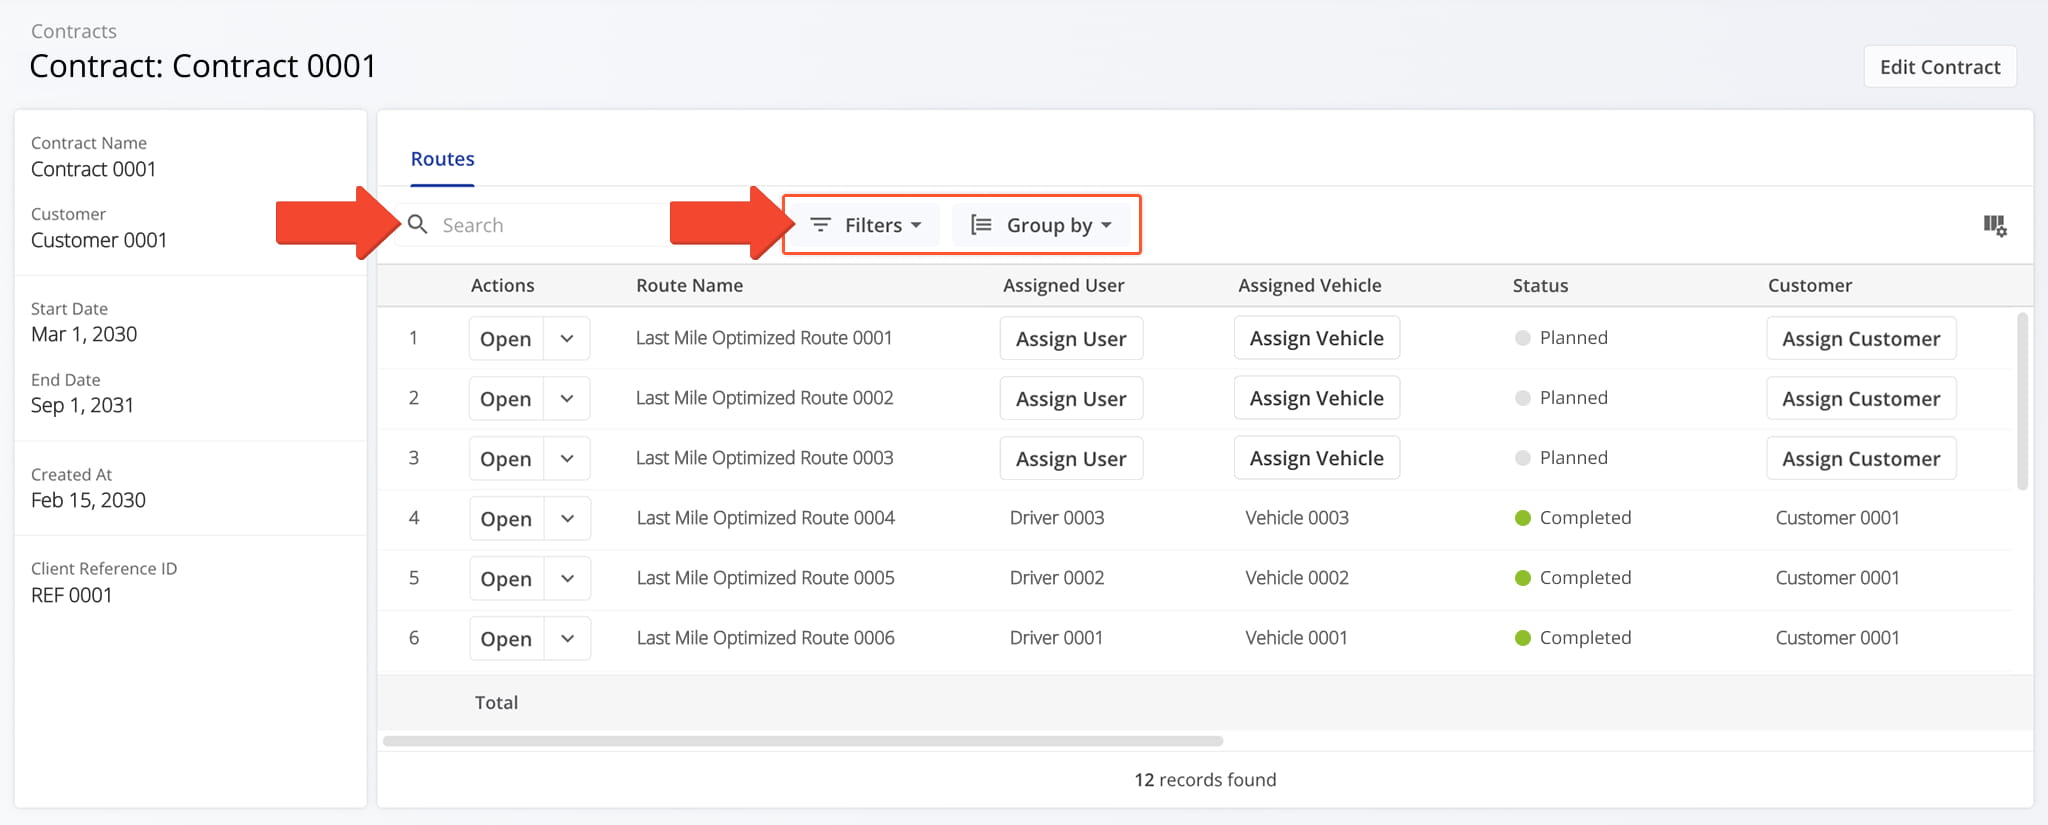
Contract Snapshot Data – Customizable Contract Data Table
The Contract Snapshot provides a customizable data table with detailed Contract information, including route details, key metrics, operational status updates, and other relevant fields.
You can use the Search field to quickly locate specific Contract items and apply Group By options or Filters, described in the table below, to display results based on selected criteria.
Contract Snapshot – Filters
User
Filter by user assigned to the route.
Vehicle
Filter by vehicle assigned to the route.
Facility
Filter by facility linked to the route.
Customer
Filter by customer linked to the route.
Strategic Optimization Name
Filter by the name of the strategic optimization used to generate or modify the route.
Scenario Name
Filter by the scenario applied during strategic route planning.
Status
Filter by the current progress or completion state of the route (e.g., Planned, Scheduled, Started, Completed).
Planned Total Route Duration (h)
Filter by the total estimated duration, in hours, planned for completing the route.
Planned Total Distance (mi)
Filter by the total planned distance, in miles, for completing all stops on the route.
Destinations Arrived (Progress %) (User Actioned)
Filter by the percentage of planned destinations the driver has arrived at.
Destinations Count
Filter by the total number of destinations assigned to the route.
Pending Destinations
Filter by destinations not yet started or completed by the driver.
Failed Destinations
Filter by destinations marked as failed due to inability to complete service.
Skipped Destinations
Filter by destinations the driver intentionally skipped or bypassed.
Completed Destinations
Notes Count
Filter by number of notes added to the route by users or automated processes.
Destinations Arrived Late (User Actioned)
Filter by destinations where the driver arrived after the scheduled time window.
Destinations Arrived Early (User Actioned)
Filter by destinations where the driver arrived earlier than the scheduled time window.
Destinations Arrived On Time (User Actioned)
Filter by destinations where the driver arrived within the scheduled time window.
Out of Sequence Destinations (#)
The number of destinations visited in an order different from the planned sequence.
Actual Total Distance (Mobile App) (mi)
Total distance in miles recorded by the mobile app during the route.
Actual Total Distance (Telematics)
Total distance in miles recorded from the assigned vehicle’s telematics device.
Planned
Filter by total planned Pieces (units) amount of all Destinations on the planned route.
Completed
Filter by total number of completed pieces or units.
Completed (%)
Filter by percentage of pieces or units completed.
Remaining At End (%)
Filter by percentage of pieces or units still remaining when the route ended.
Planned
Filter by total planned Weight amount of all Destinations on the planned route.
Completed
Filter by total weight completed across all serviced destinations.
Completed (%)
Filter by percentage of planned weight completed.
Remaining At End (%)
Filter by percentage of planned weight still remaining at the route’s end.
Planned
Filter by total planned Cube (volume) amount of all Destinations on the planned route.
Completed
Filter by total cubic volume completed across all serviced destinations.
Completed (%)
Filter by percentage of the planned volume completed.
Remaining At End (%)
Filter by percentage of planned volume remaining at the route’s end.
Planned
Filter by total revenue to be generated from servicing all route Destinations.
Completed
Filter by percentage of planned revenue achieved.
Remaining At End (%)
Filter by percentage of revenue still unfulfilled at route end.
Cost Planned
Filter by total planned cost amount associated with all Destinations on the planned route.
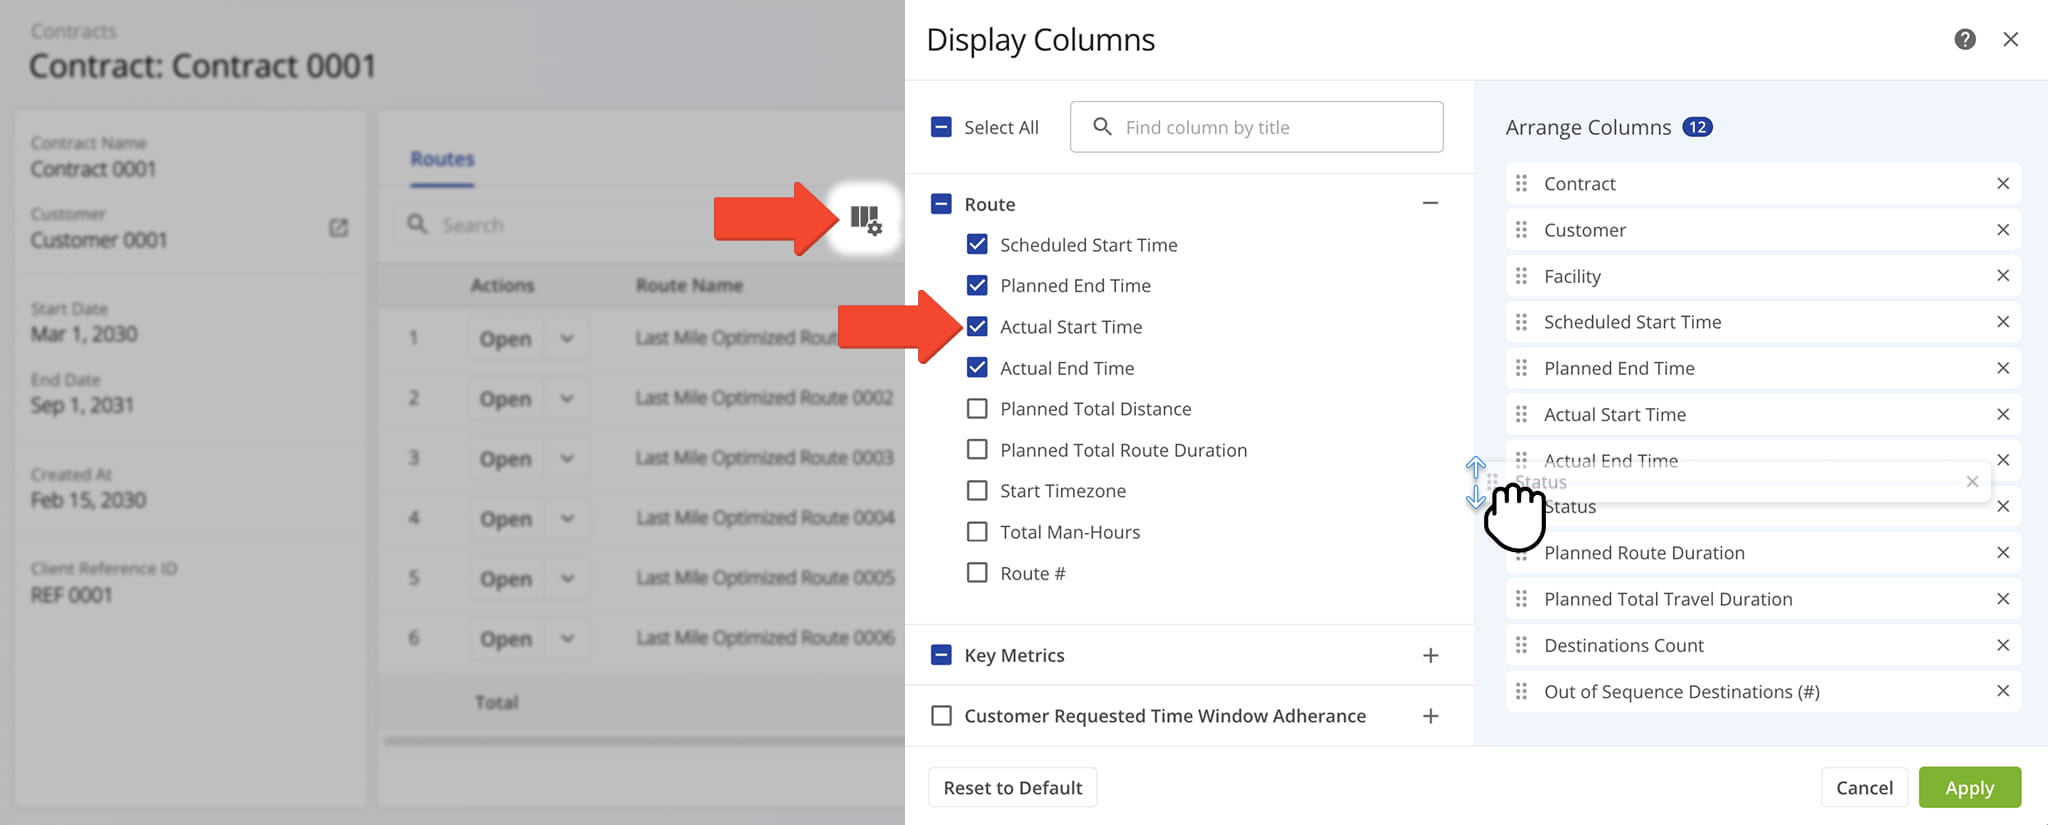
You can also customize the data displayed in the table. Click the Column Icon in the upper right corner to select which route data fields appear and adjust their order to suit your operational needs.
The table below provides an overview of all available data columns, which you can reorder by dragging them into place.
Contract Snapshot – Data Columns
Scheduled Start Time
Scheduled start time for the route.
Planned End Time
Planned end time for the route.
Actual Start Time
Time when the route actually started.
Actual End Time
Time when the route actually ended.
Total distance planned for the route, including all stops.
Planned Total Route Duration
Estimated total duration for completing the route.
Timezone of the route’s start location.
Total Man Hours
Total estimated working hours for completing the route.
Route #
The route number. This is relevant when you are exporting multiple routes.
Destinations Count
Total number of destinations planned for the route.
Pending Destinations
Number of destinations not yet visited.
Number of destinations that could not be completed.
Number of destinations intentionally skipped.
Number of destinations successfully completed.
Notes Count
Total number of notes added to the route by users or automated processes.
Route Start Odometer
The vehicle odometer reading at the beginning of the route.
Route End Odometer
The vehicle odometer reading at the completion of the route.
Destinations Arrived On-Time (User Actioned)
Destinations where arrival matched the scheduled time, based on user input.
Destinations Arrived Early (User Actioned)
Destinations reached earlier than scheduled, based on user input.
Destinations Arrived Late (User Actioned)
Destinations reached later than scheduled, based on user input.
First Access Time
Date and time the route was first viewed by a user.
Status
Current progress or completion status of the route.
Dispatch
Indicates whether the route has been assigned to a driver or team.
Number of destinations marked as arrived by user actions.
Destinations Arrived (Progress %) (User Actioned)
Percentage of destinations completed, based on user input.
Actual Total Distance (Mobile App)
Total distance traveled, recorded by the mobile app.
Actual Total Distance (Telematics)
Total distance traveled, recorded by telematics.
Actual Total Distance (Merged)
Combined distance from mobile app and telematics data.
Actual Route Duration (User Actioned)
Actual Route Duration is calculated based on the received Mobile App GPS data. Duration is measured from when the route was started to when the route was ended by the assigned User on the Mobile App.
Actual Total Route Duration (Grand Total of All Sub-Durations)
The total time spent traveling the route, including all individual segments and stop durations.
Actual Total Travel Duration (User Actioned)
The total time spent traveling the route, recorded from driver actions in the Mobile App.
Actual Total Service Duration (User Actioned)
The total time drivers spent servicing stops, recorded from actions in the Mobile App.
Actual Total Wait Duration (User Actioned)
Total amount of time that a driver spent being inactive while driving the route (i.e., a route started before the opening hours and a driver had to wait, a driver arrived at the address before the opening of the Time Window, etc.).
Actual Total Break Duration
The total duration of all scheduled breaks for the route, calculated based on the planned stops and route schedule.
Actual Total Unattributed Duration
Time not attributed to driving, service, or breaks.
Actual Total Service Time (Auto Detected)
The total amount of the average Service Time of all destinations on the route.
Total duration of route recorded via the mobile app.
Total duration of route recorded via telematics.
Estimated total route duration.
Planned Total Travel Duration
Estimated driving time for the route.
Planned Total Wait Duration
Estimated total wait time during the route.
Planned Total Service Duration
Estimated total service time at destinations.
Planned Total Break Duration
Estimated total driver break time.
Out of Sequence Destinations (#)
The number of destinations visited in an order different from the planned sequence.
Out of Sequence Destinations (%)
The percentage of destinations visited in an order different from the planned sequence.
Facility
The depot, warehouse, or starting point used for planning the route; serves as the origin for route sequencing and time calculations.
Customer
The name of the customer associated with the route or destination, as defined in the account or order data.
Contract
The name or identifier of the contract linked to the assigned customer, if applicable, used for tracking or reporting purposes.
Total number of pieces planned for delivery.
Pieces Completed
Number of pieces successfully delivered.
Pieces Completed (%)
Percentage of planned pieces delivered.
Pieces Remaining At End (%)
Percentage of pieces undelivered at the route’s end.
Total weight of items planned for delivery.
Weight Completed
Weight of items successfully delivered.
Weight Completed (%)
Percentage of planned weight delivered.
Weight Remaining At End (%)
Percentage of weight remaining at the end of the route.
Total cubic volume planned for delivery.
Cube Completed
Cubic volume successfully delivered.
Cube Completed (%)
Percentage of planned cubic volume delivered.
Cube Remaining At End (%)
Percentage of cubic volume remaining at the end of the route.
Planned revenue for the route based on scheduled deliveries.
Revenue Completed
Revenue earned from completed deliveries.
Revenue Completed (%)
Percentage of planned revenue achieved.
Revenue Remaining At End (%)
Percentage of planned revenue remaining at the route’s end.
Estimated cost associated with completing all stops on the route, including labor, fuel, and other operational expenses.
Name of the strategic optimization applied to the route.
Scenario associated with the strategic optimization.
Visit Route4Me's Marketplace to Check out Associated Modules:
- Operations
Audit Logging and Activity Stream
- Operations
Custom Data Add-On
- Operations
Advanced Team Management Add-On
About author: Daniel Archer
With a background in pedagogy and writing instruction, Daniel is a former tenured English Instructor who, after nearly 20 years of teaching, transitioned into content strategy and leading writing teams for global brands. Now, as Technical Documentation Manager at Route4Me, he translates complex logistics technology into clear, accessible content that empowers users.