Operational Monitor – Show Live Route Performance Scores On Any Screen With A Dynamic Operations Monitor
The Operational Monitor is a live performance dashboard designed for wall-mounted and ceiling-mounted screens. You can configure metrics, settings, and layouts to easily visualize and display your routing performance. For example, you can show routes by Service Level Agreement (SLA) scores and Arrival Time Adherence (ATA) for a whole Company Facility or a single route. To set up the Operational Monitor for your organization, please get in touch with Route4Me Support or your routing expert.
NOTE: The screens, metrics, themes, and score color ranges in this guide are an example configuration.
Table of Contents
Operational Monitor Overview – Example Route Scores, SLA & ATA Screens
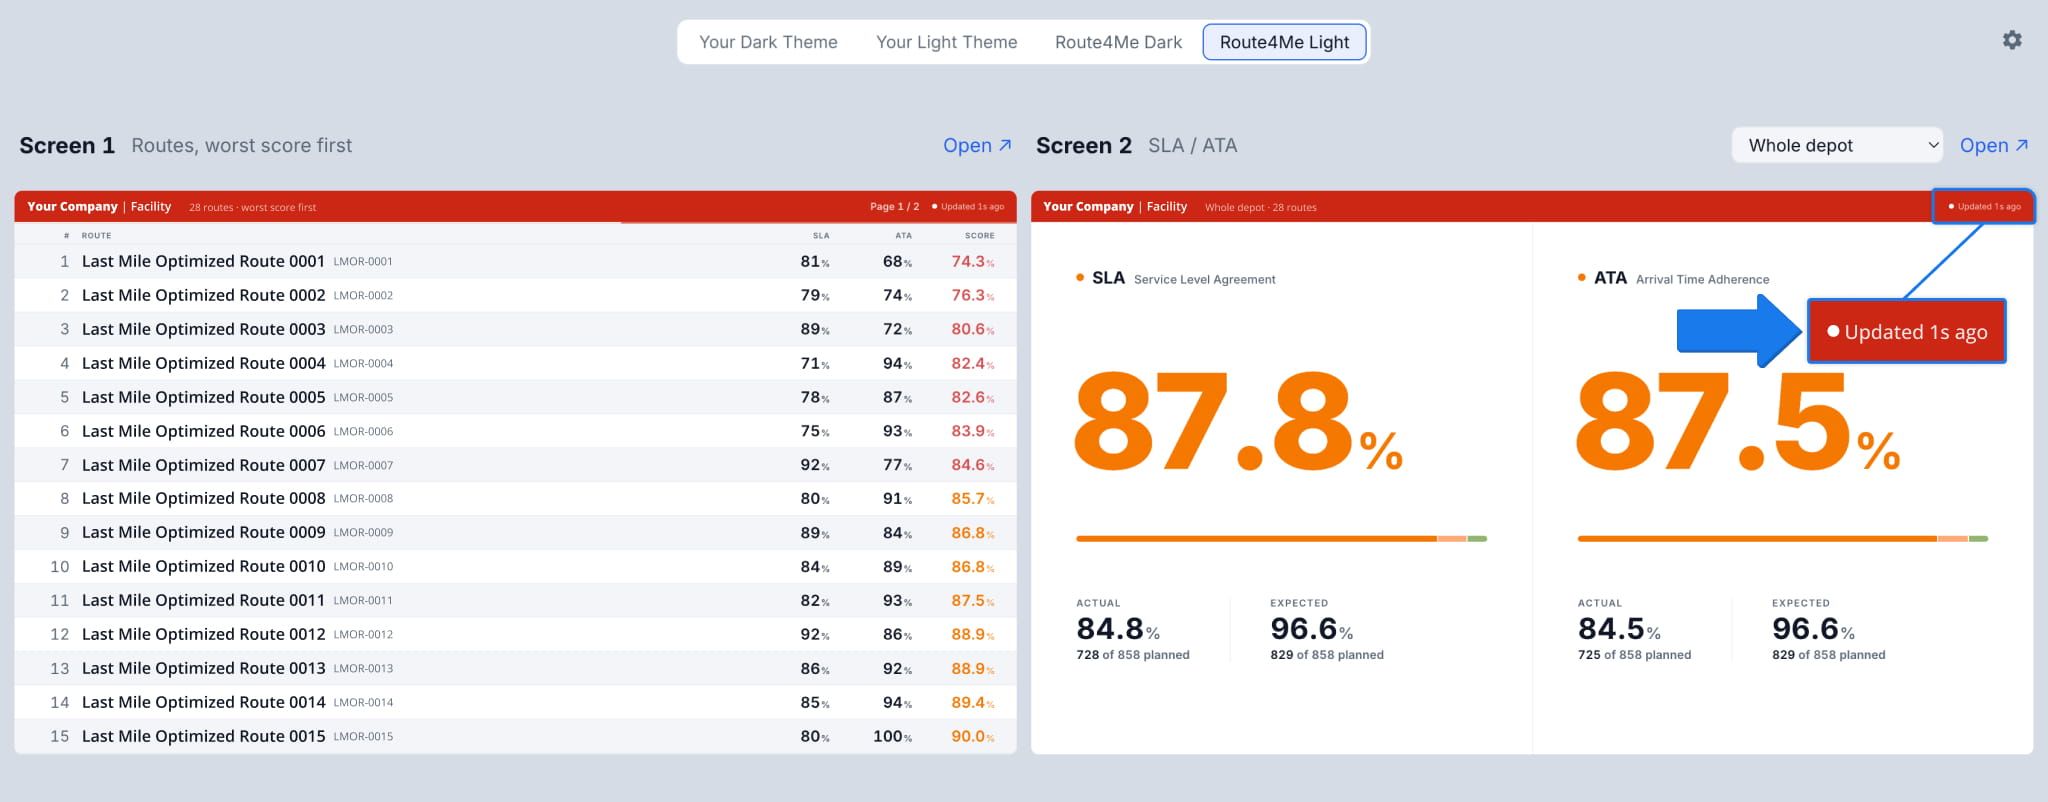
The example Operational Monitor in this guide is configured with the following two screens:
- Screen 1 – Routes, Worst Score First: A table of today’s routes for the selected Facility, ranked from the lowest score to the highest. Each route shows its SLA, ATA, and overall score, with scores color-coded from red (lowest) to green (highest).
NOTE: If there are more routes than fit on one screen, Screen 1 splits them into pages and switches pages automatically. - Screen 2 – SLA & ATA Performance: Large, color-coded SLA and ATA bars and percentages for a whole depot or a single route, with their actual and expected values shown under each as percentages and totals.
Data shown on your Operational Monitor screens can be updated as often as every second. You can specify your preferred update interval when setting up the Operational Monitor with your routing expert or Route4Me Support.
Open In Full-Screen View – Live Route Performance Dashboard
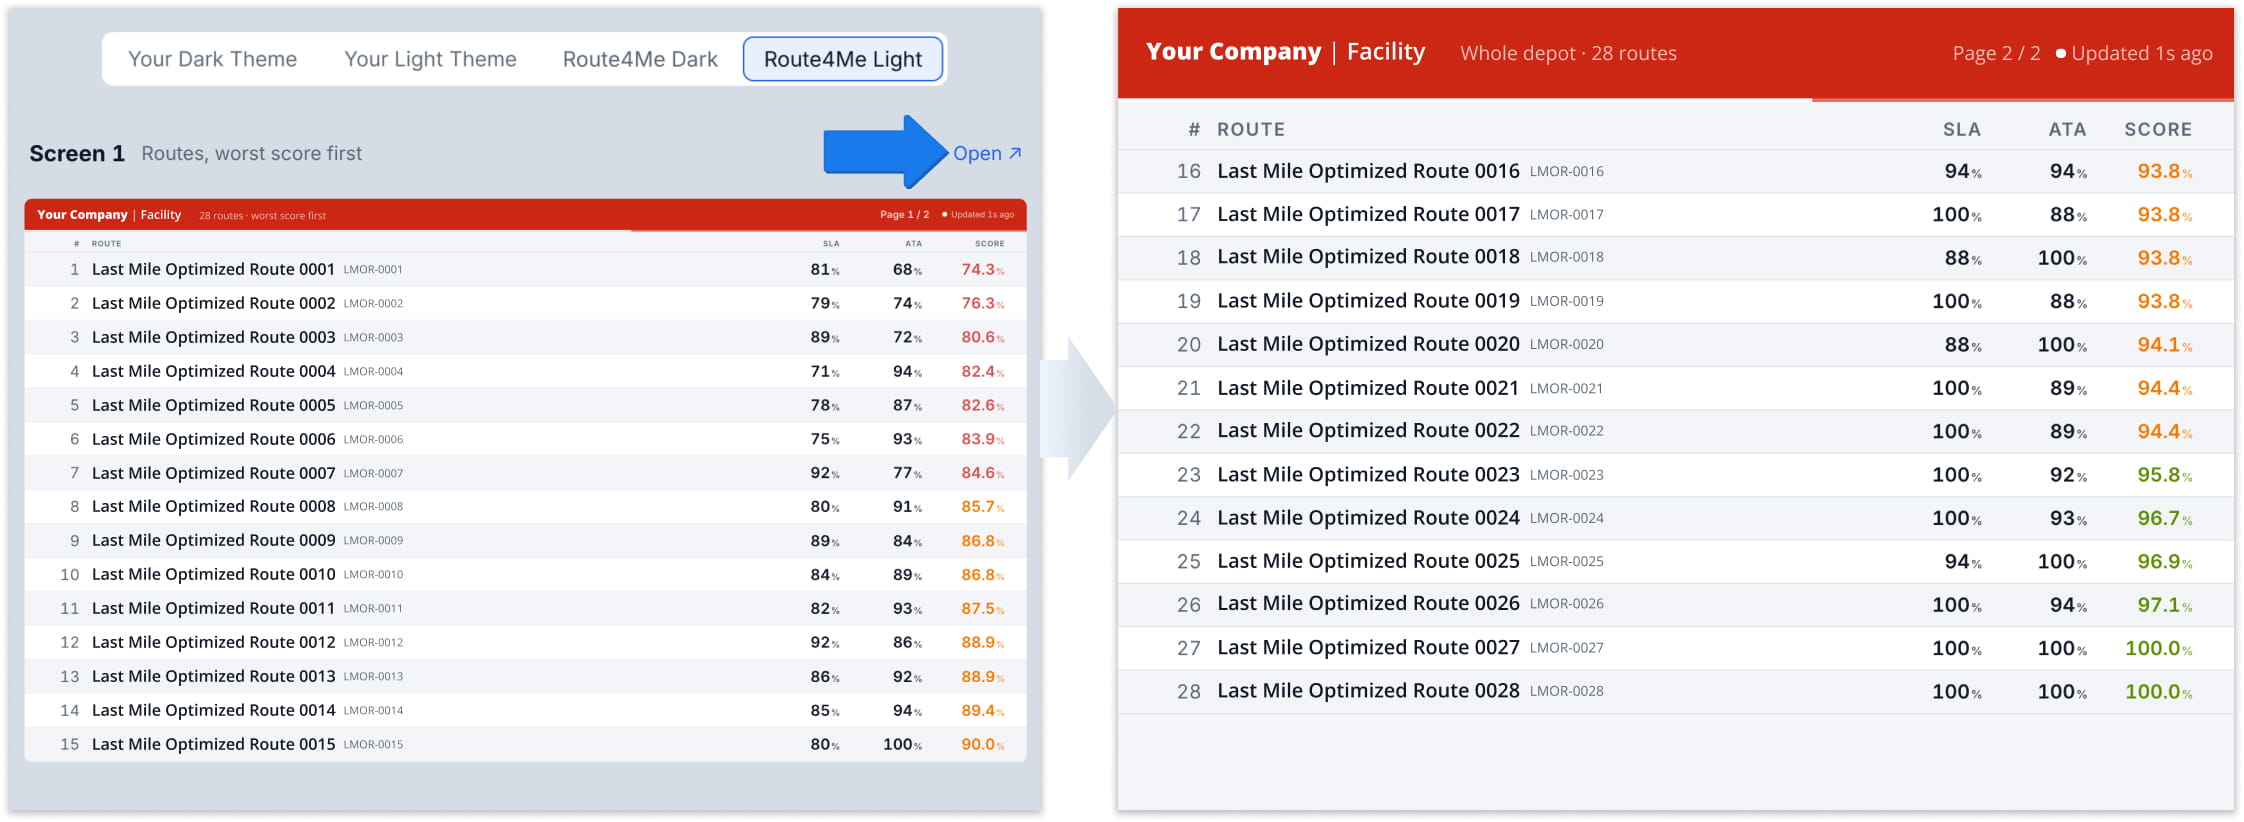
To show a screen on a separate display, such as a wall-mounted monitor or TV, simply click “Open” next to it.
The screen opens in a new, dedicated browser tab that you can move to the display and switch to full-screen mode. Each screen updates automatically, and the header shows when its data was last updated.
Customize Operational Monitor Screens – Themes & Data Visualization
Light & Dark Themes – Match Monitor Screens To Your Display
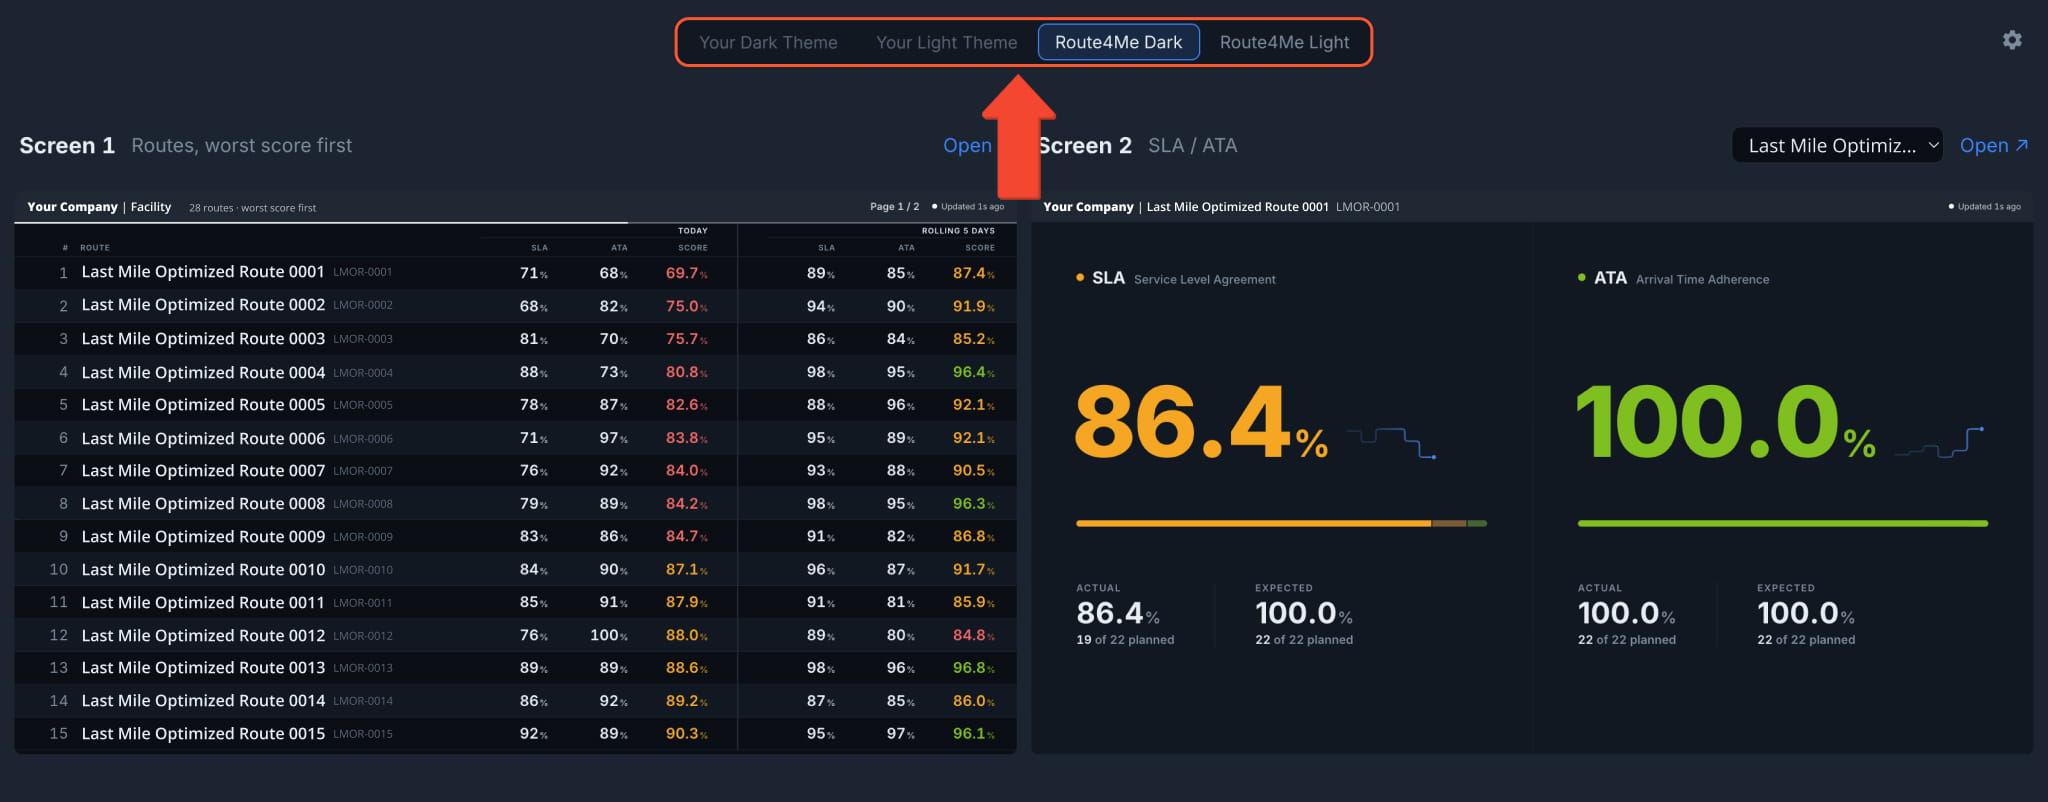
To change how the Operational Monitor screens look, select a theme at the top of the page. Dark themes are easier to read on wall-mounted displays in brightly lit areas and reduce glare in dim ones.
You can select from preconfigured Route4Me Dark and Route4Me Light themes or configure your own when setting up the Operational Monitor with your routing expert or Route4Me Support.
Rolling 5-Day Data – Compare Today’s Route Performance To Recent Days
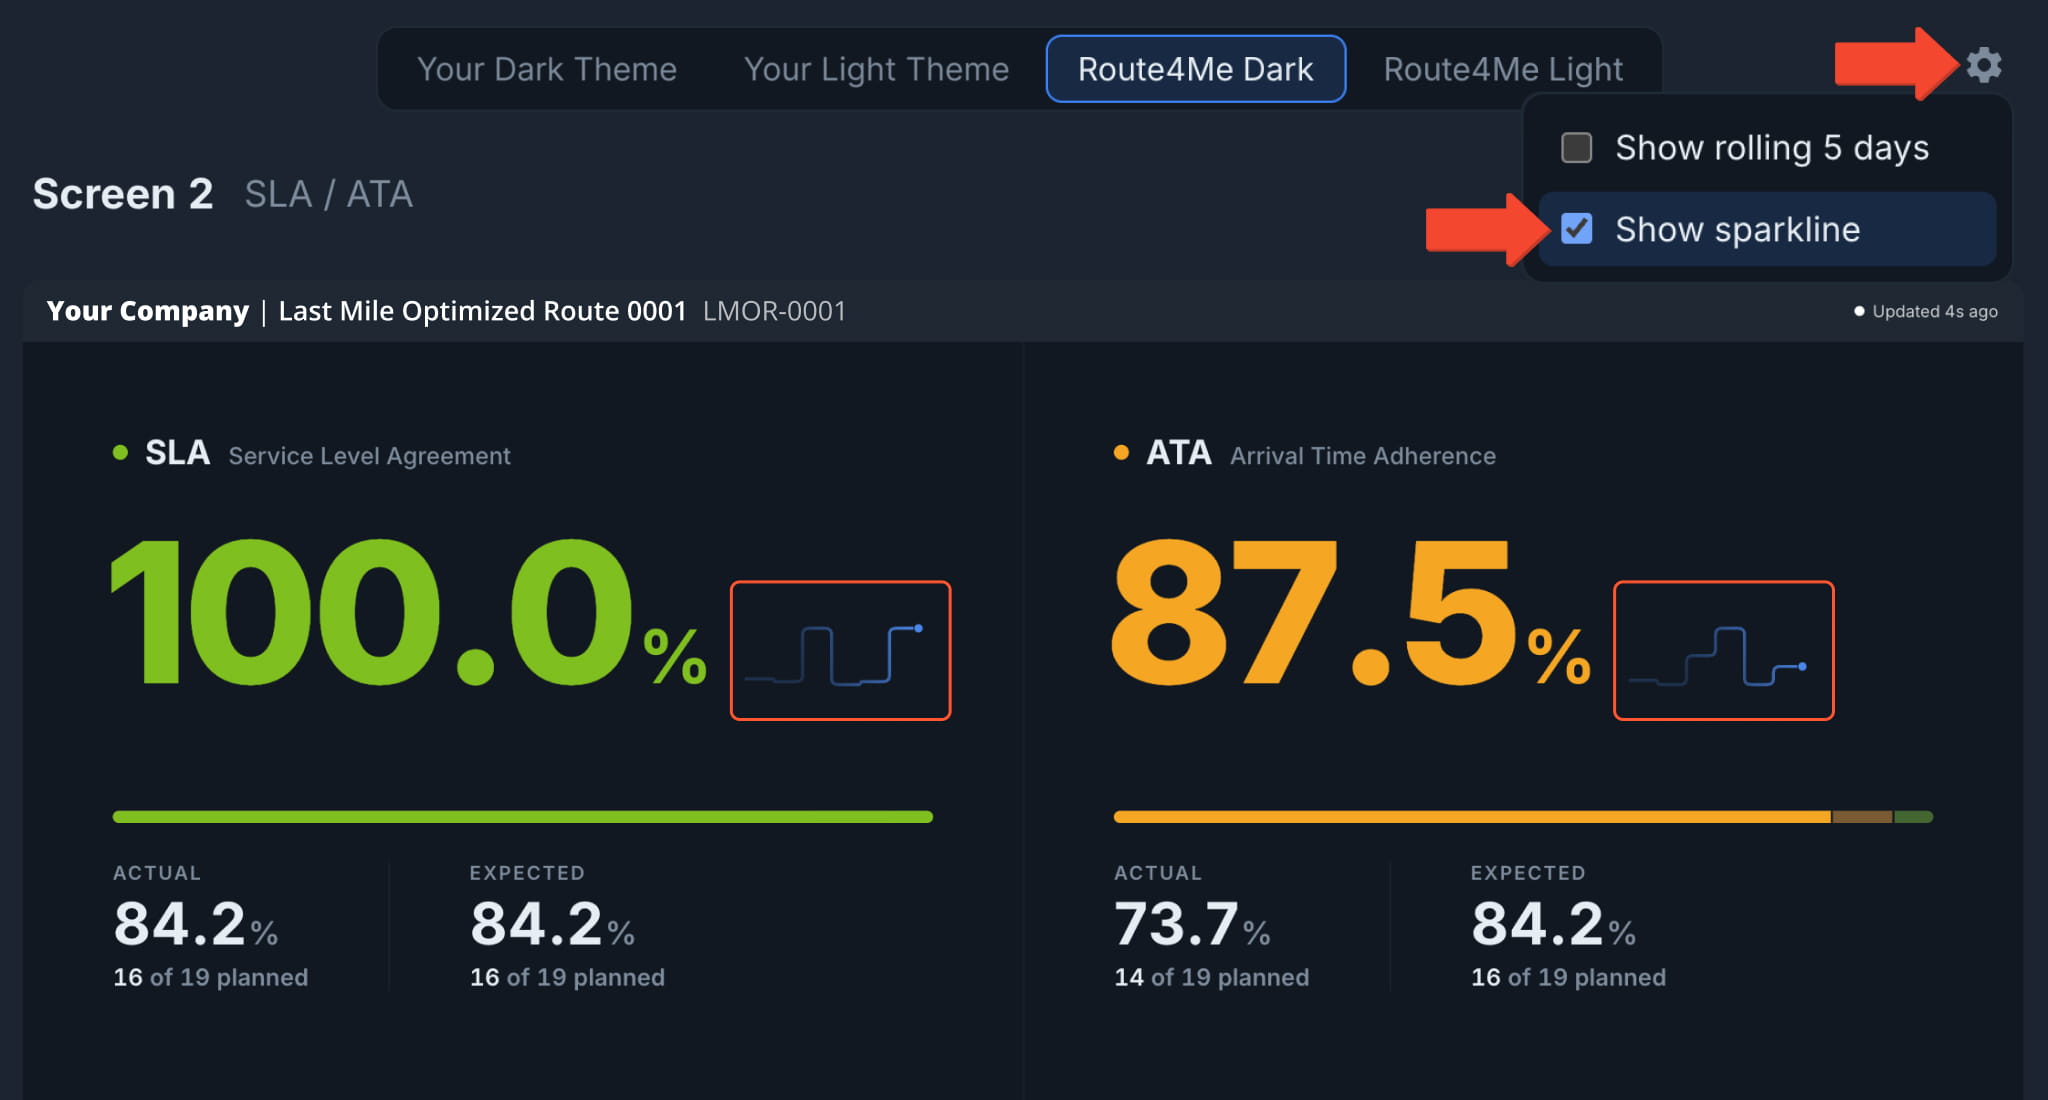
To compare today’s performance with recent days, click the Gear Icon in the upper-right corner and check “Show rolling 5 days”. Screen 1 then shows two sets of SLA, ATA, and Score columns: “Today” and “Rolling 5 Days”.
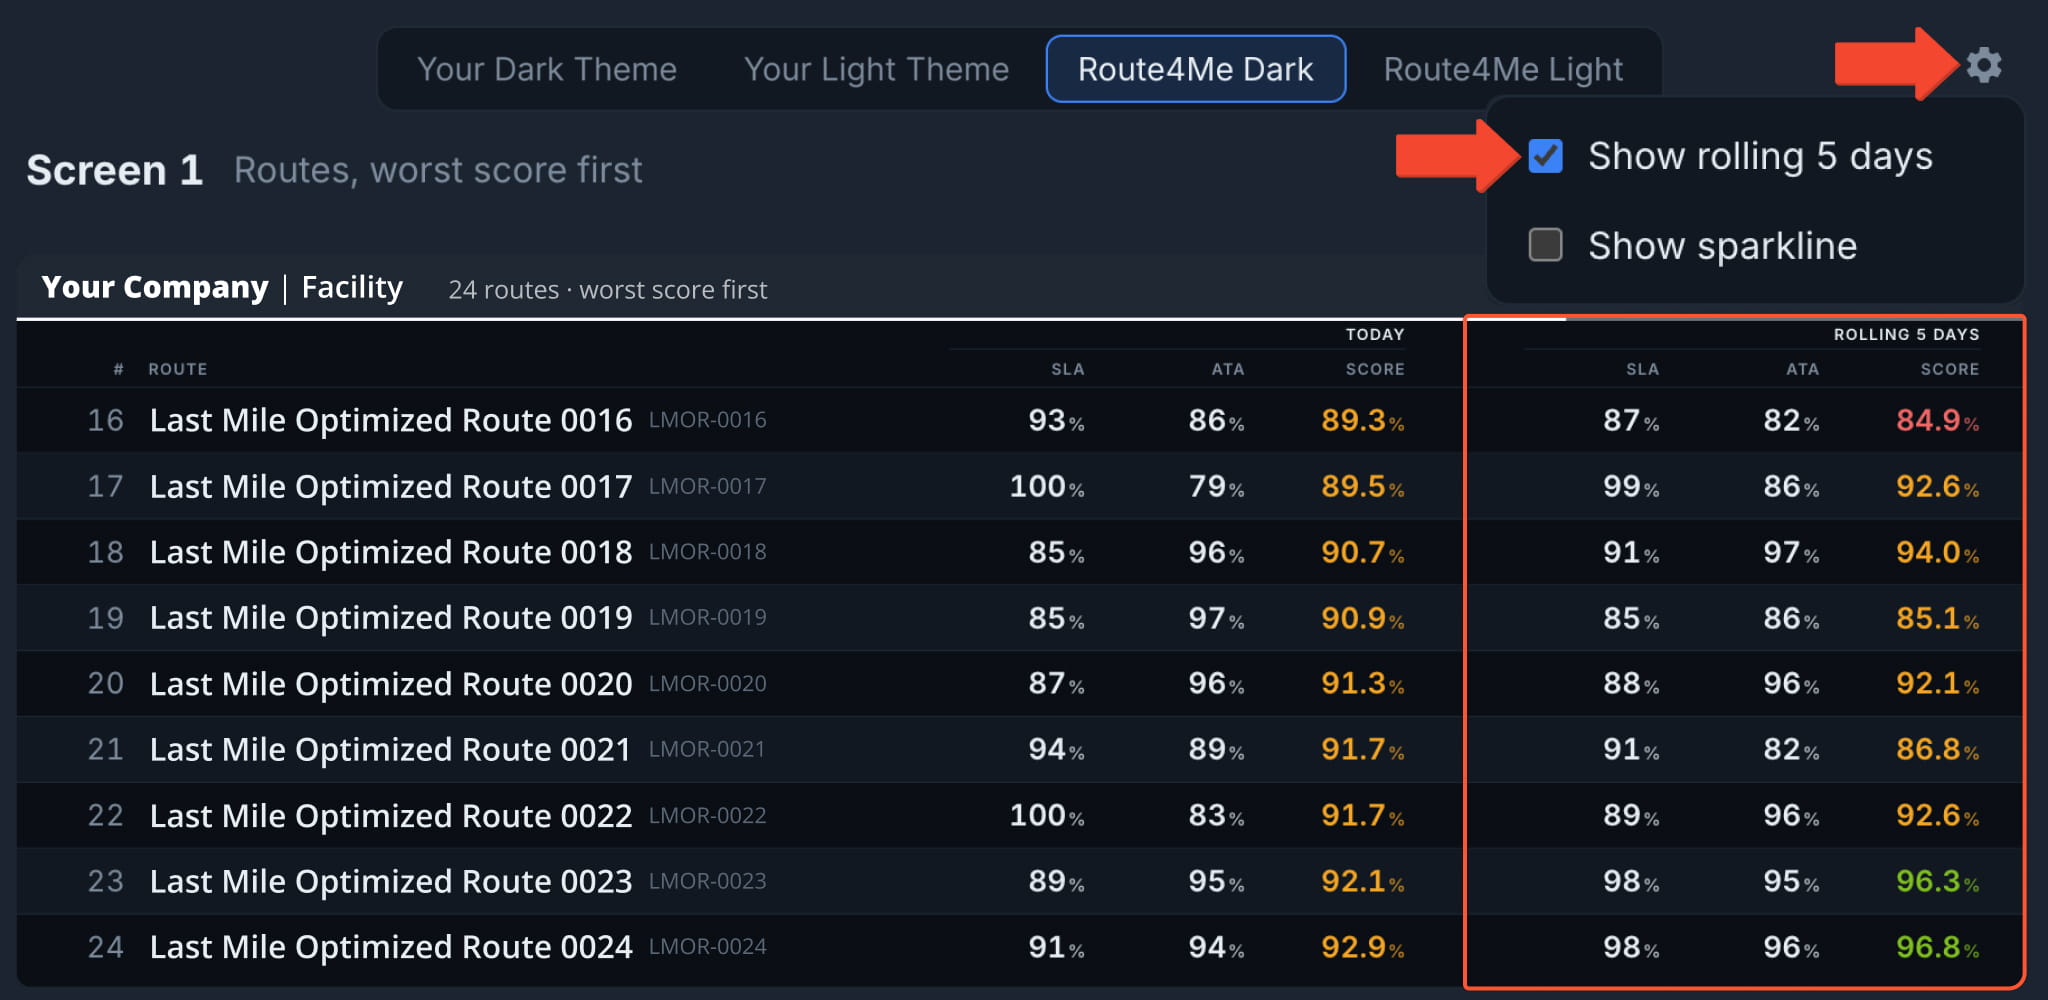
NOTE: The rolling period and the metrics it covers can be customized. For example, you can track a longer or shorter period to match your reporting cycle. Contact Route4Me Support or your routing expert to change it.
SLA & ATA Sparklines – See Performance Trends On Screen 2
To see how SLA and ATA are trending, click the Gear Icon and check “Show sparkline”. A small trend line appears next to the SLA and ATA percentages on Screen 2. The line reflects either per-route or whole depot performance based on your settings.
NOTE: Operational Monitor metrics can be customized for your operations. To do, contact support or your routing expert.
Screen 2 Tracking Level – Whole Depot Or Single Route Data
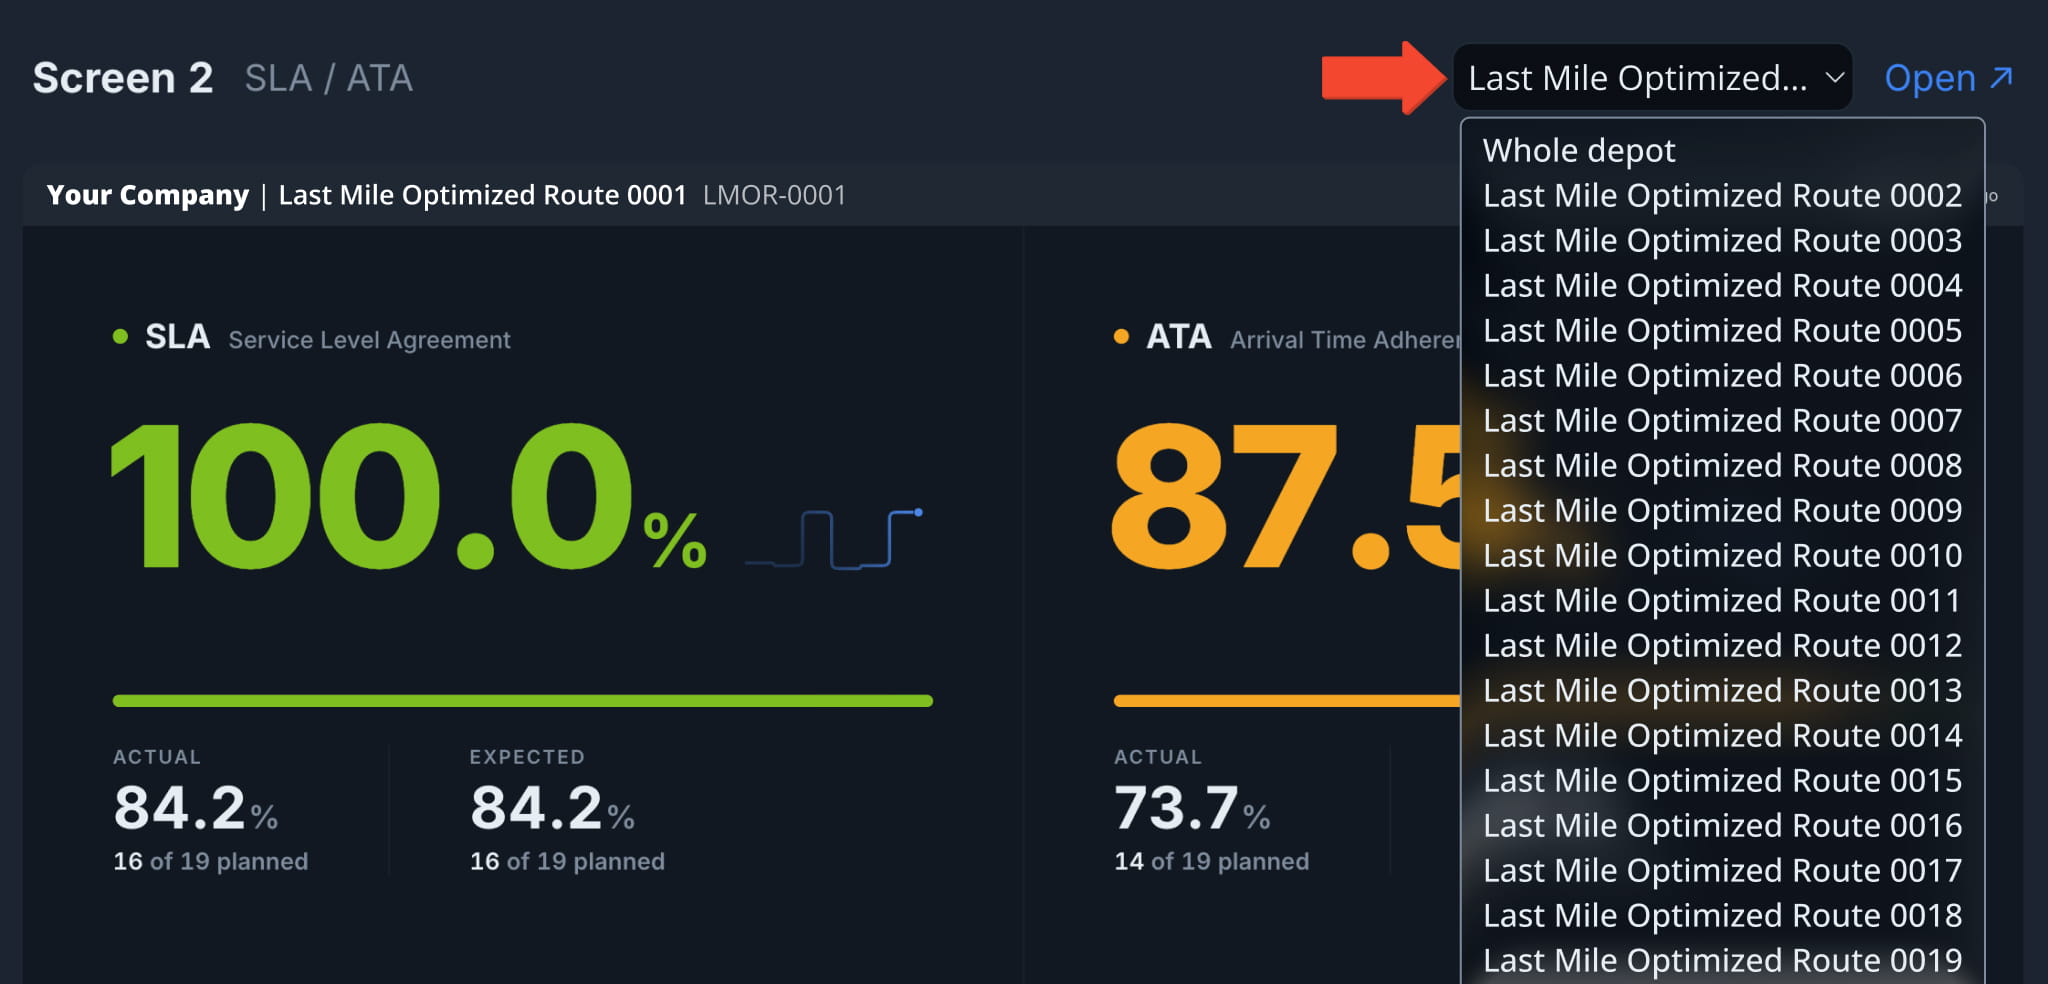
Screen 2 can track SLA and ATA for the “Whole depot” or a single route. To track a route instead, select it from the dropdown next to Screen 2’s “Open” link. The Screen 2 header shows the selected route’s name and ID.
NOTE: Tracking scale can be customized for your operations. To do so, contact Route4Me Support or your routing expert.
Visit Route4Me's Marketplace to Check out Associated Modules:
- Operations
Audit Logging and Activity Stream
- Operations
Custom Data Add-On
- Operations
Advanced Team Management Add-On
About author: Kristian Andreev