Route Optimization ROI Calculator – Calculate Savings And Impact
Many businesses struggle to understand how routing decisions affect cost and day-to-day operations. Route4Me addresses this by turning operational data into structured insights that make performance easier to measure and compare. The Route Optimization ROI Calculator helps estimate the financial impact of improved routing and evaluate whether it delivers a strong return on investment. Learn how the ROI Calculator works and how it supports better planning and decision-making.
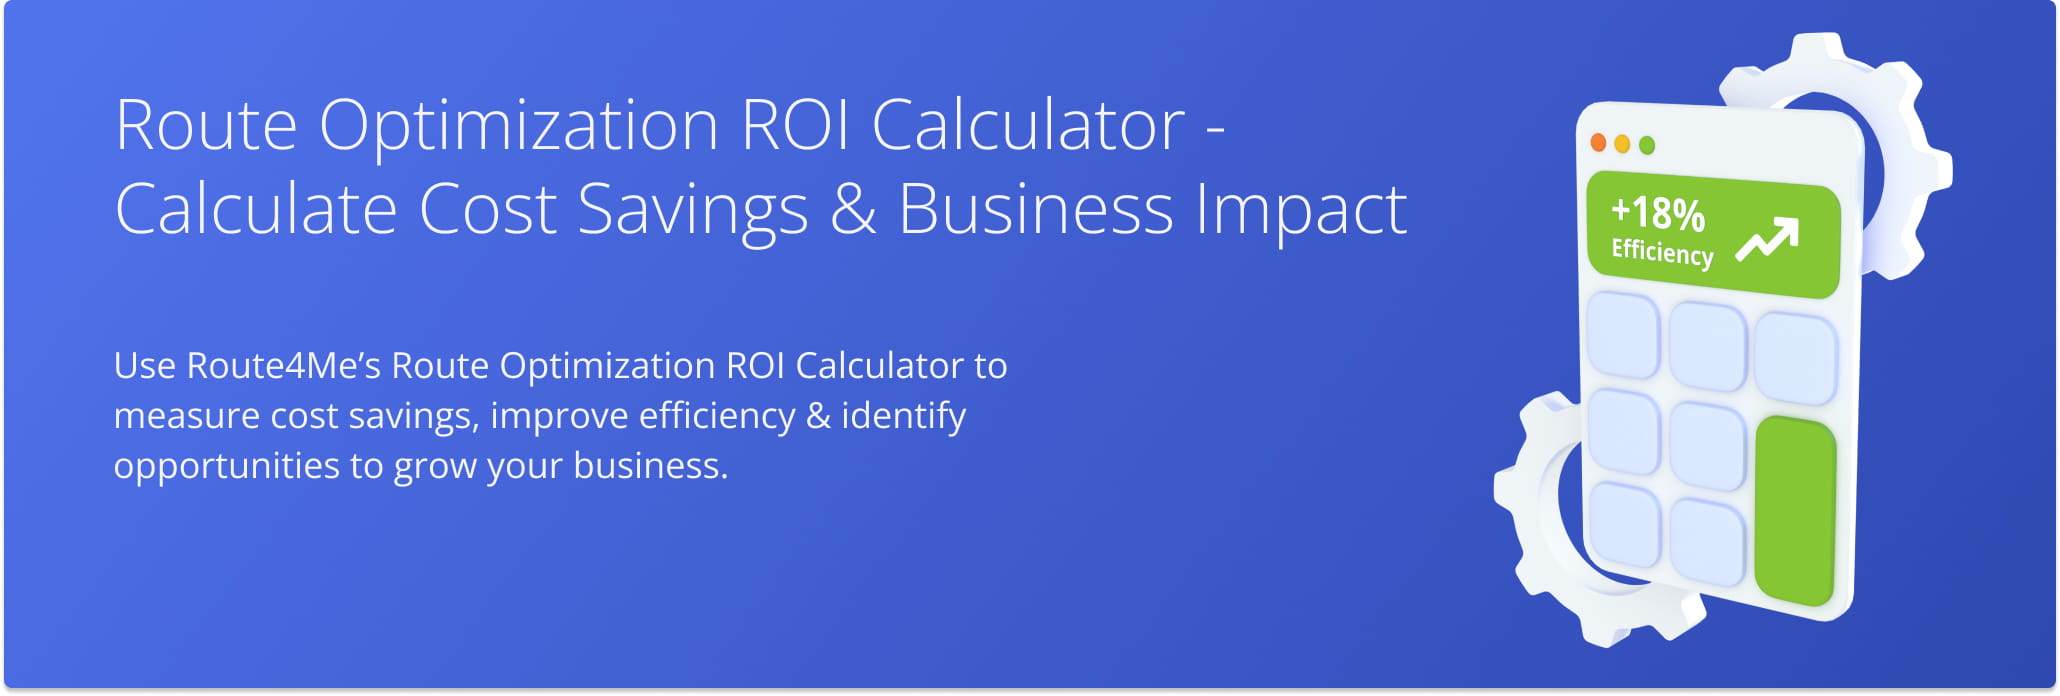
Table of Contents
Measuring The Impact Of Route Optimization – ROI Analysis
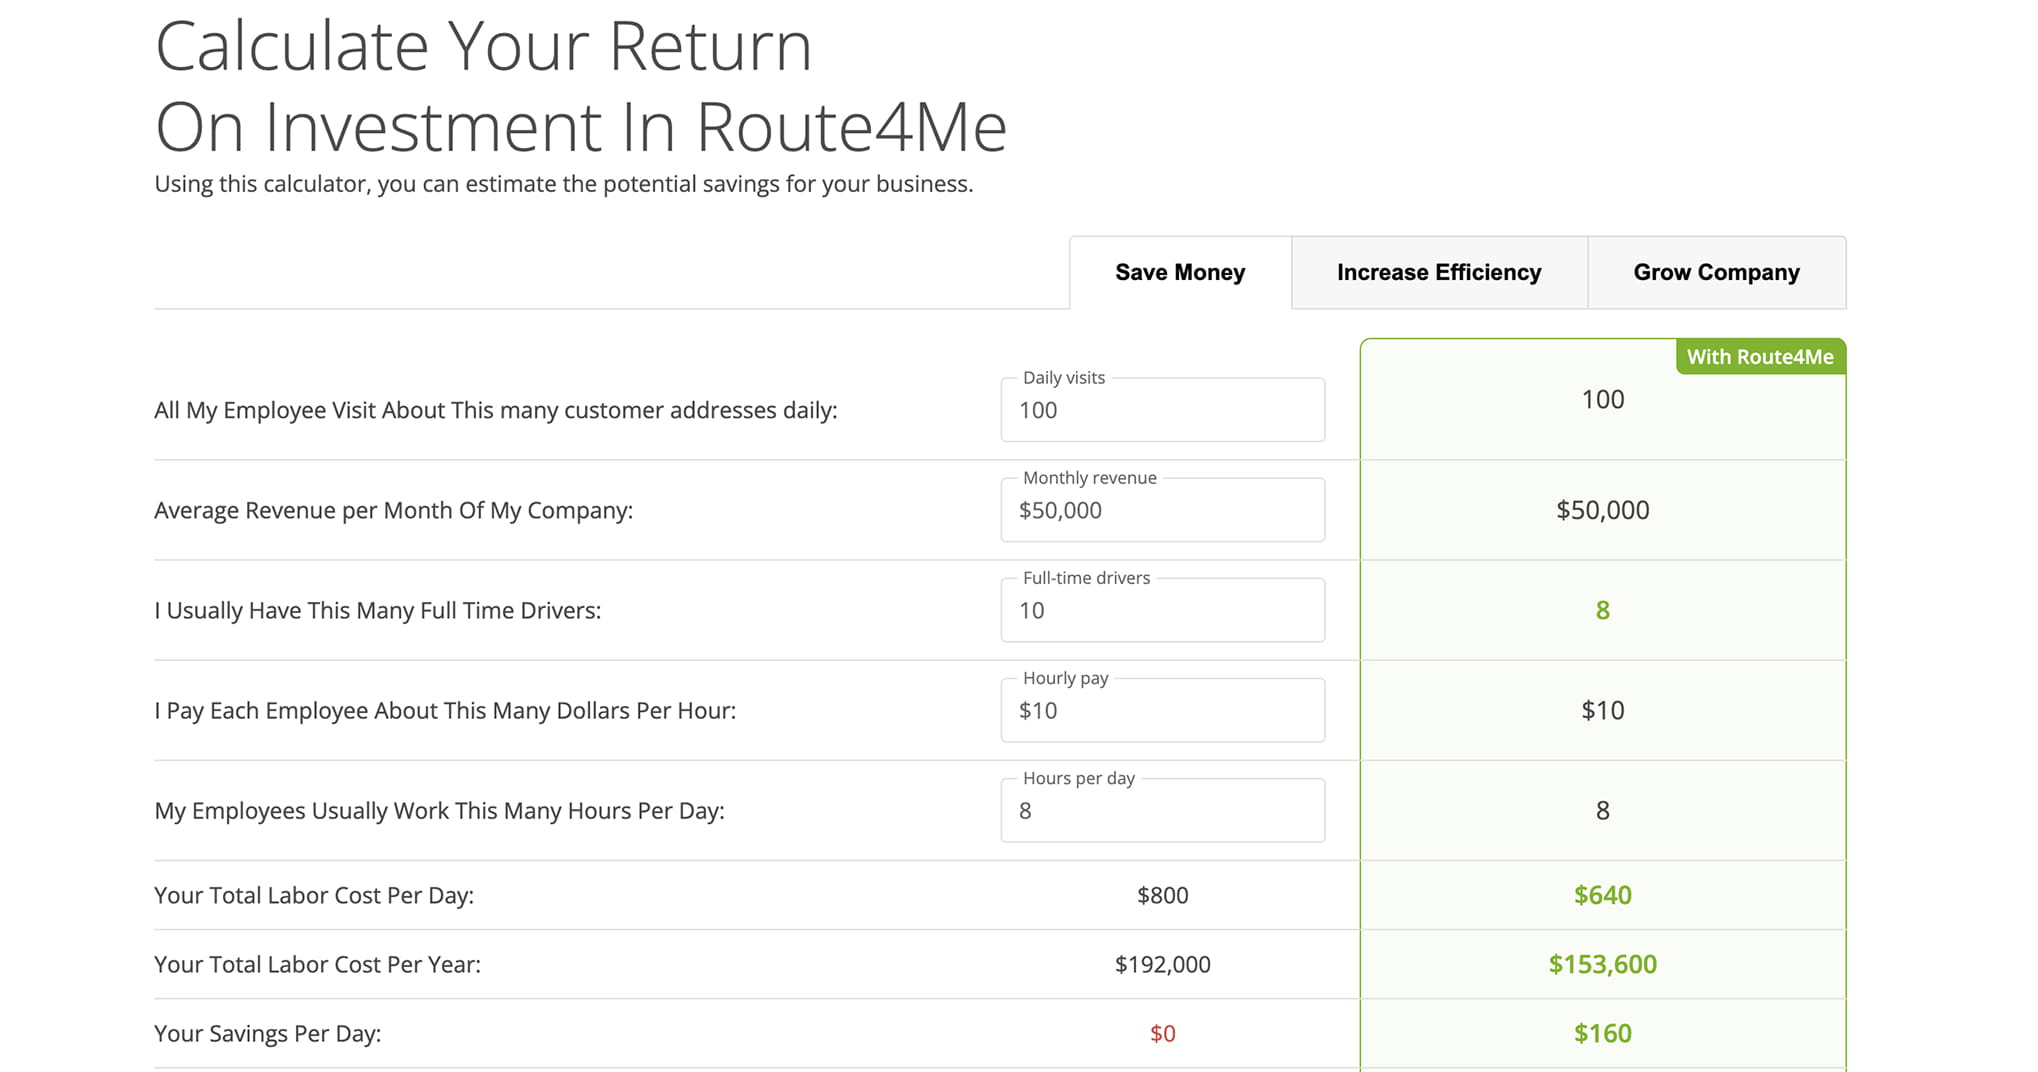
The Route Optimization ROI Calculator estimates the financial impact of route optimization by using key operational data to project potential cost and efficiency improvements. It translates routing performance into measurable ROI outcomes.
These estimates are generated from operational data points, detailed in the table below, and reflect projected ROI outcomes. The results help determine whether route optimization delivers a strong return on investment, not precise financial forecasts.
| Operational Metric | Description |
|---|---|
| Daily Visits | The average number of customer addresses each employee visits per day, reflecting daily route activity levels. |
| Monthly Revenue | The total revenue generated by your business in a typical month, used to estimate the potential revenue impact of route optimization. |
| Number of Full-Time Drivers | The total number of full-time drivers or field employees actively completing routes in your organization. |
| Hourly Pay Per Employee | The average hourly wage for each driver or field employee, used to estimate total labor costs. |
| Hours Per Day Per Employee | The average number of hours each employee works per day, reflecting labor capacity and scheduling assumptions. |
| Total Labor Cost Per Day | The estimated total daily labor expense across all employees based on pay rate and working hours. |
| Total Labor Cost Per Year | The projected annual labor cost calculated from daily operational expenses over time. |
| Savings Per Day | The estimated daily cost reduction achieved through improved route efficiency and optimization. |
| Savings Per Year | The projected annual savings resulting from cumulative daily efficiency gains. |
| Additional Revenue Per Month | The estimated increase in monthly revenue driven by improved operational efficiency and route performance. |
| Additional Revenue Per Year | The projected annual revenue growth resulting from sustained routing improvements. |
Using The ROI Calculator – Driving Savings, Efficiency, And Growth
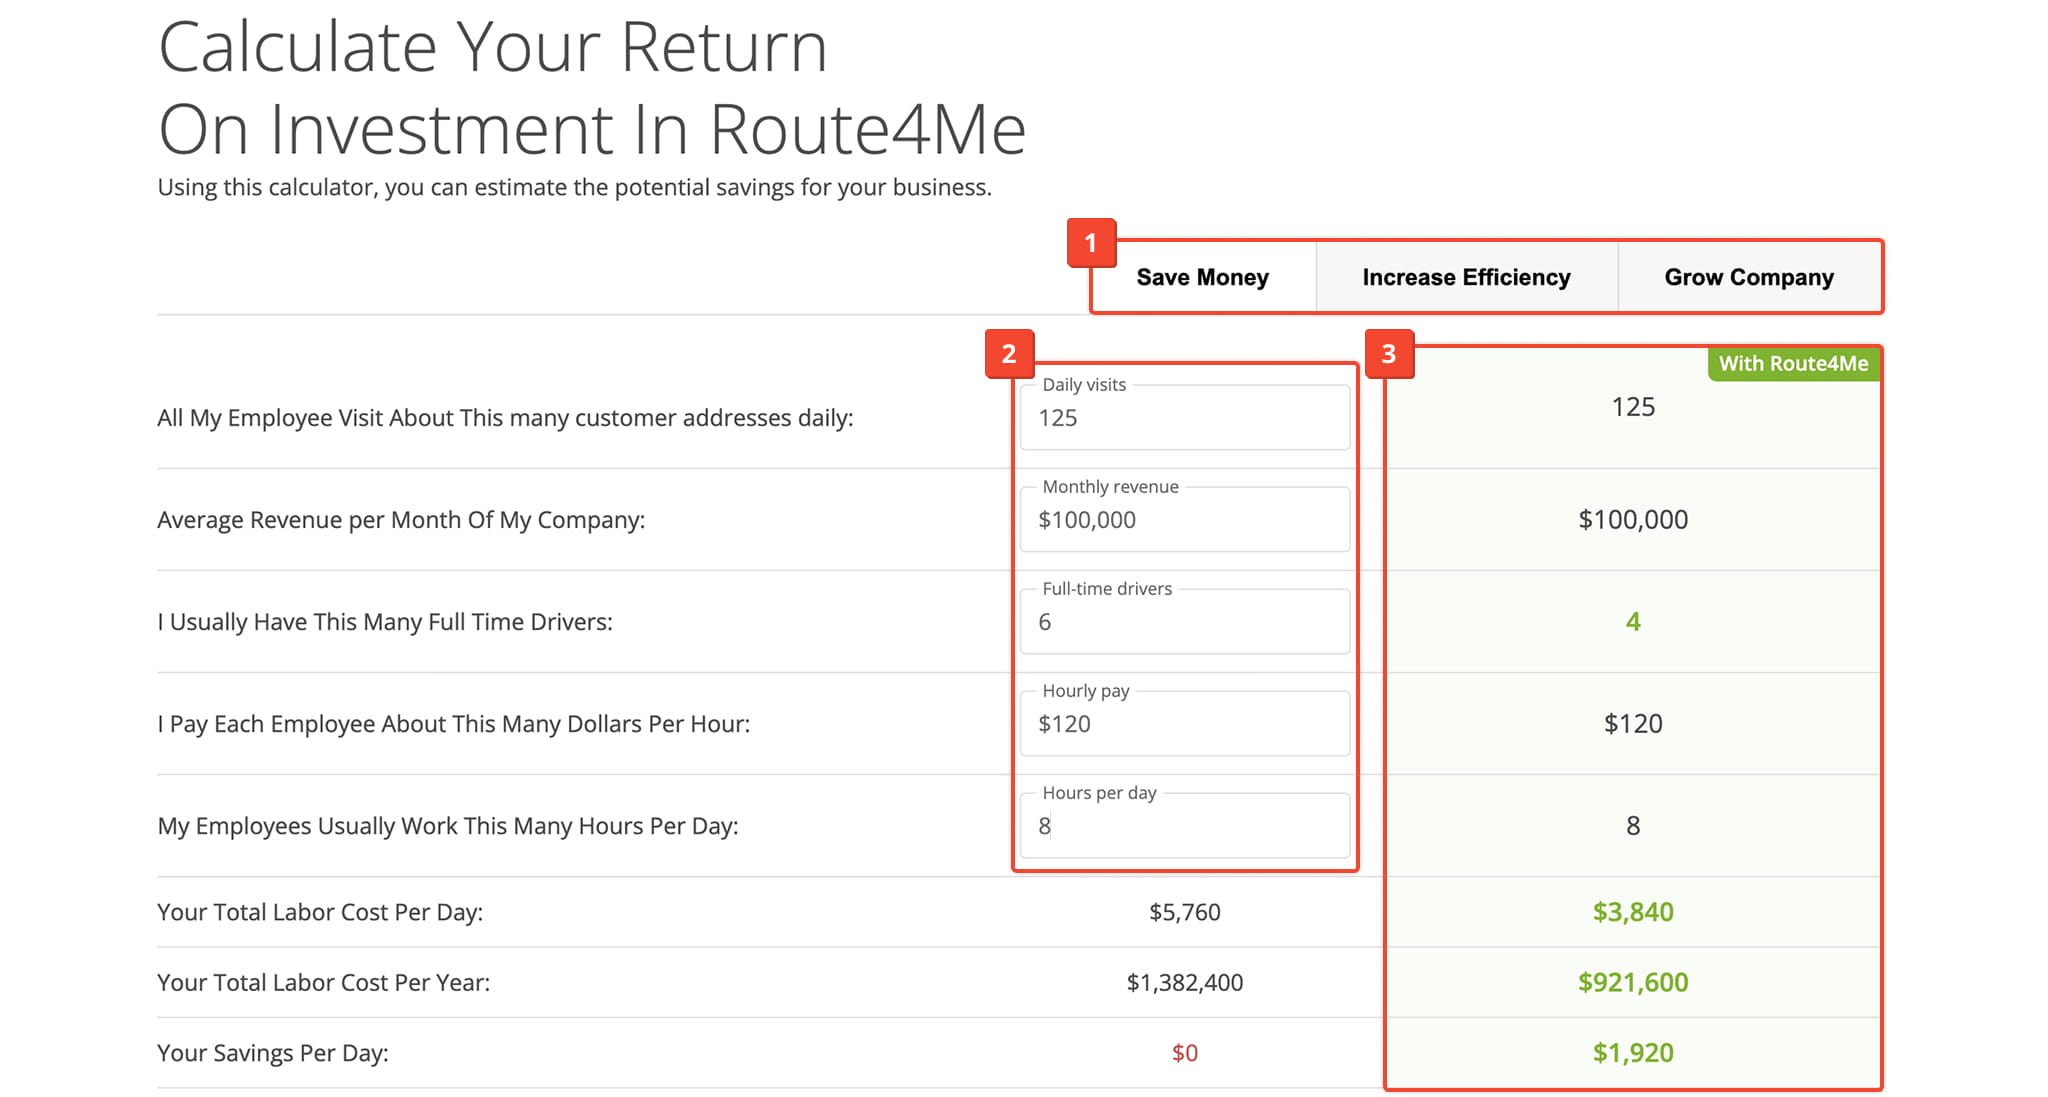
The ROI calculator helps you estimate financial impact across different operational scenarios, organized by business outcome. To use the ROI Calculator:
- Choose a tab based on your objective: “Save Money“,” Increase Efficiency“, or “Grow Your Company“.
- Enter your operational details into the fields to generate your estimate.
- Review the estimated results, which appear in the right-hand column. These estimates show potential savings and operational impact.
The results update dynamically as you enter data, helping you quickly understand whether route optimization is worth the investment based on cost, savings, and revenue impact.
Visit Route4Me's Marketplace to Check Out More Add-Ons and Modules:
- Route Optimization
Address Book and Territories Planning
- Operations
Custom Data Add-On
About author: Daniel Archer
With a background in pedagogy and writing instruction, Daniel is a former tenured English Instructor who, after nearly 20 years of teaching, transitioned into content strategy and leading writing teams for global brands. Now, as Technical Documentation Manager at Route4Me, he translates complex logistics technology into clear, accessible content that empowers users.