Vehicle Snapshot – Customizable Vehicle Analytics Page And Data Summary
Route4Me’s Vehicle Snapshot is an intuitive analytics tool that provides a comprehensive overview of any last-mile fleet vehicle. It combines detailed route analytics, vehicle utilization, and key operational metrics in one place, giving you clear visibility into vehicle performance. With a Vehicle Snapshot, you can track route performance, analyze completed routes and destinations, and monitor operational trends to make informed decisions, optimize fleet utilization, and improve last-mile delivery outcomes.
Table of Contents
Open Vehicle Snapshot – Access Vehicle Data And Analytics Overview
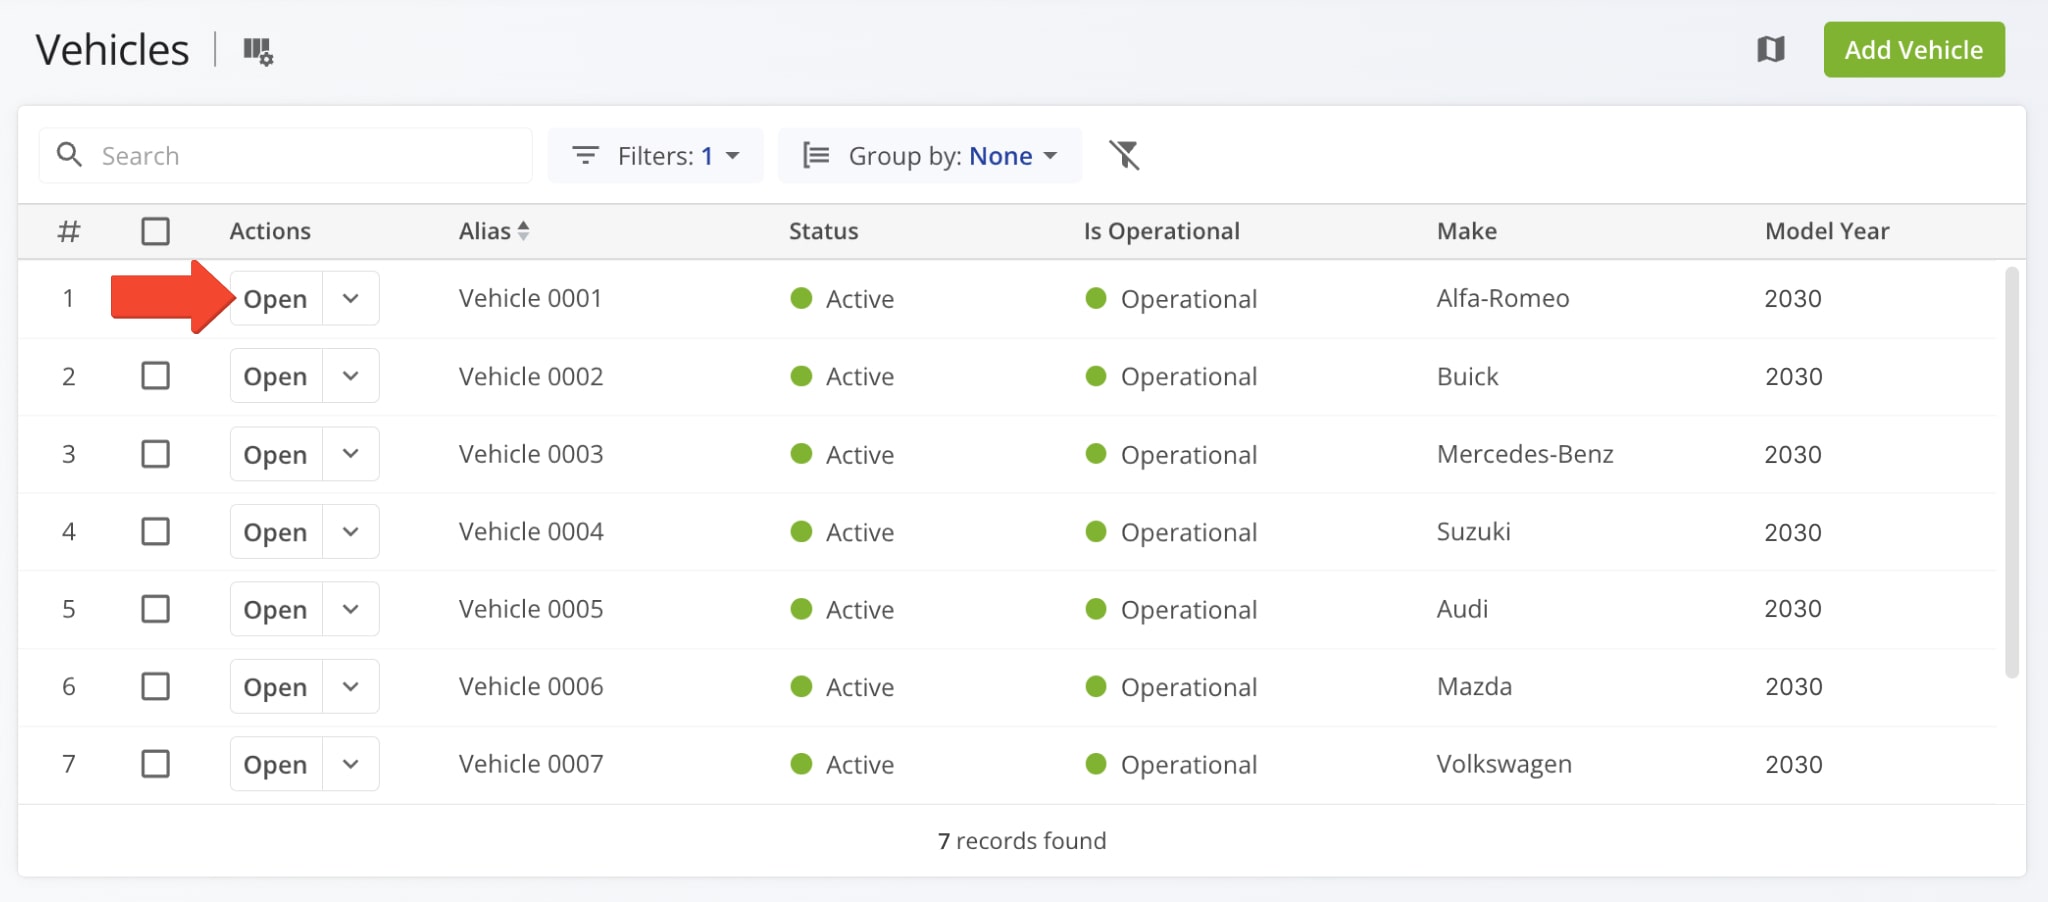
To open the Vehicle Snapshot for any fleet vehicle, select “Team & Equipment” > “Vehicles” from the Navigation Menu to open the Vehicles Page. Then, from the Vehicles Page, click “Open” next to the desired vehicle.
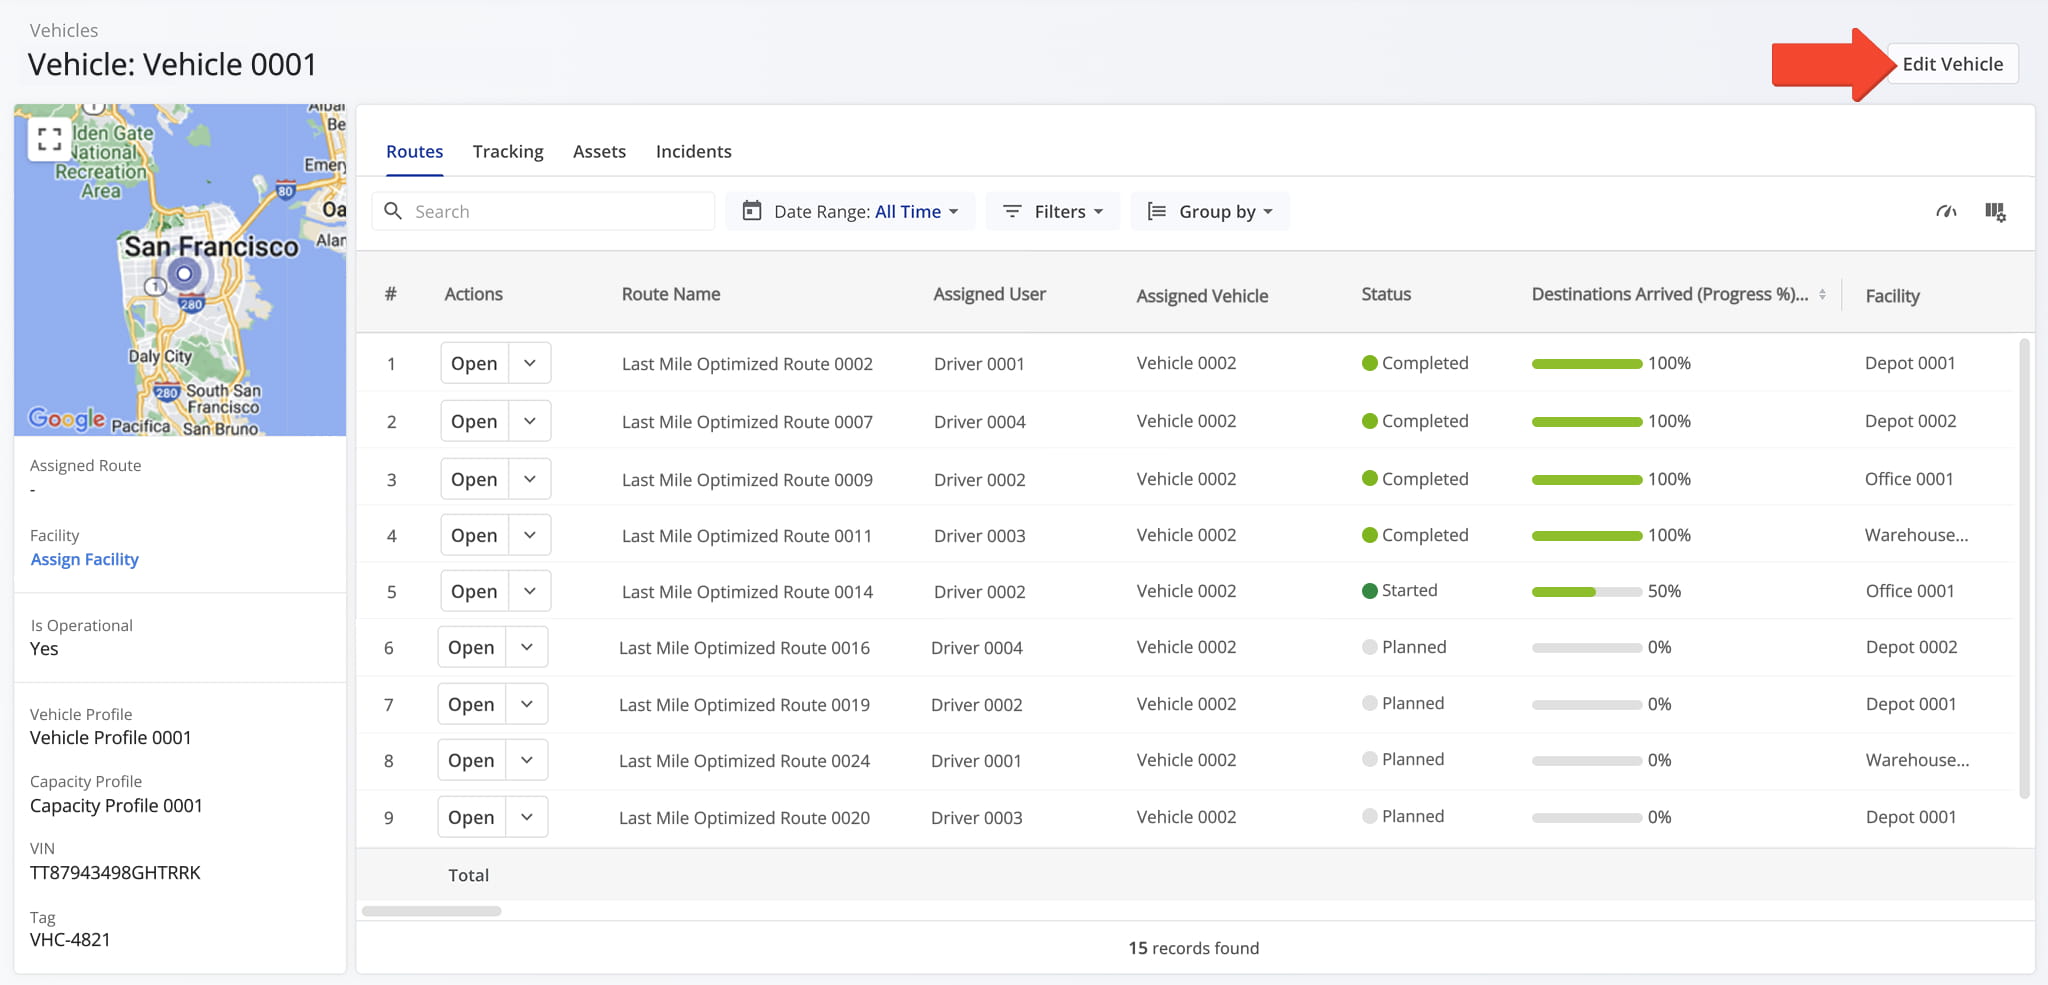
This opens the selected Vehicle Snapshot. From here, you can edit the Vehicle’s details, adjust Vehicle Capacity Profiles, configure commercial truck parameters, and more. To make changes, click the “Edit Vehicle” button.
Vehicle Profile Overview – Location, Details, Performance Metrics
Vehicle Details Summary – Dynamic Map And Vehicle Information Panel
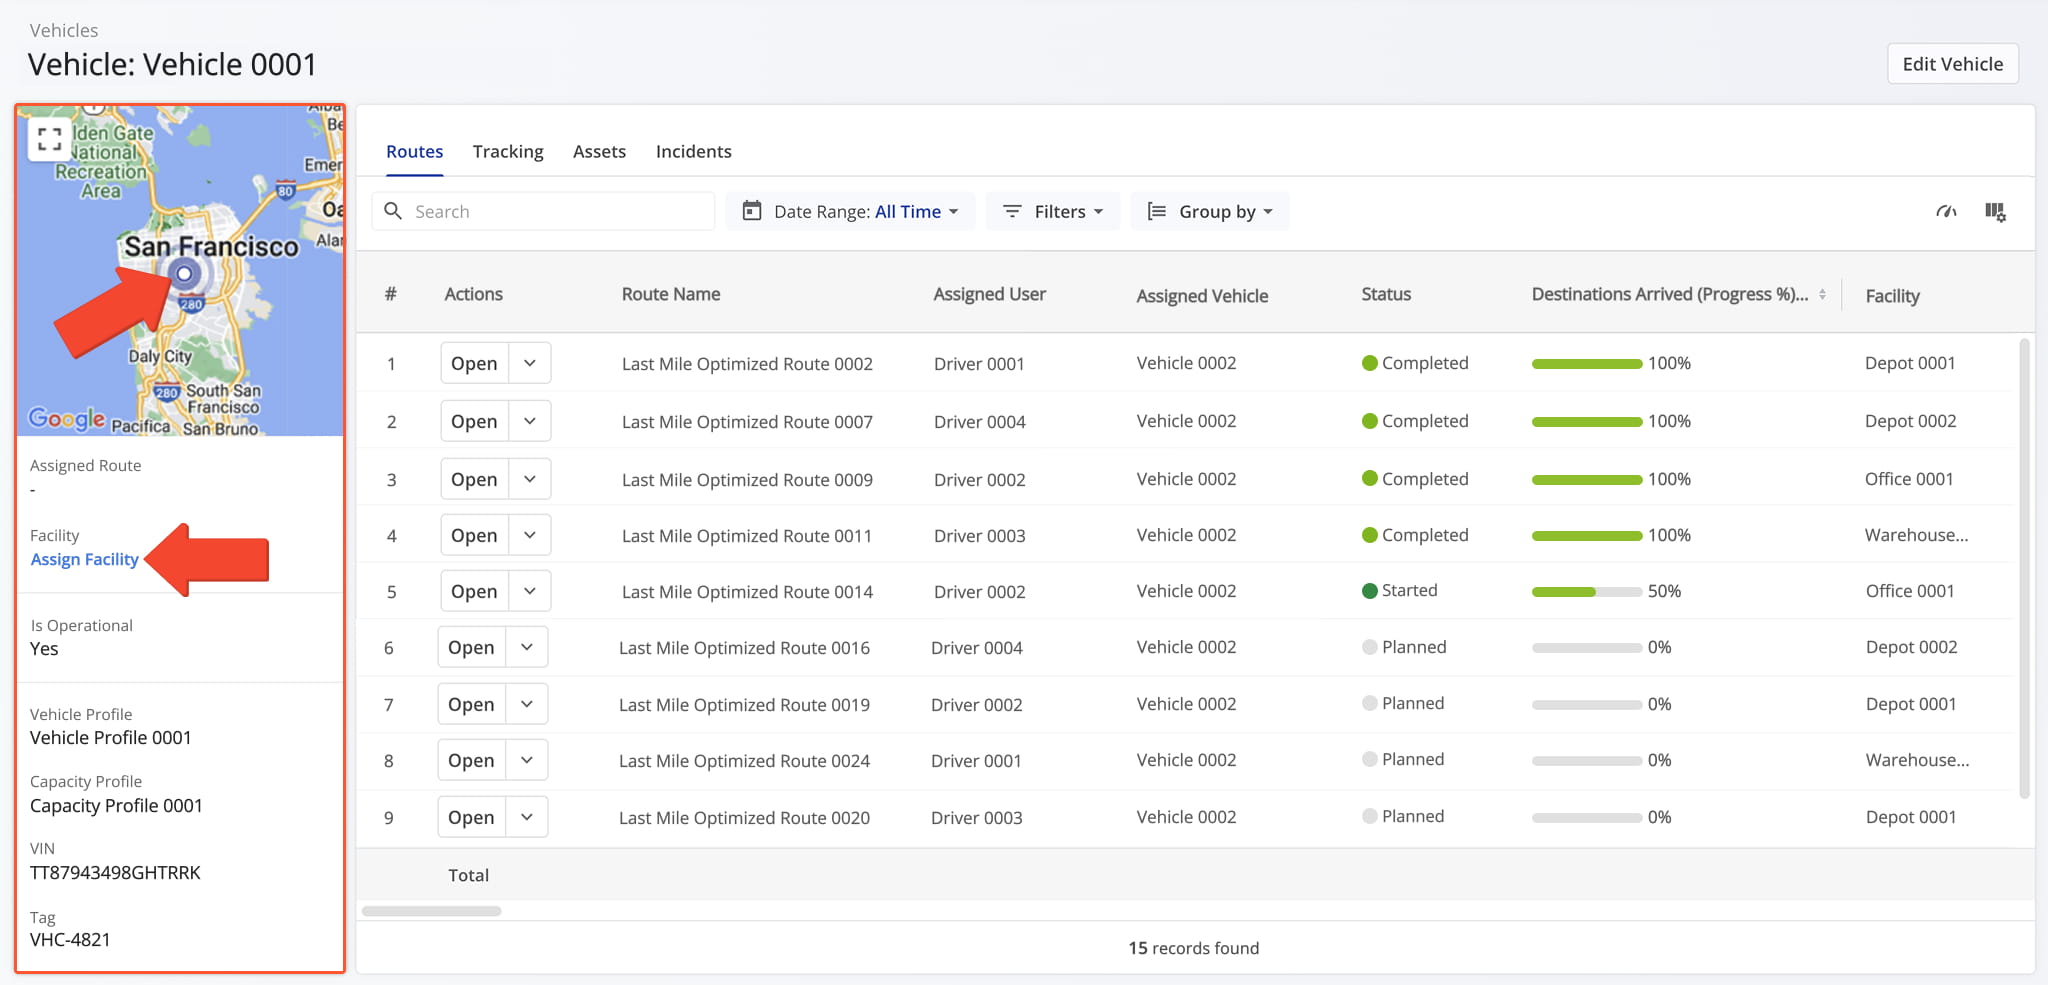
The Vehicle Summary panel displays the Vehicle’s last synchronized location on a dynamic map, along with key details such as assigned routes, Vehicle and Capacity Profiles, and other details.
You can click “Assign Facility” to assign the Vehicle to a last mile facility. If the Vehicle has already been assigned to a Facility, you can edit Facility details or open Facility Snapshots for all assigned Facilities. NOTE: Vehicles can be assigned to multiple Facilities.
Route Performance Metrics Panel – Vehicle Route And Time Performance Overview
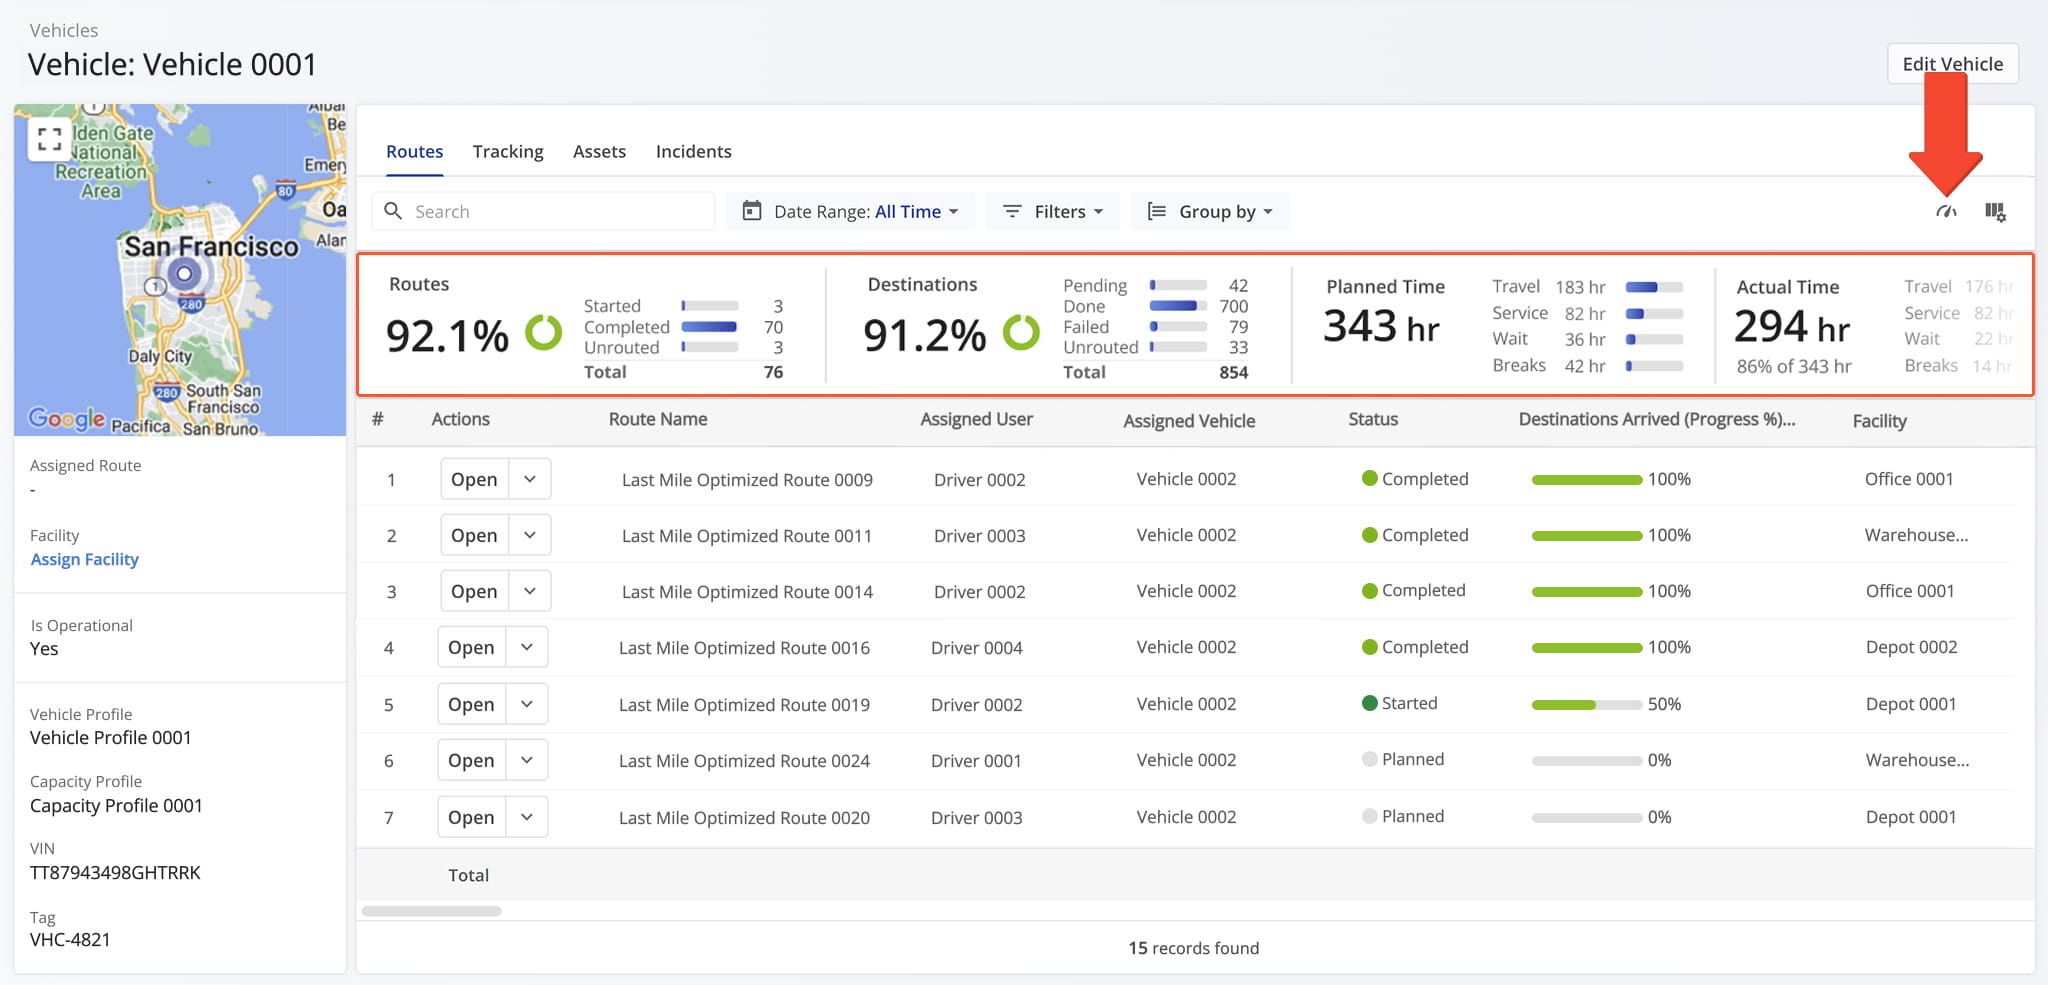
From the “Routes” tab, click the Metrics Icon in the upper-right corner to open the Vehicle’s Route Performance Metrics panel, where you can monitor progress, track efficiency, and evaluate the Vehicle’s operational performance across routes.
This panel provides a summary of the vehicle’s planned routes and destinations, along with a side-by-side breakdown of planned and actual time for travel, service, wait, and breaks.
Vehicle Snapshot Categories – Vehicle Data Tabs
The Vehicle Snapshot is organized by tabs, each corresponding to a specific category of associated data, described below.
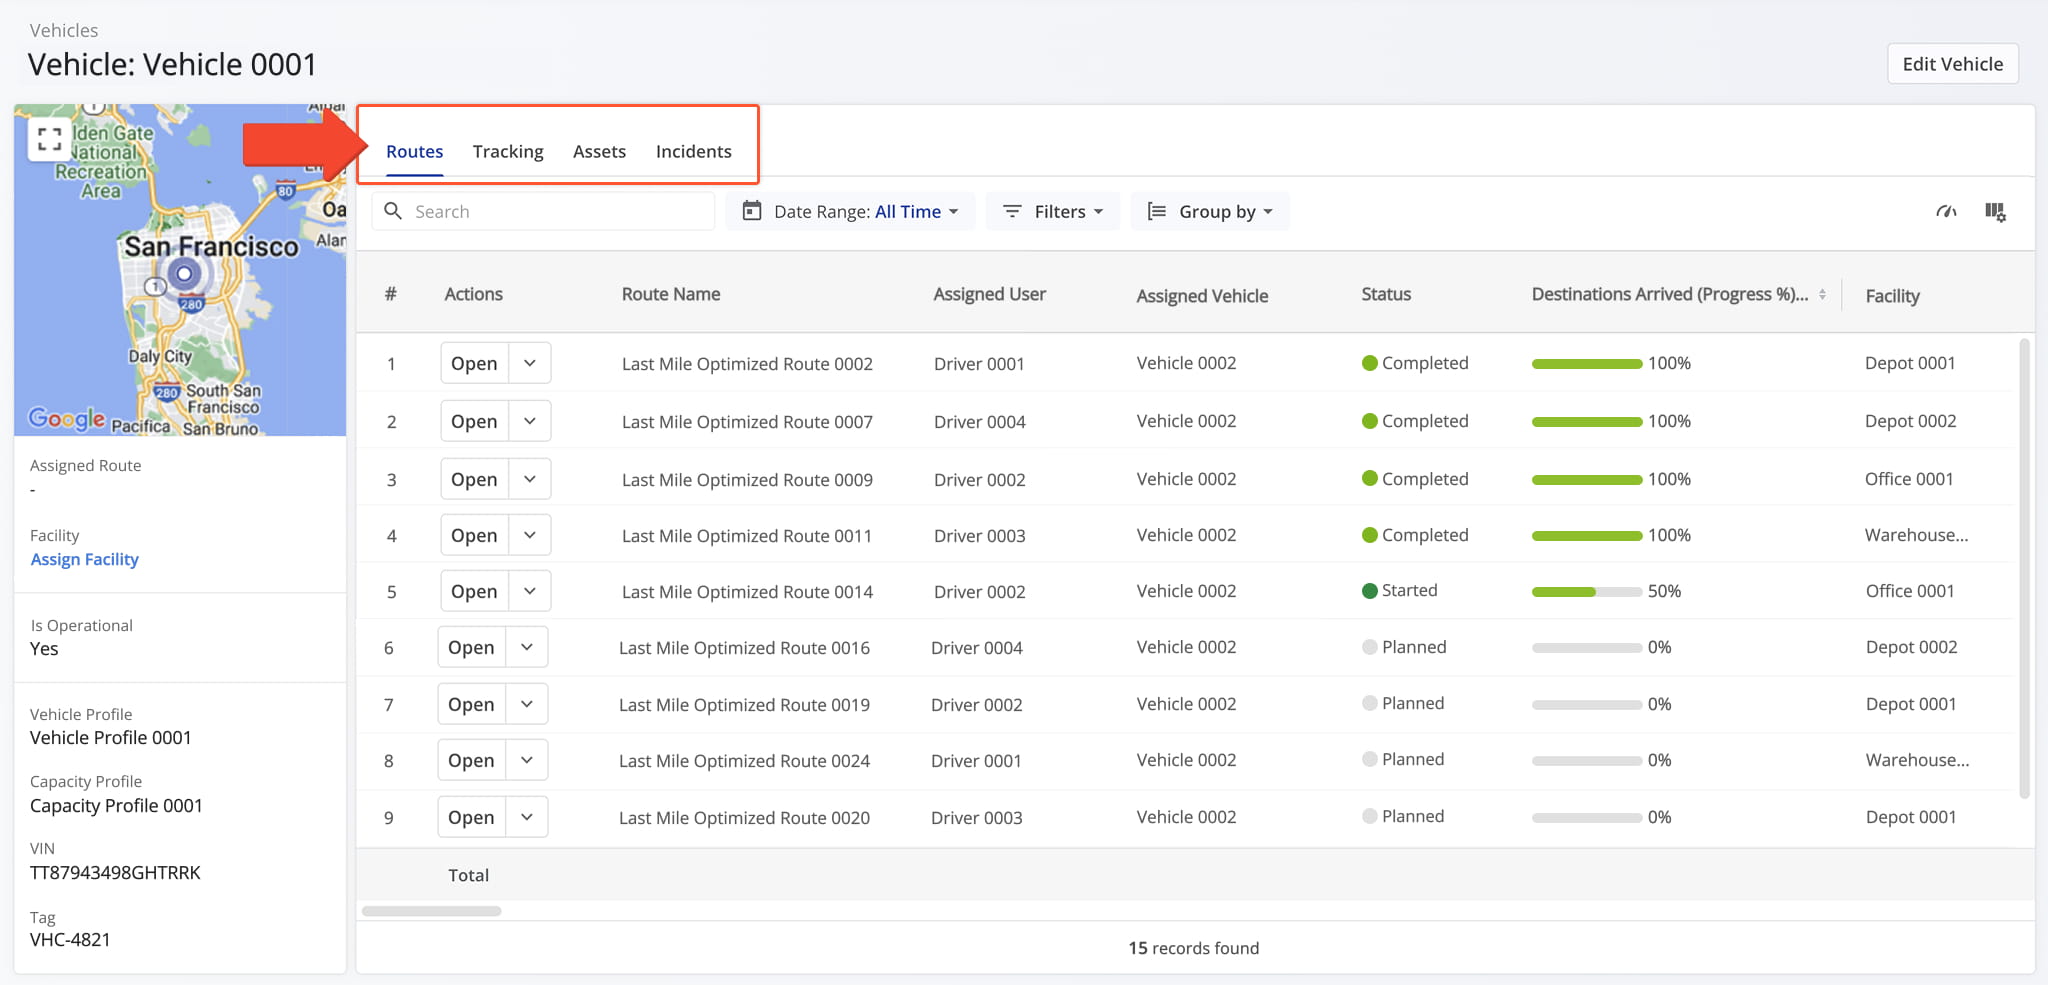
Routes Tab – Assigned Routes And Route Data Overview
By default, the “Routes” tab opens when you access a Vehicle Snapshot, displaying all routes assigned to the Vehicle in a customizable data table. The route data is consistent with what appears on the Routes Page.
From the Routes tab, you can perform the following actions for each route associated with the Vehicle:
- Use the Search field to locate routes associated with the Vehicle.
- Filter routes by Date Range, Group By, or Filter options, as described in the table below.
- Click “Open” next to a route to access its Route Snapshot.
- Click the Down Arrow button to modify the route in the Route Editor or assign the route to a facility.
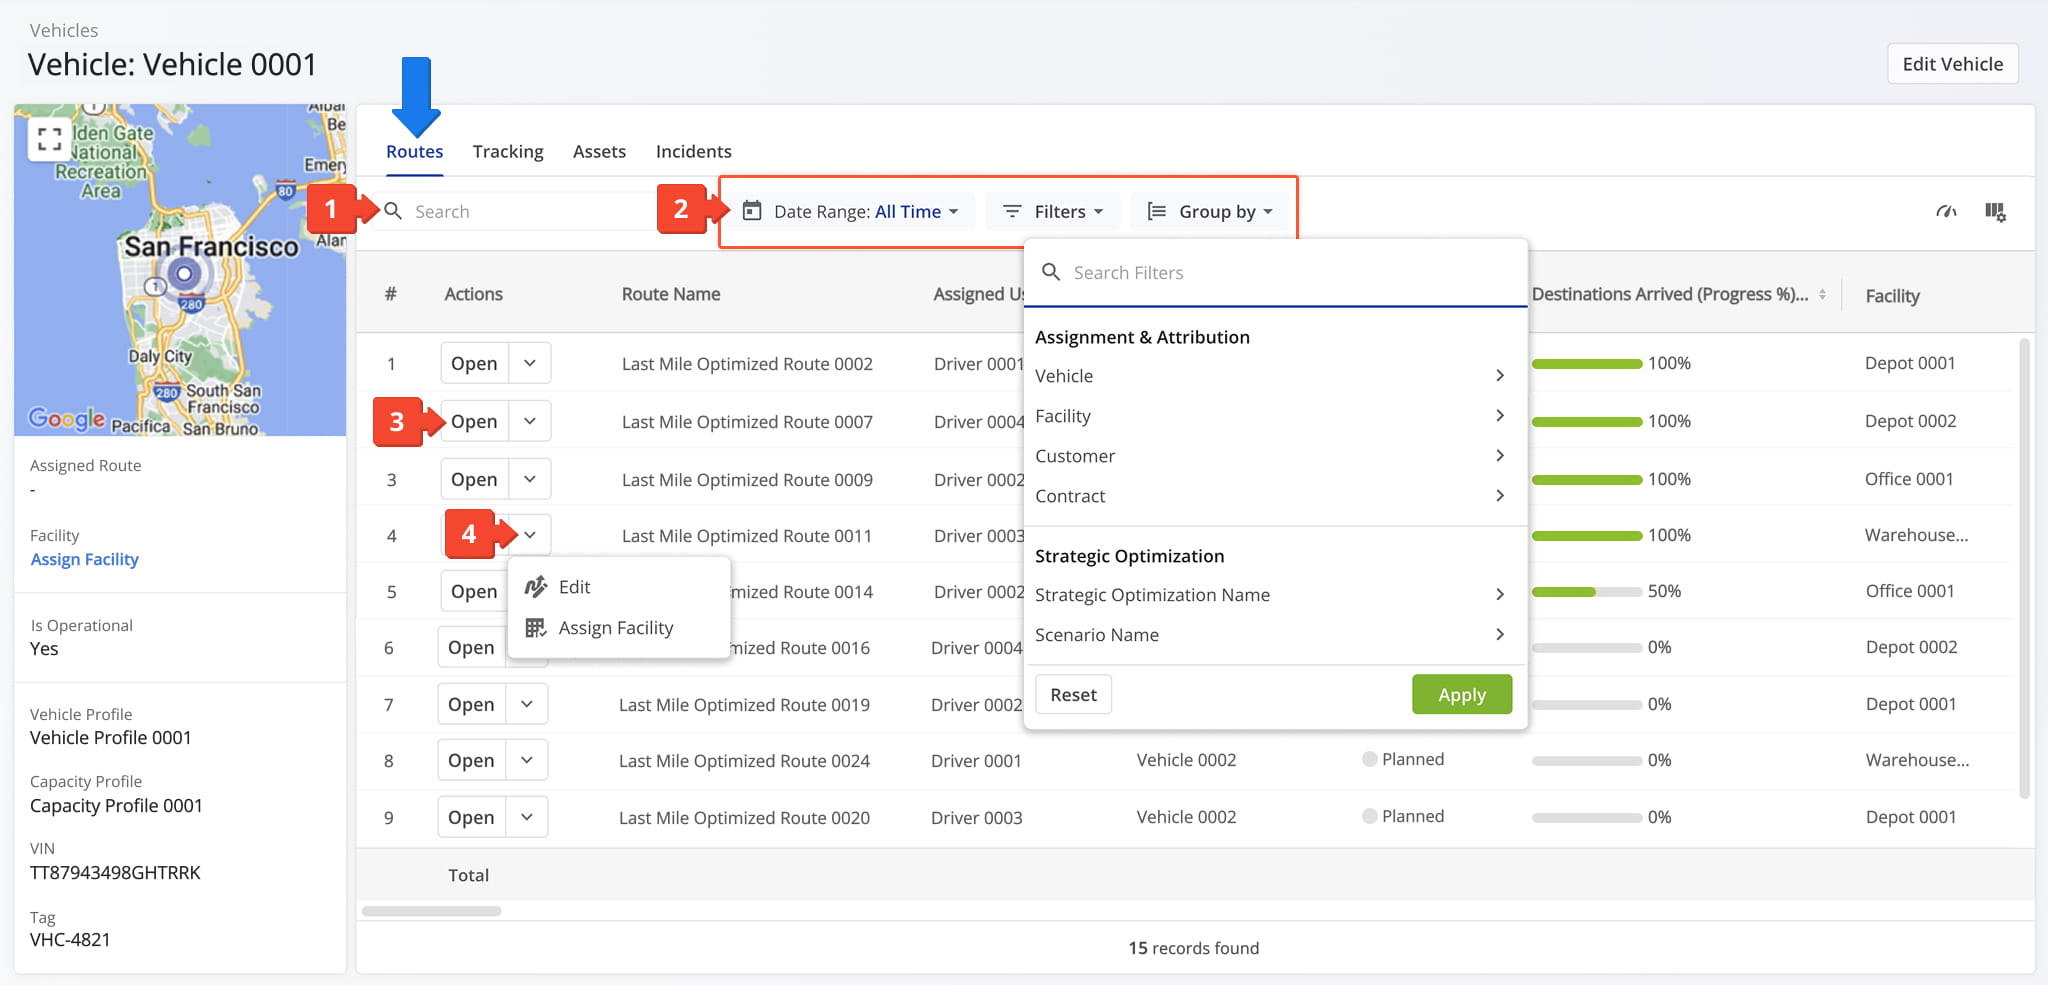
Vehicle Snapshot – Routes Tab Filters
Vehicle
Filter by vehicle assigned to the route.
Facility
Filter by facility linked to the route.
Customer
Filter by customer linked to the route.
Contract
Filter by contract linked to the route.
Strategic Optimization Name
Filter by the name of the strategic optimization used to generate or modify the route.
Scenario Name
Filter by the scenario applied during strategic route planning.
Status
Filter by the current progress or completion state of the route (e.g., Planned, Scheduled, Started, Completed).
Planned Total Route Duration (h)
Filter by the total estimated duration, in hours, planned for completing the route.
Planned Total Distance (mi)
Filter by the total planned distance, in miles, for completing all stops on the route.
Destinations Arrived (Progress %) (User Actioned)
Filter by the percentage of planned destinations the driver has arrived at.
Destinations Count
Filter by the total number of destinations assigned to the route.
Pending Destinations
Filter by destinations not yet started or completed by the driver.
Failed Destinations
Filter by destinations marked as failed due to inability to complete service.
Skipped Destinations
Filter by destinations the driver intentionally skipped or bypassed.
Completed Destinations
Notes Count
Filter by number of notes added to the route by users or automated processes.
Destinations Arrived Late (User Actioned)
Filter by destinations where the driver arrived after the scheduled time window.
Destinations Arrived Early (User Actioned)
Filter by destinations where the driver arrived earlier than the scheduled time window.
Destinations Arrived On Time (User Actioned)
Filter by destinations where the driver arrived within the scheduled time window.
Out of Sequence Destinations (#)
The number of destinations visited in an order different from the planned sequence.
Actual Total Distance (Mobile App) (mi)
Total distance in miles recorded by the mobile app during the route.
Actual Total Distance (Telematics)
Total distance in miles recorded from the assigned vehicle’s telematics device.
Planned
Filter by total planned Pieces (units) amount of all Destinations on the planned route.
Completed
Filter by total number of completed pieces or units.
Completed (%)
Filter by percentage of pieces or units completed.
Remaining At End (%)
Filter by percentage of pieces or units still remaining when the route ended.
Planned
Filter by total planned Weight amount of all Destinations on the planned route.
Completed
Filter by total weight completed across all serviced destinations.
Completed (%)
Filter by percentage of planned weight completed.
Remaining At End (%)
Filter by percentage of planned weight still remaining at the route’s end.
Planned
Filter by total planned Cube (volume) amount of all Destinations on the planned route.
Completed
Filter by total cubic volume completed across all serviced destinations.
Completed (%)
Filter by percentage of the planned volume completed.
Remaining At End (%)
Filter by percentage of planned volume remaining at the route’s end.
Planned
Filter by total revenue to be generated from servicing all route Destinations.
Completed
Filter by total revenue generated from the Destinations completed on the route.
Completed (%)
Filter by percentage of planned revenue achieved.
Remaining At End (%)
Filter by percentage of revenue still unfulfilled at route end.
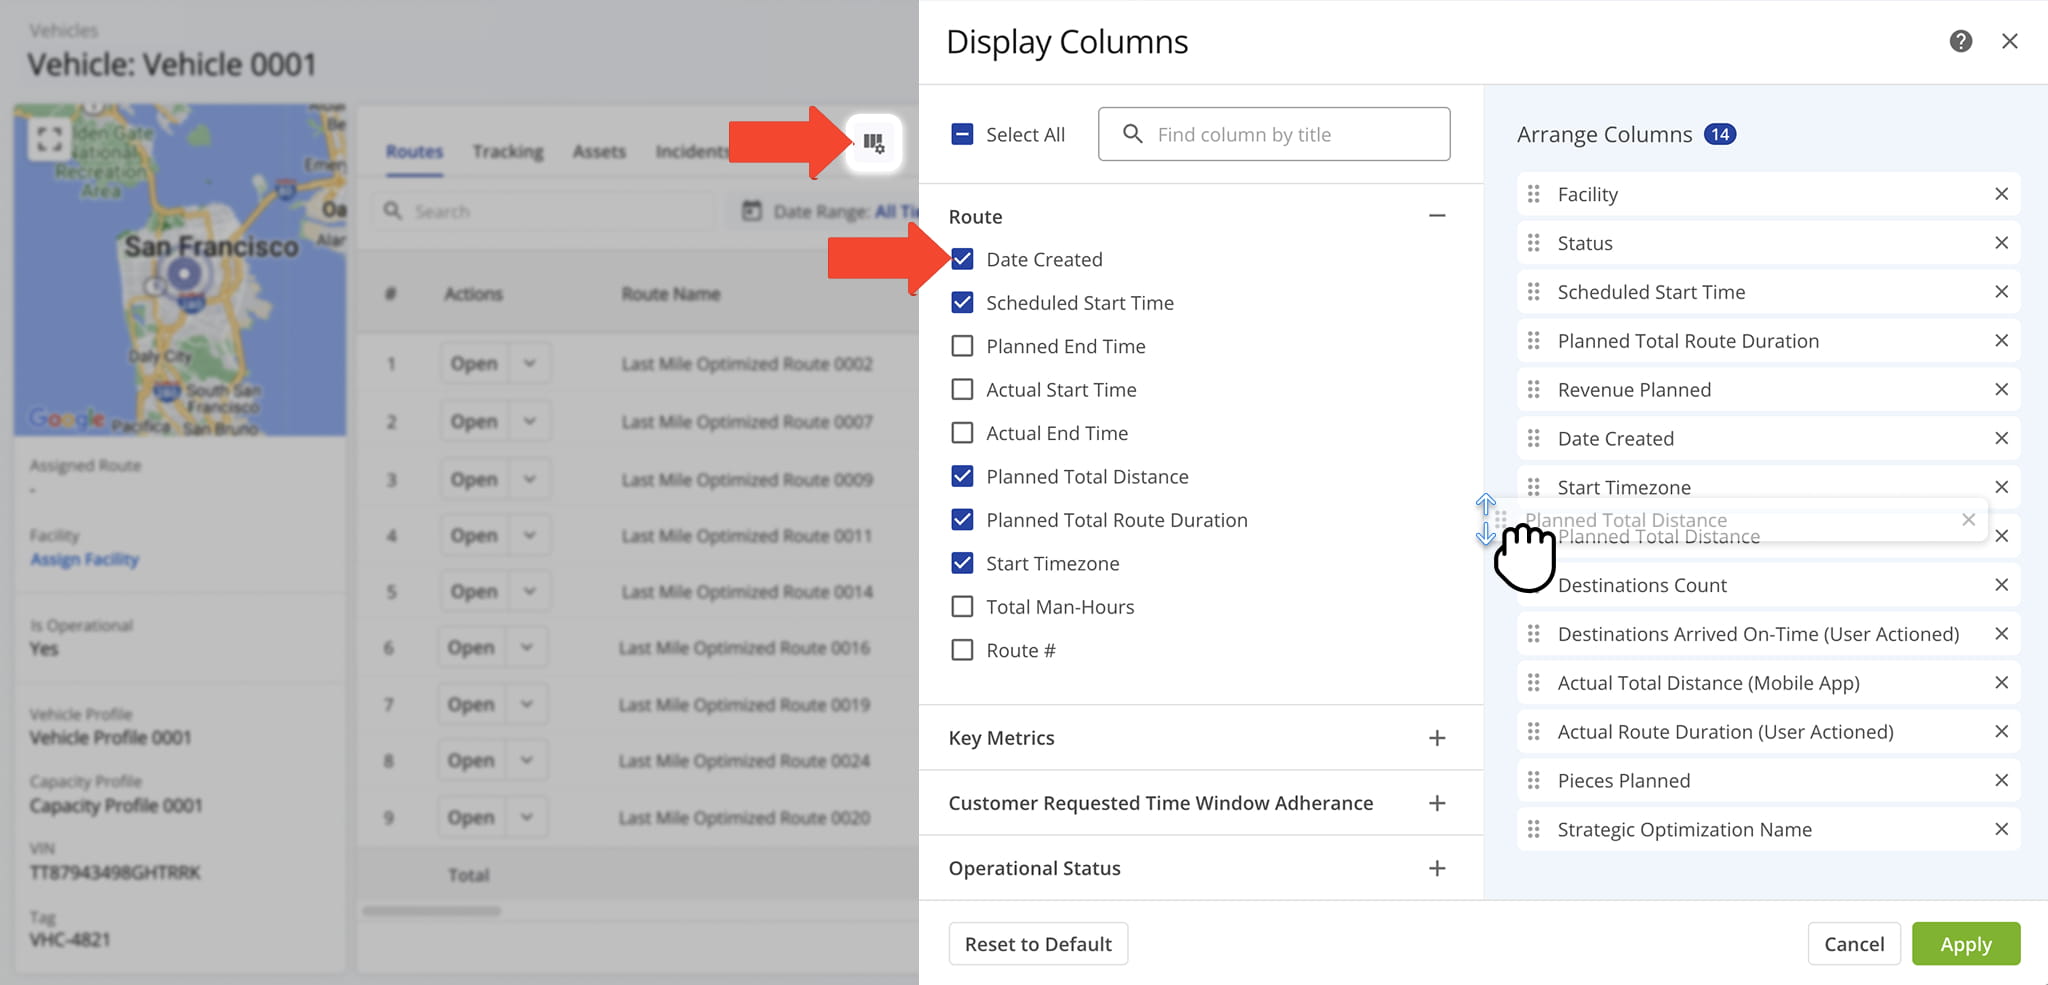
You can also customize the data displayed in the table. Click the Column Icon to select which route data fields appear and adjust their order to suit your operational needs.
The table below provides an overview of all available data columns, which you can reorder by dragging them into place.
Vehicle Snapshot – Routes Tab Data Columns
Date Created
Date and time when the route was created.
Scheduled Start Time
Scheduled start time for the route.
Planned End Time
Planned end time for the route.
Actual Start Time
Time when the route actually started.
Route Total Distance
Total distance planned for the route, including all stops.
Planned Total Route Duration
Estimated total duration for completing the route.
Start Time Zone
Timezone of the route’s start location.
Total Man Hours
Total estimated working hours for completing the route.
Route #
The route number. This is relevant when you are exporting multiple routes.
Destinations Count
Total number of destinations planned for the route.
Pending Destinations
Number of destinations not yet visited.
Failed Destinations
Number of destinations that could not be completed.
Skipped Destinations
Number of destinations intentionally skipped.
Completed Destinations
Number of destinations successfully completed.
Notes Count
Total number of notes added to the route by users or automated processes.
Route Start Odometer
The vehicle odometer reading at the beginning of the route.
Route End Odometer
The vehicle odometer reading at the completion of the route.
Route Start Engine Hours
The engine hour meter reading recorded at the beginning of the route.
Route End Engine Hours
The engine hour meter reading recorded at the completion of the route.
Destinations Arrived On-Time (User Actioned)
Destinations where arrival matched the scheduled time, based on user input.
Destinations Arrived Early (User Actioned)
Destinations reached earlier than scheduled, based on user input.
Destinations Arrived Late (User Actioned)
Destinations reached later than scheduled, based on user input.
First Access Time
Date and time the route was first viewed by a user.
Status
Current progress or completion status of the route.
Dispatch
Indicates whether the route has been assigned to a driver or team.
Arrived Destinations (User Actioned)
Number of destinations marked as arrived by user actions.
Destinations Arrived (Progress %) (User Actioned)
Percentage of destinations completed, based on user input.
Actual Total Distance (Mobile App)
Total distance traveled, recorded by the mobile app.
Actual Total Distance (Telematics)
Total distance traveled, recorded by telematics.
Actual Total Distance (Merged)
Combined distance from mobile app and telematics data.
Actual Route Duration (User Actioned)
Actual Route Duration is calculated based on the received Mobile App GPS data. Duration is measured from when the route was started to when the route was ended by the assigned User on the Mobile App.
Actual Total Route Duration (Grand Total of All Sub-Durations)
The total time spent traveling the route, including all individual segments and stop durations.
Actual Total Travel Duration (User Actioned)
The total time spent traveling the route, recorded from driver actions in the Mobile App.
Actual Total Service Duration (User Actioned)
The total time drivers spent servicing stops, recorded from actions in the Mobile App.
Actual Total Wait Duration (User Actioned)
Total amount of time that a driver spent being inactive while driving the route (i.e., a route started before the opening hours and a driver had to wait, a driver arrived at the address before the opening of the Time Window, etc.).
Actual Total Break Duration
The total duration of all scheduled breaks for the route, calculated based on the planned stops and route schedule.
Actual Total Unattributed Duration
Time not attributed to driving, service, or breaks.
Actual Total Service Time (Auto Detected)
The total amount of the average Service Time of all destinations on the route.
Actual Total Duration (Mobile App)
Total duration of route recorded via the mobile app.
Actual Total Duration (Telematics)
Total duration of route recorded via telematics.
Planned Route Duration
Estimated total route duration.
Planned Total Travel Duration
Estimated driving time for the route.
Planned Total Wait Duration
Estimated total wait time during the route.
Planned Total Service Duration
Estimated total service time at destinations.
Planned Total Break Duration
Estimated total driver break time.
Out of Sequence Destinations (#)
The number of destinations visited in an order different from the planned sequence.
Out of Sequence Destinations (%)
The percentage of destinations visited in an order different from the planned sequence.
Facility
The depot, warehouse, or starting point used for planning the route; serves as the origin for route sequencing and time calculations.
Customer
The name of the customer associated with the route or destination, as defined in the account or order data.
Contract
The name or identifier of the contract linked to the assigned customer, if applicable, used for tracking or reporting purposes.
Pieces Planned
Total number of pieces planned for delivery.
Pieces Completed
Number of pieces successfully delivered.
Pieces Completed (%)
Percentage of planned pieces delivered.
Pieces Remaining At End (%)
Percentage of pieces undelivered at the route’s end.
Weight Planned
Total weight of items planned for delivery.
Weight Completed
Weight of items successfully delivered.
Weight Completed (%)
Percentage of planned weight delivered.
Weight Remaining At End (%)
Percentage of weight remaining at the end of the route.
Cube Planned
Total cubic volume planned for delivery.
Cube Completed
Cubic volume successfully delivered.
Cube Completed (%)
Percentage of planned cubic volume delivered.
Cube Remaining At End (%)
Percentage of cubic volume remaining at the end of the route.
Revenue Planned
Planned revenue for the route based on scheduled deliveries.
Revenue Completed
Revenue earned from completed deliveries.
Revenue Completed (%)
Percentage of planned revenue achieved.
Revenue Remaining At End (%)
Percentage of planned revenue remaining at the route’s end.
Cost Planned
Estimated cost associated with completing all stops on the route, including labor, fuel, and other operational expenses.
Strategic Optimization Name
Name of the strategic optimization applied to the route.
Scenario Name
Scenario associated with the strategic optimization.
Tracking Tab – User Location Updates Overview
The “Tracking” tab displays all location updates associated with a Vehicle, including telemetry data when available via Telematics Integration.
Click the Info Icon to view the Vehicle’s tracked location on a map, with key details such as latitude, longitude, speed, and timestamp. Refer to the table below for a detailed overview of all data available from the Tracking tab.
![]()
Vehicle Snapshot – Tracking Tab Data Columns
#
Sequential tracking instance, representing the order in which the Vehicle was recorded during its route.
Info
Click to view the Vehicle’s location on the map, including location and speed at a specific date and time.
Your Time
Timestamp showing when this tracking record was captured.
Speed
Vehicle speed at the recorded time.
Latitude
Vehicle latitude at the recorded time.
Longitude
Vehicle longitude at the recorded time.
Altitude
Vehicle altitude at the recorded time.
Direction
Direction the vehicle is facing at the recorded time.
Odometer
The total distance the vehicle has traveled, as recorded by the vehicle’s odometer at the time of this tracking instance.
Engine RPM
The engine’s revolutions per minute, indicating how fast the engine is running at this moment.
Engine Coolant Temperature
The temperature of the engine’s coolant, helping monitor engine operating conditions and prevent overheating.
Battery Health
An overall assessment of the vehicle’s battery condition, showing its capacity to hold and deliver charge.
Battery Temperature
The current temperature of the vehicle’s battery, which can affect performance and longevity.
Battery Level
The remaining charge in the battery, expressed as a percentage of full capacity.
Charge Status
Indicates whether the battery is currently charging, discharging, or fully charged.
Engine Status
Shows whether the engine is currently running or off at the time of this tracking instance.
Driver Seatbelt Status
Indicates whether the driver’s seatbelt is fastened.
Fuel Level
The remaining fuel in the Vehicle’s tank.
Source
Origin of the data, e.g., Route4Me.
Device Time
Timestamp of the device recording the data.
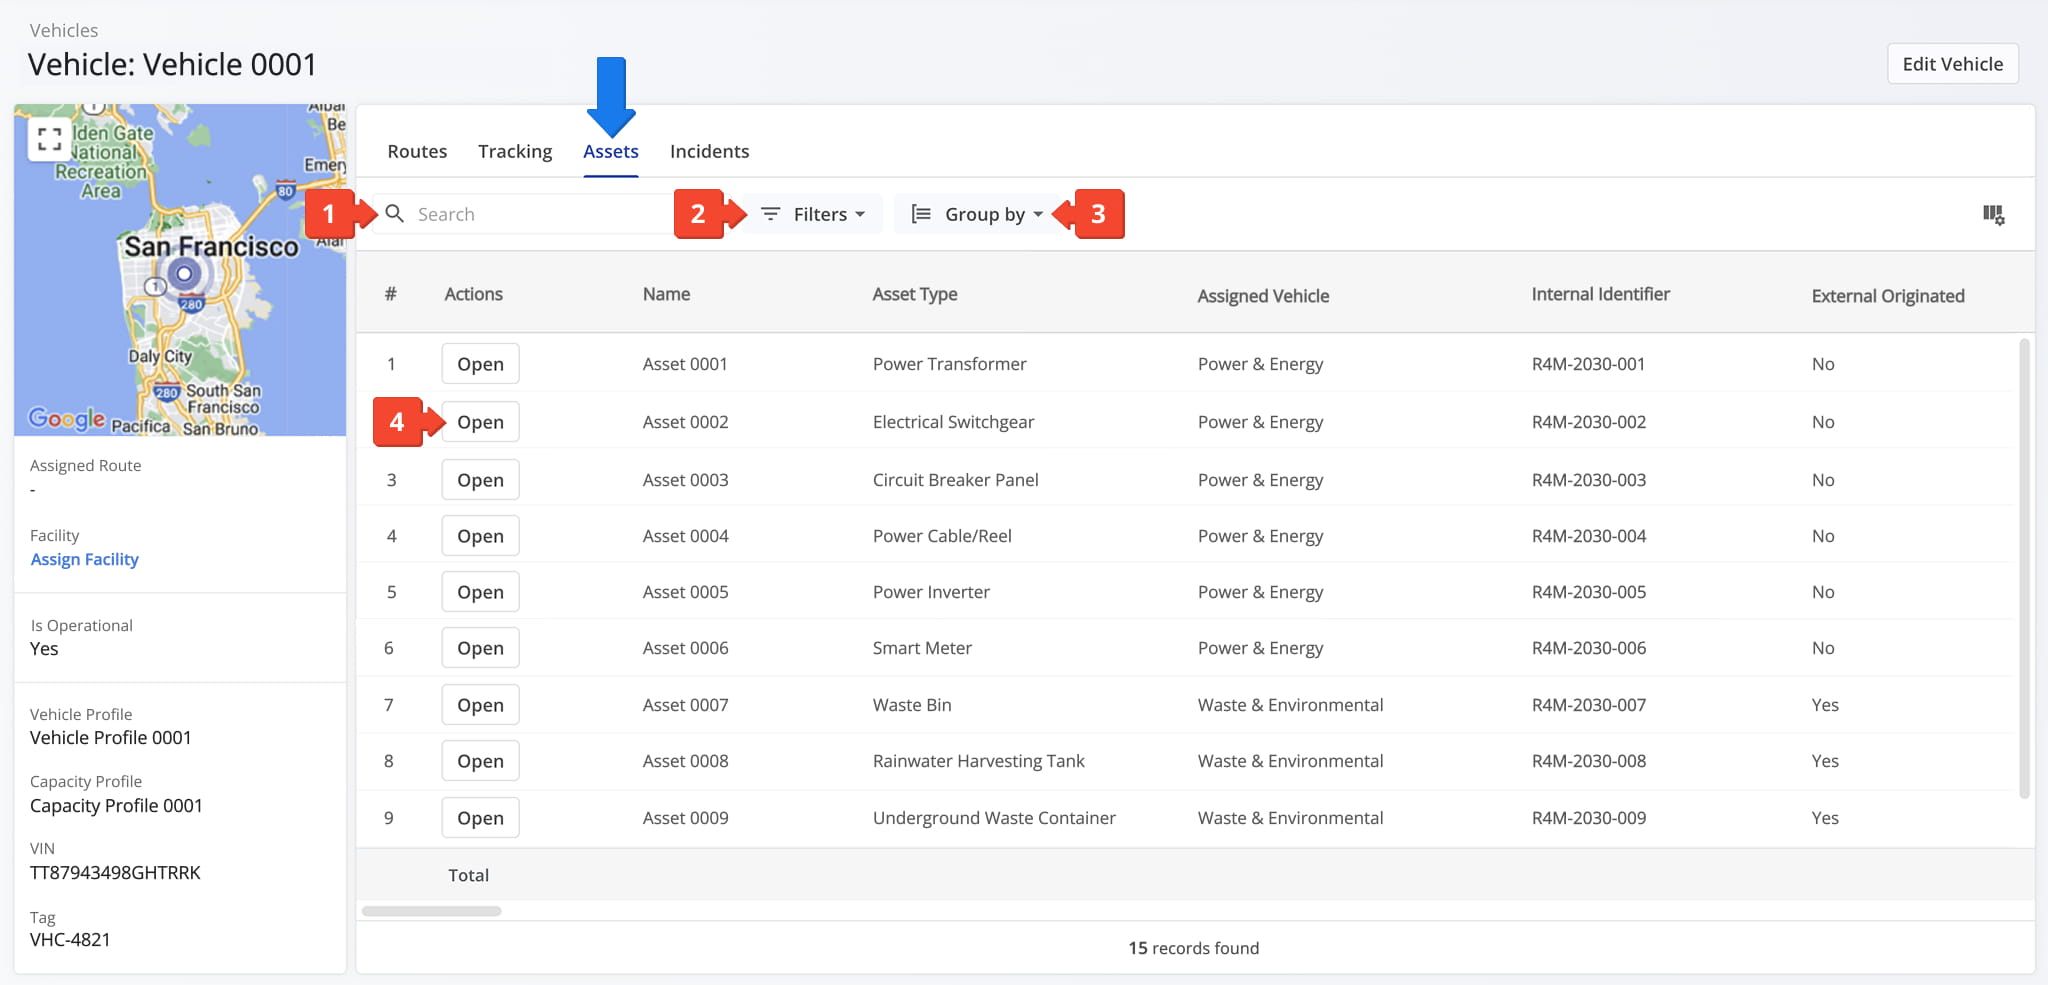
Assets Tab – Assigned Assets And Asset Data Overview
The “Assets” tab displays all assets associated with the selected vehicle. From this tab, you can:
- Use the Search field to locate specific assets by name or identifier.
- Apply filters to narrow down the asset list. See the table below for a full list of available filters.
- Use the Group By option to organize assets by asset type or whether they were externally originated.
- Click “Open” next to an asset to access its Asset Snapshot.
Vehicle Snapshot – Assets Tab Filters
Filter the data shown in this tab by a specific user.
Search for and select a Facility to narrow down which data appears.
Search for and select a Customer to narrow down which data appears based on its relationship to that customer.
Search for and select a Location to narrow down which data appears.
Search for and select a specific Asset Type to narrow down which data appears.
External Originated
Filter data by whether it was externally originated, selecting All, Yes, or No.
You can also customize the data displayed in the table. Click the Column Icon to select which route data fields appear and adjust their order to suit your operational needs.
The table below provides an overview of all available data columns, which you can reorder by dragging them into place.
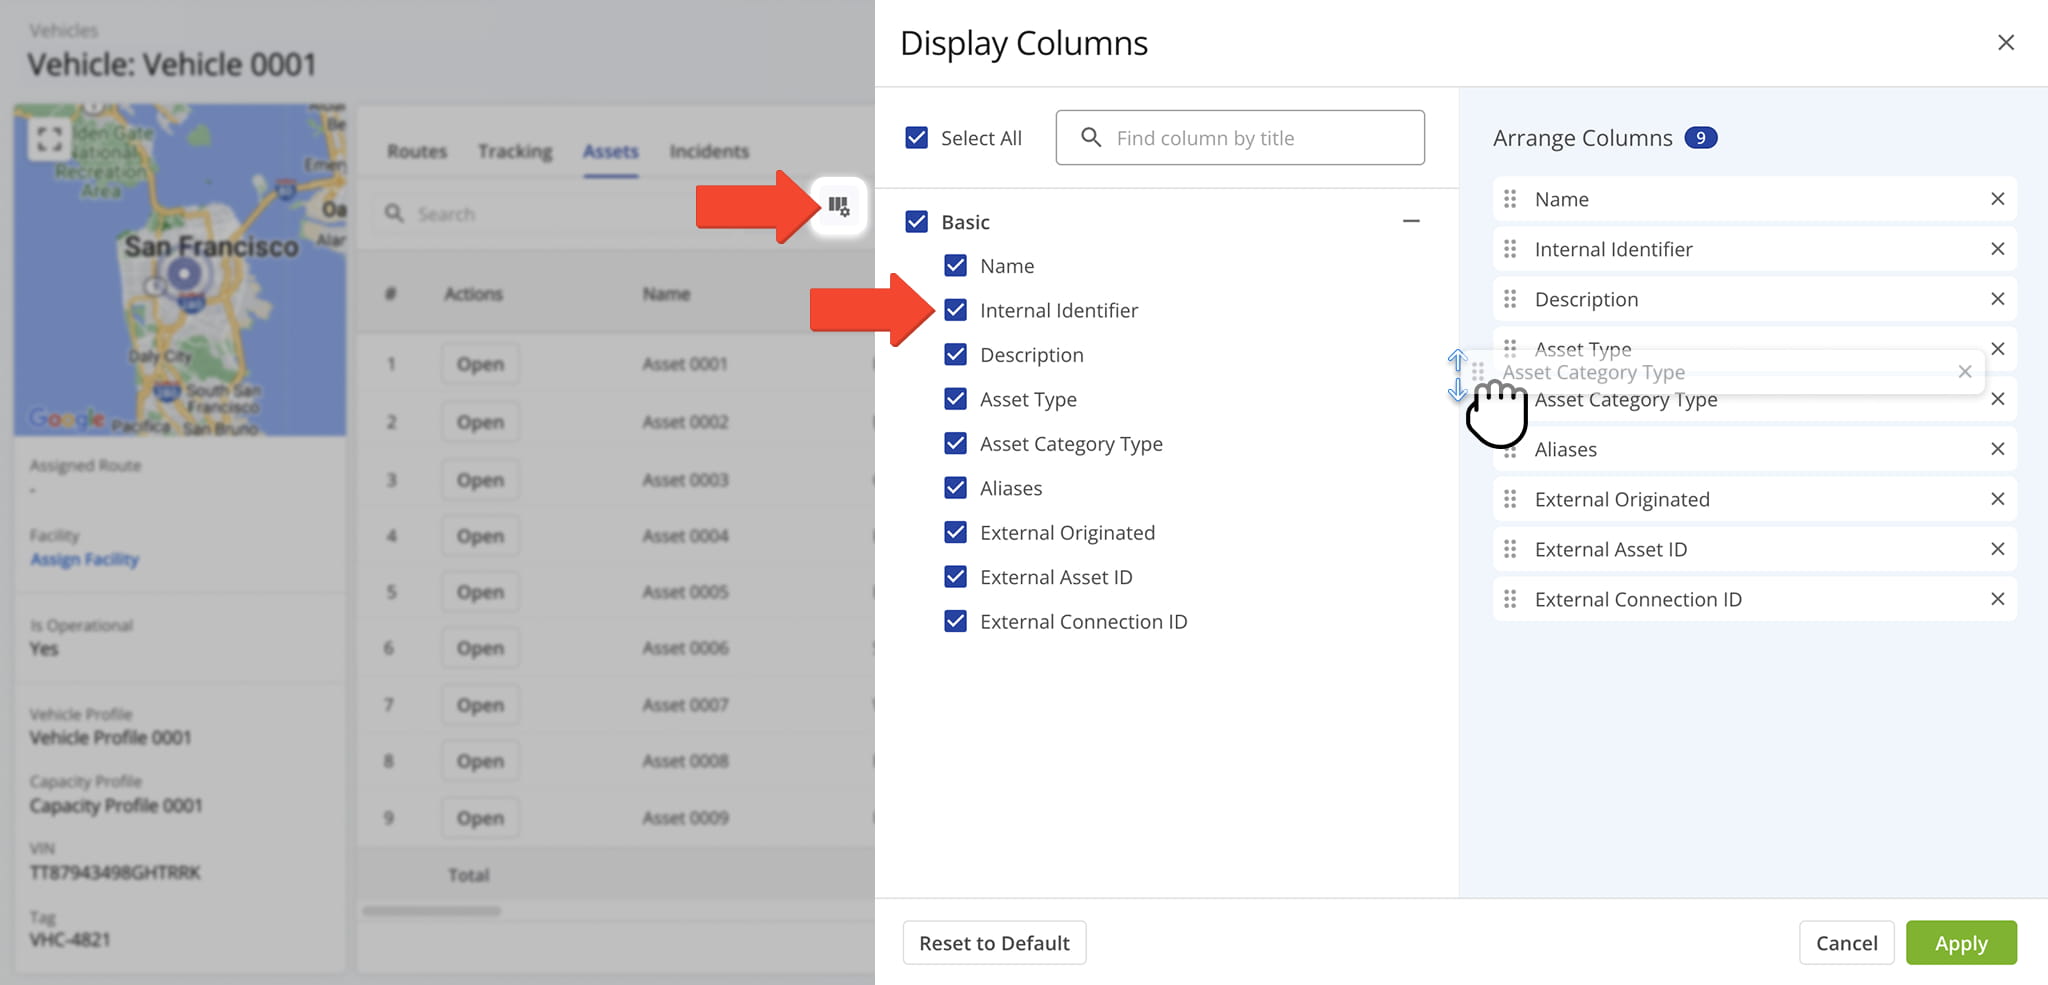
Vehicle Snapshot – Assets Tab Data Columns
Name
The name assigned to the asset.
Internal Identifier
A unique identifier assigned to the asset within your Route4Me account.
Description
A description providing additional details about the asset.
Asset Type
The type of asset, used to categorize it for filtering and reporting.
Asset Category Type
The broader category that the asset's type belongs to.
Aliases
Alternate names or labels associated with the asset.
External Originated
Indicates whether the asset originated from an external system rather than being created directly in Route4Me.
External Asset ID
The unique identifier assigned to the asset in the connected external system.
External Connection ID
The identifier of the external connection through which the asset's data was imported.
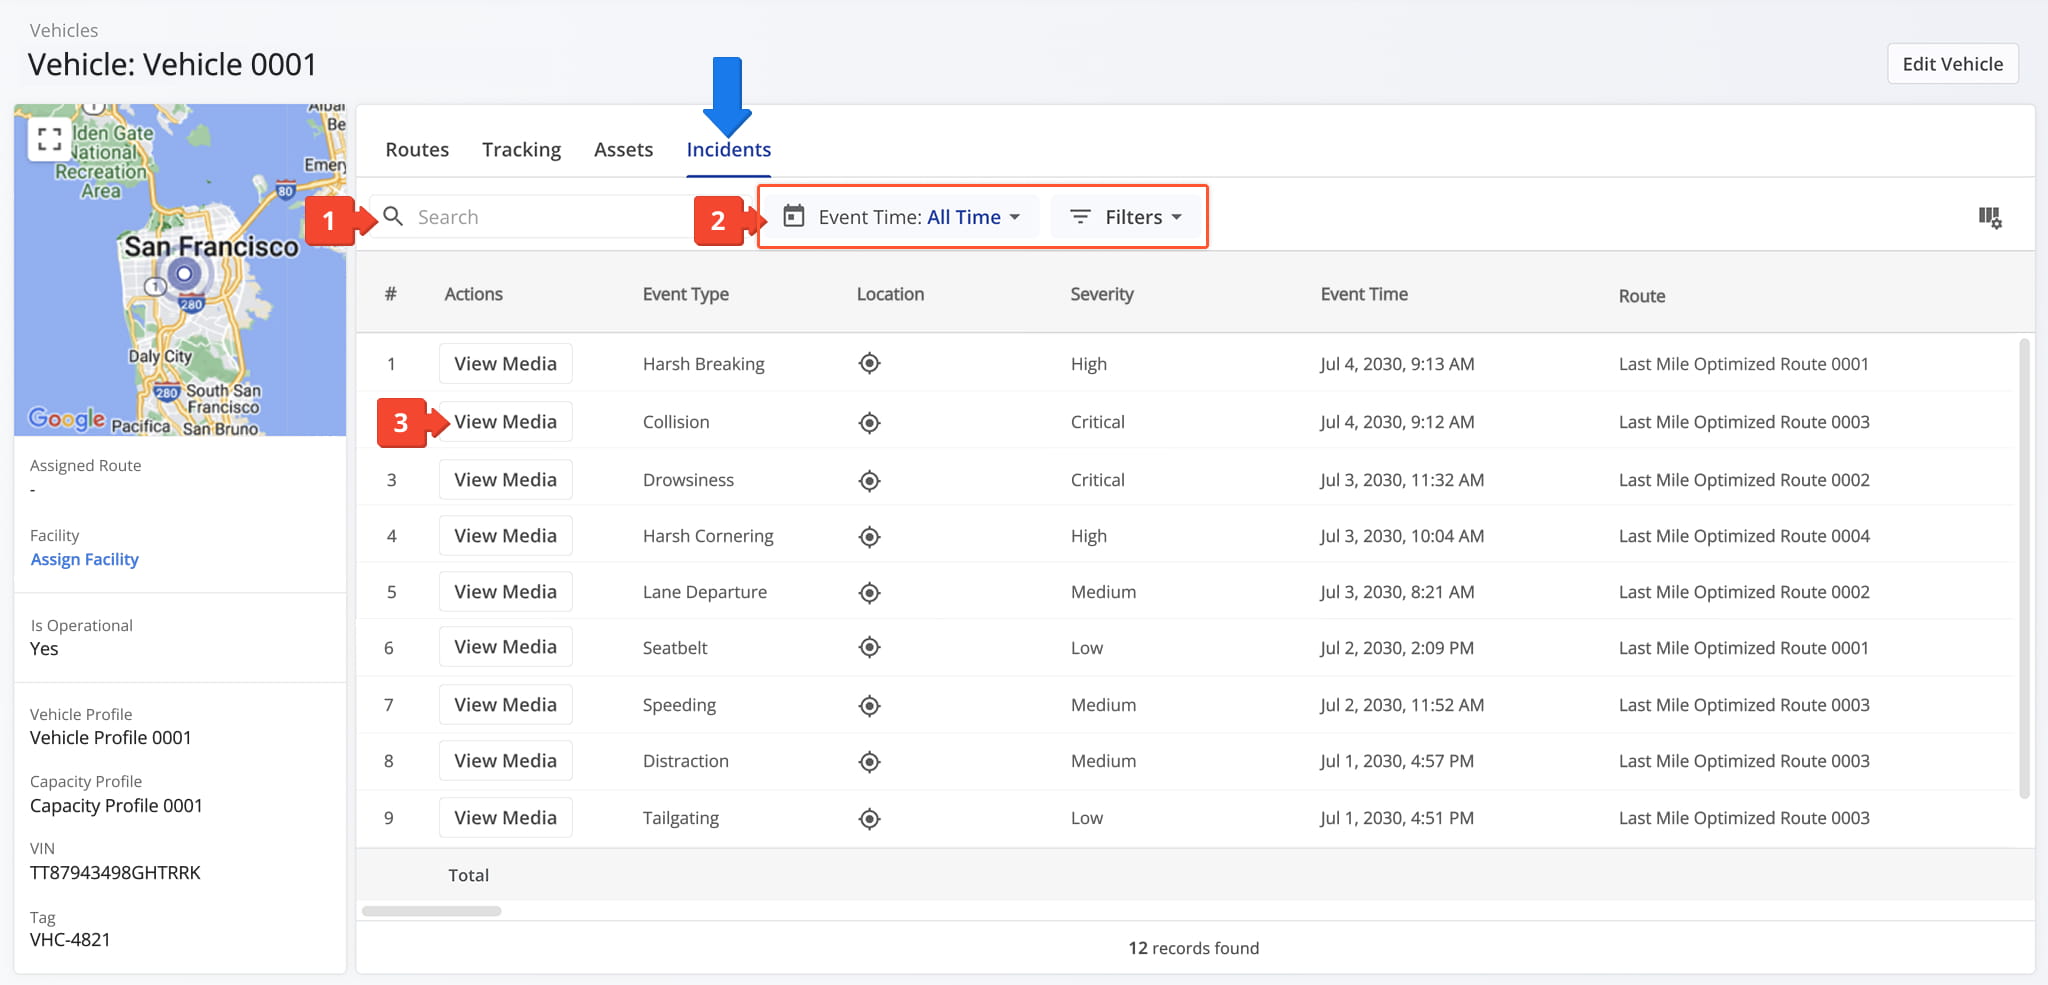
Incidents Tab – Recorded Safety Incidents And Incident Data
The “Incidents” tab displays all recorded safety incidents – pulled from your telematics device and dash cams – along with their details. From this tab, you can:
- Use the Search field to locate specific incidents.
- Define an Event Time or use Filters, described in the table below, to narrow which incidents appear in the data table.
- Click the “View Media” button to open the media player and inspect the recording associated with an incident.
NOTE: Learn more about these features in our dedicated guide to Route4Me incidents reports.
Vehicle Snapshot – Incidents Tab Filters
Event Type
Select one or more event types to narrow the incidents shown.
Severity
Filter by severity level, ranging from Low to Critical.
Duration
Set a minimum and/or maximum duration to filter incidents by length.
Driver
Search for a driver by name or email to filter incidents down to that individual.
Route
Search for a route by name to filter incidents down to that route.
You can also customize the data displayed in the table. Click the Column Icon to select which route data fields appear and adjust their order to suit your operational needs.
The table below provides an overview of all available data columns, which you can reorder by dragging them into place.
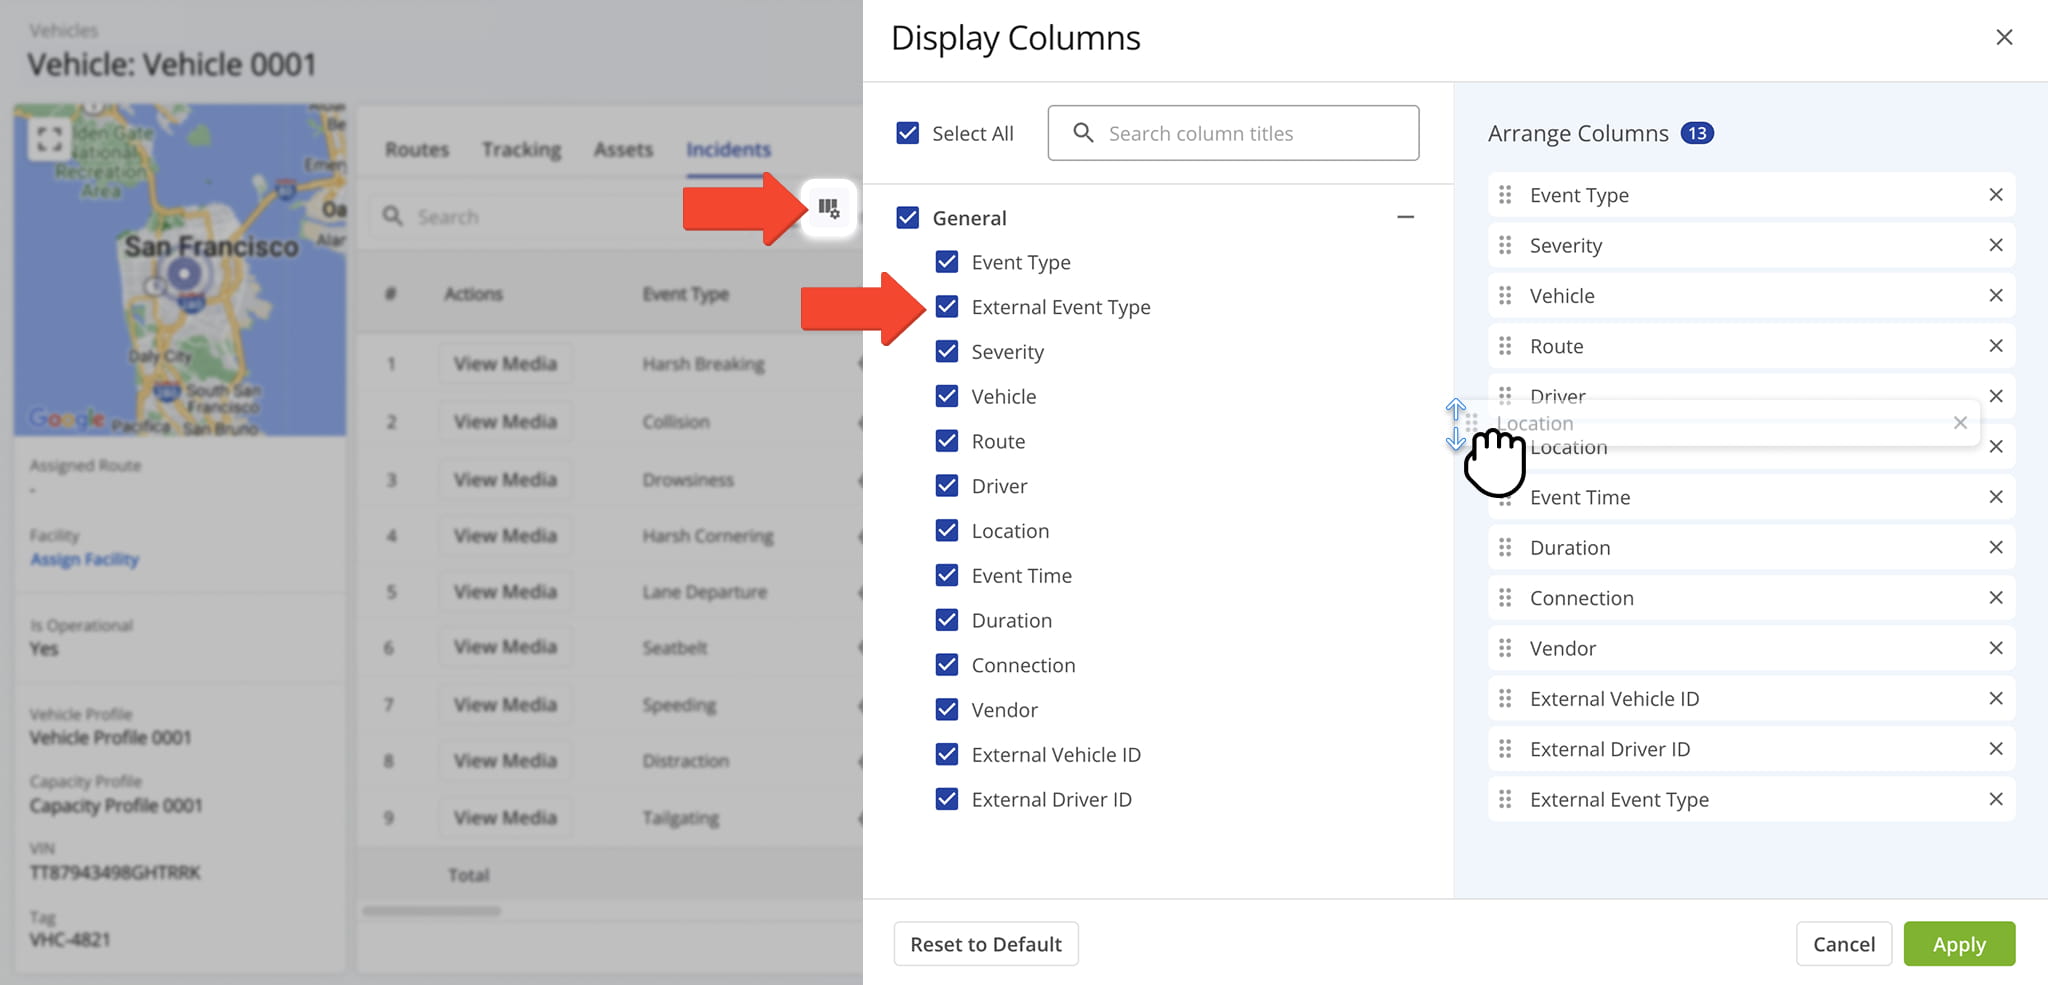
Vehicle Snapshot – Incident Tab Data Columns
Event Type
The type of incident detected, such as Collision, Tailgating, or Speeding.
External Event Type
The raw event type name as reported by the connected telematics vendor, prior to being mapped to a Route4Me Event Type.
Severity
The severity level assigned to the detected incident.
Vehicle
The vehicle associated with the incident.
Route
The route the vehicle was on when the incident occurred.
Driver
The driver associated with the incident.
Location
The geographic location where the incident occurred.
Event Time
The date and time when the incident occurred.
Duration
The length of time the incident lasted.
Connection
The Telematics Connection associated with the incident.
Vendor
The Telematics provider supplying data for the associated connection.
External Vehicle ID
Unique identifier assigned to the vehicle in the connected telematics system.
External Driver ID
Unique identifier assigned to the driver in the connected telematics system.
Visit Route4Me's Marketplace to Check out Associated Modules:
- Operations
Audit Logging and Activity Stream
- Operations
Custom Data Add-On
- Operations
Advanced Team Management Add-On
About author: Daniel Archer
With a background in pedagogy and writing instruction, Daniel is a former tenured English Instructor who, after nearly 20 years of teaching, transitioned into content strategy and leading writing teams for global brands. Now, as Technical Documentation Manager at Route4Me, he translates complex logistics technology into clear, accessible content that empowers users.