
Solution Analysis – Review And Compare Route Optimization Results
Last mile route optimization helps enterprise businesses plan efficient routes across large fleets, but planners often need to understand why the optimizer built routes the way it did. Solution Analysis answers that question by exporting a detailed report that lets dispatchers check that time windows were met, find orders that couldn’t be routed, and compare optimized routes against unoptimized ones. This article explains how to export a Solution Analysis and what each tab of the report shows.
Table of Contents
What Is Solution Analysis – Audit Route Optimization Results
Solution Analysis is a reporting tool that exports a report showing how Route4Me planned a route or optimization.
It gives dispatchers, fleet managers, and logistics analysts a clear look at which constraints were applied and how well the routes performed. With Solution Analysis, you can:
- Audit Solutions: Check that vehicle capacities, time windows, and service times were met.
- Compare Performance: See how a Route4Me optimized route measures up against an unoptimized one.
- Find Gaps: Spot unrouted orders, stop sequence issues, and constraint conflicts.
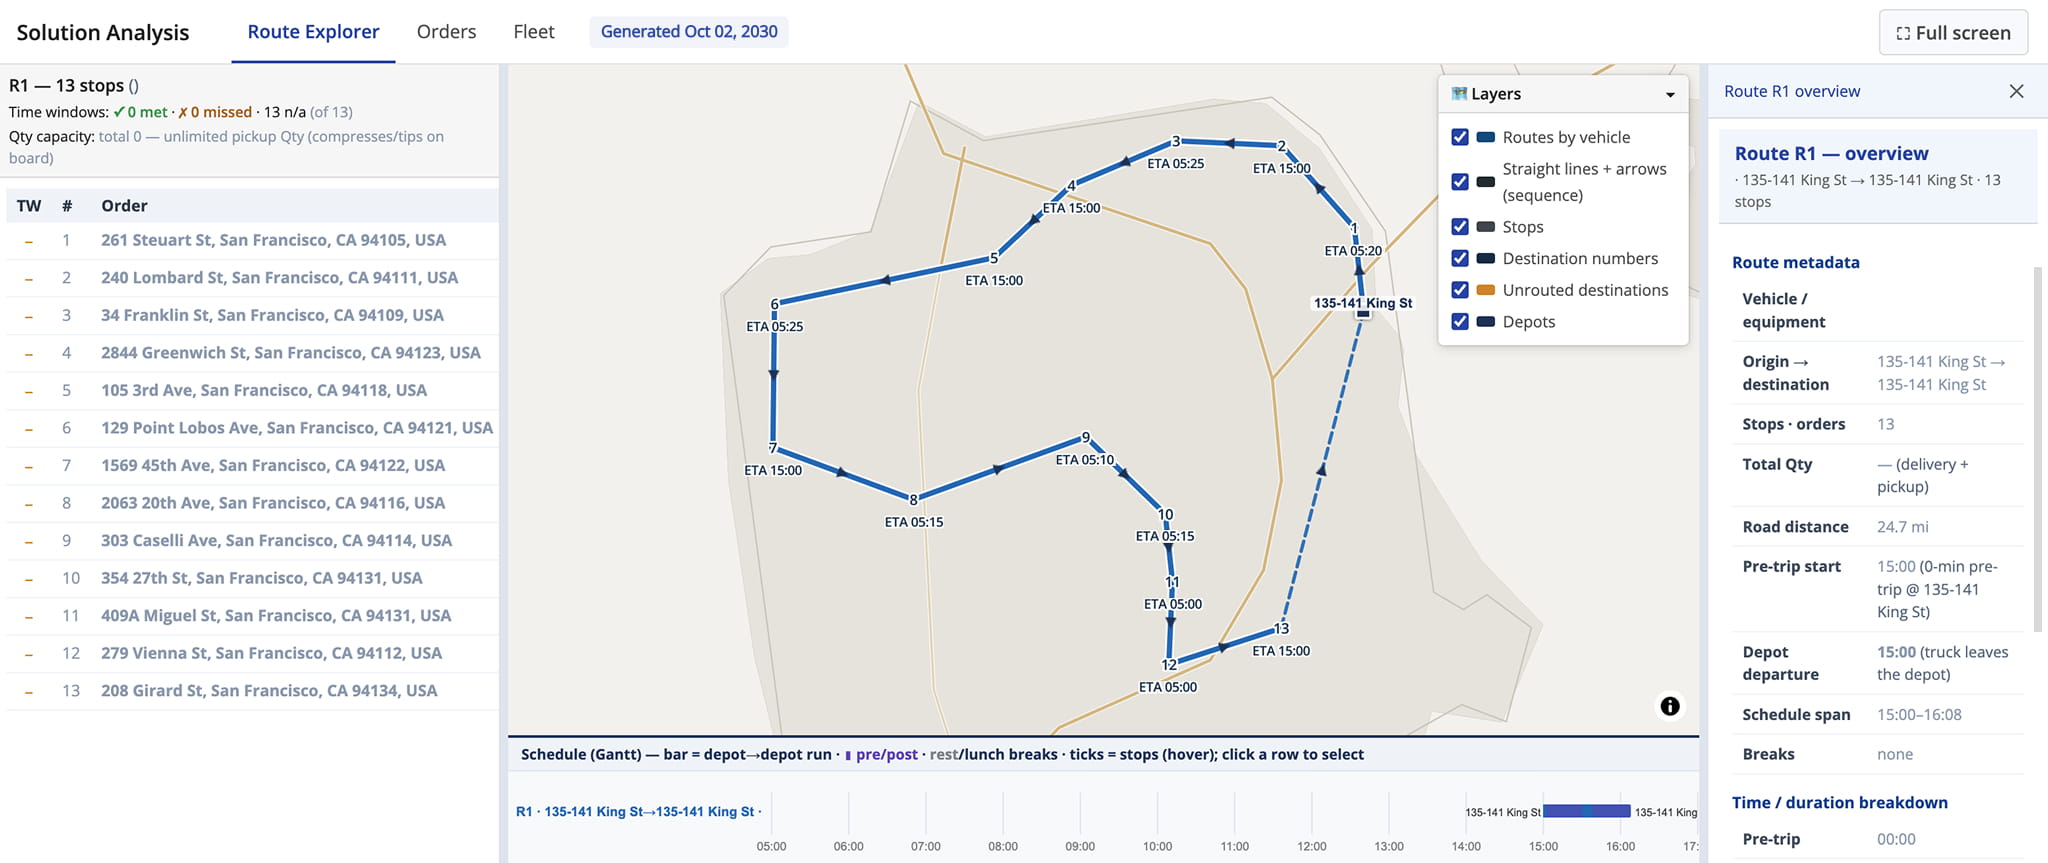
Where To Find Solution Analysis – Route And Optimization Snapshots
Route Snapshot Solution Analysis – Export A Single Route
To analyze a single route, open its Route Snapshot and select Solution Analysis from the “Analysis” drop down . The report covers that route’s stops, metrics, and execution parameters.
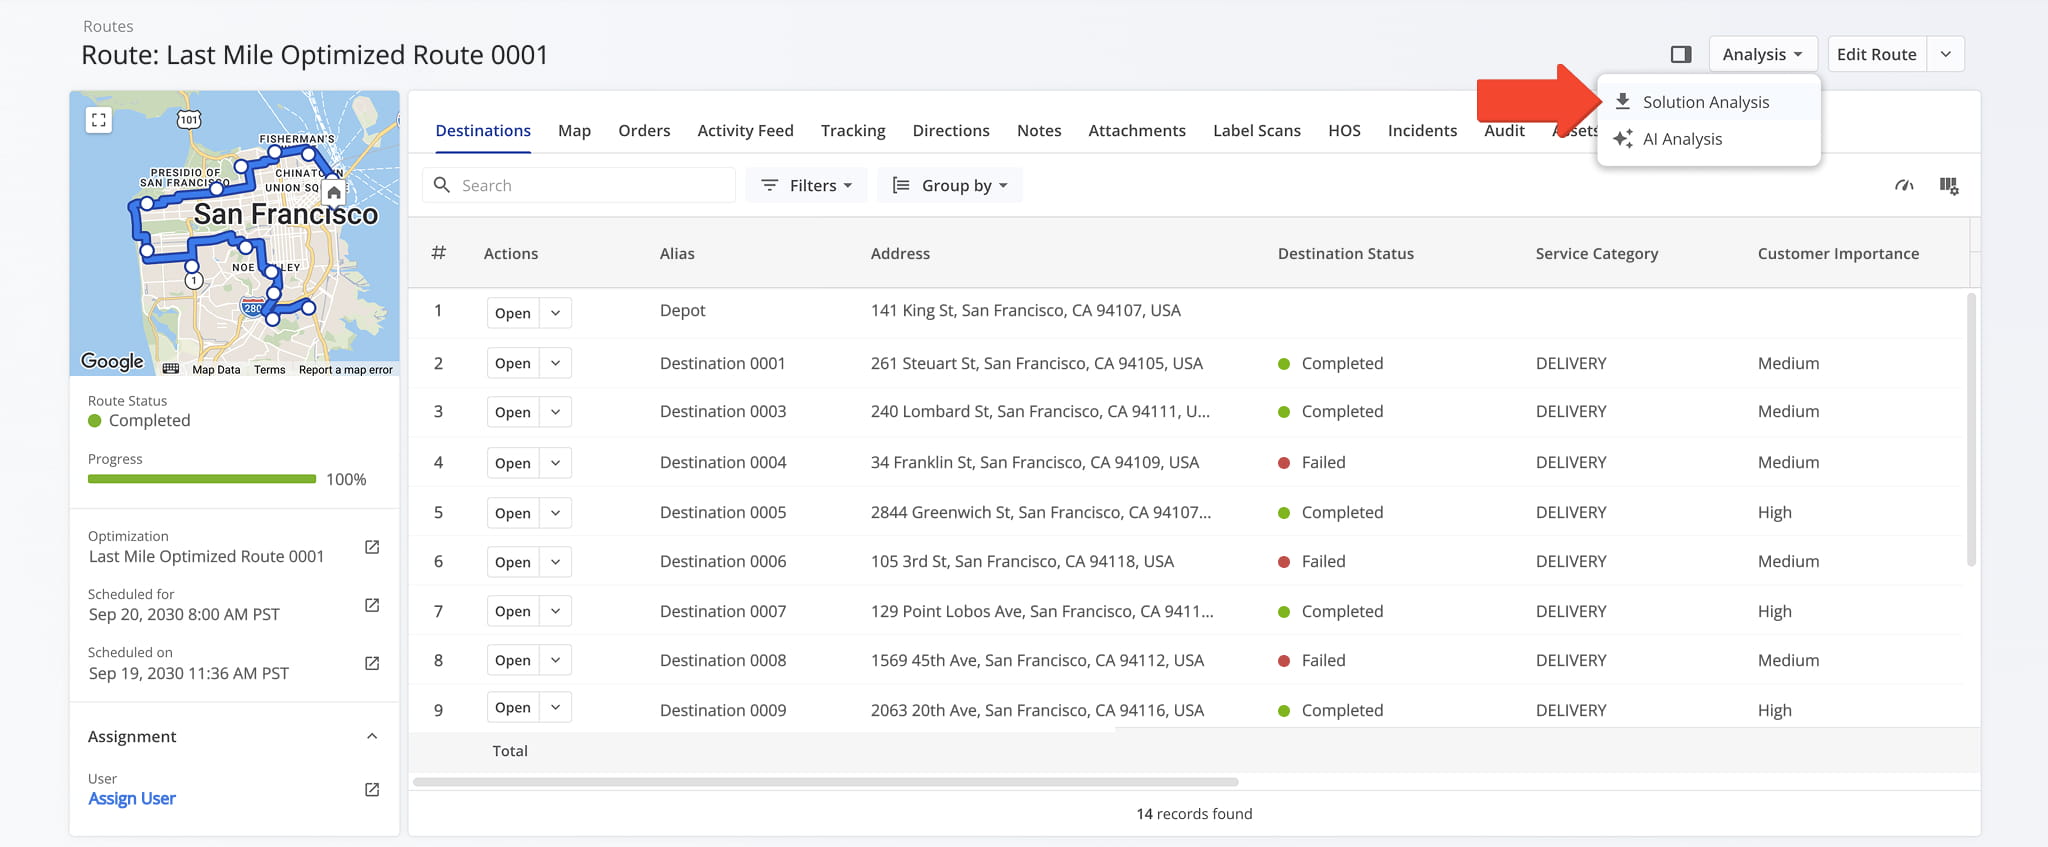
Optimization Snapshot Solution Analysis – Export All Routes From An Optimization
To analyze an entire optimization, open its Optimization Snapshot and select Solution Analysis. The report combines data from all of the routes, vehicles, and destinations generated by that optimization.
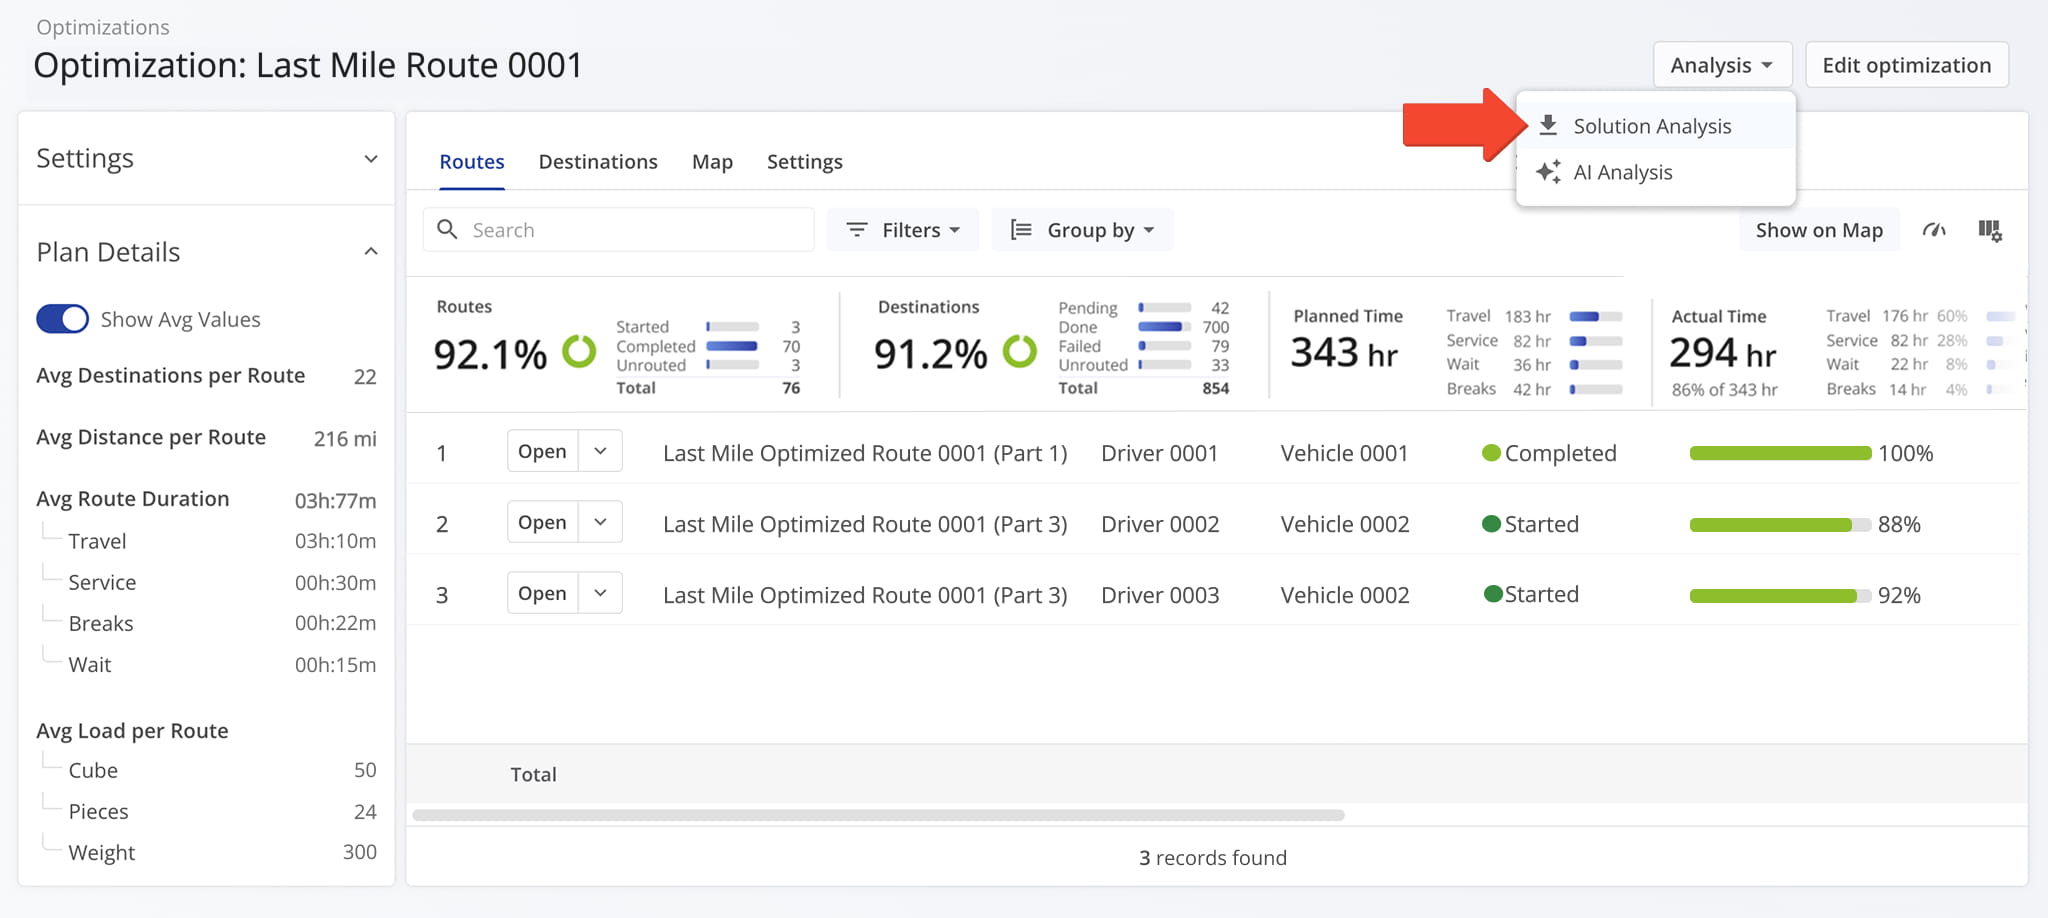
Solution Analysis Overview – Tabs, Fields, And Report Details
Route Explorer Tab – View Routes, Stops, And Schedules
The “Route Explorer” tab shows your routes on a map, along with the stops and schedule behind each one. Select a route to see the following:
- Route Summary: Shows the route name, number of stops, number of missed stops and time windows, and the route’s quantity capacity.
- Stop List: List each stop in sequence with its address. Click the dash in the “TW” column to zoom in on a stop in the map.
- Schedule: Shows the route’s run from depot to depot.
- Route Map: Shows the route on a map and the estimated time of arrival at each stop. Customize the map with “Layers” options.
- Route Overview Panel: Shows detailed information about the selected route. See the table below for a breakdown.
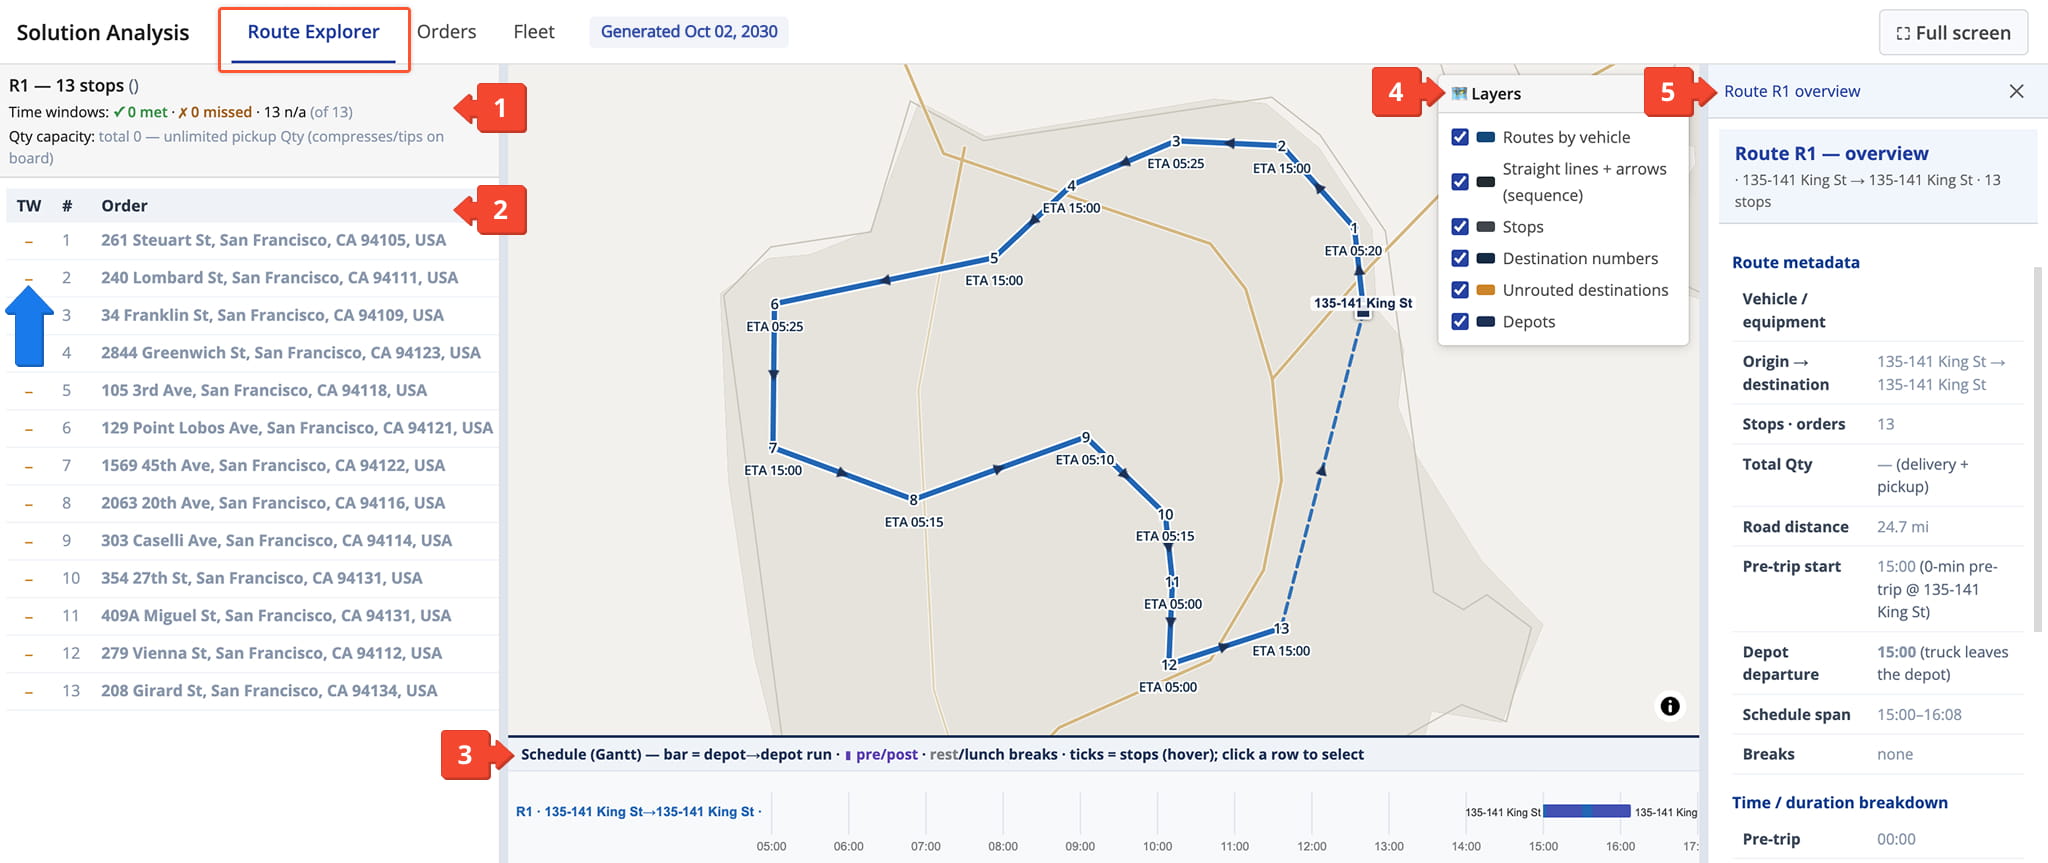
Route Overview Panel
Orders Tab – Track Order Status And Assignments
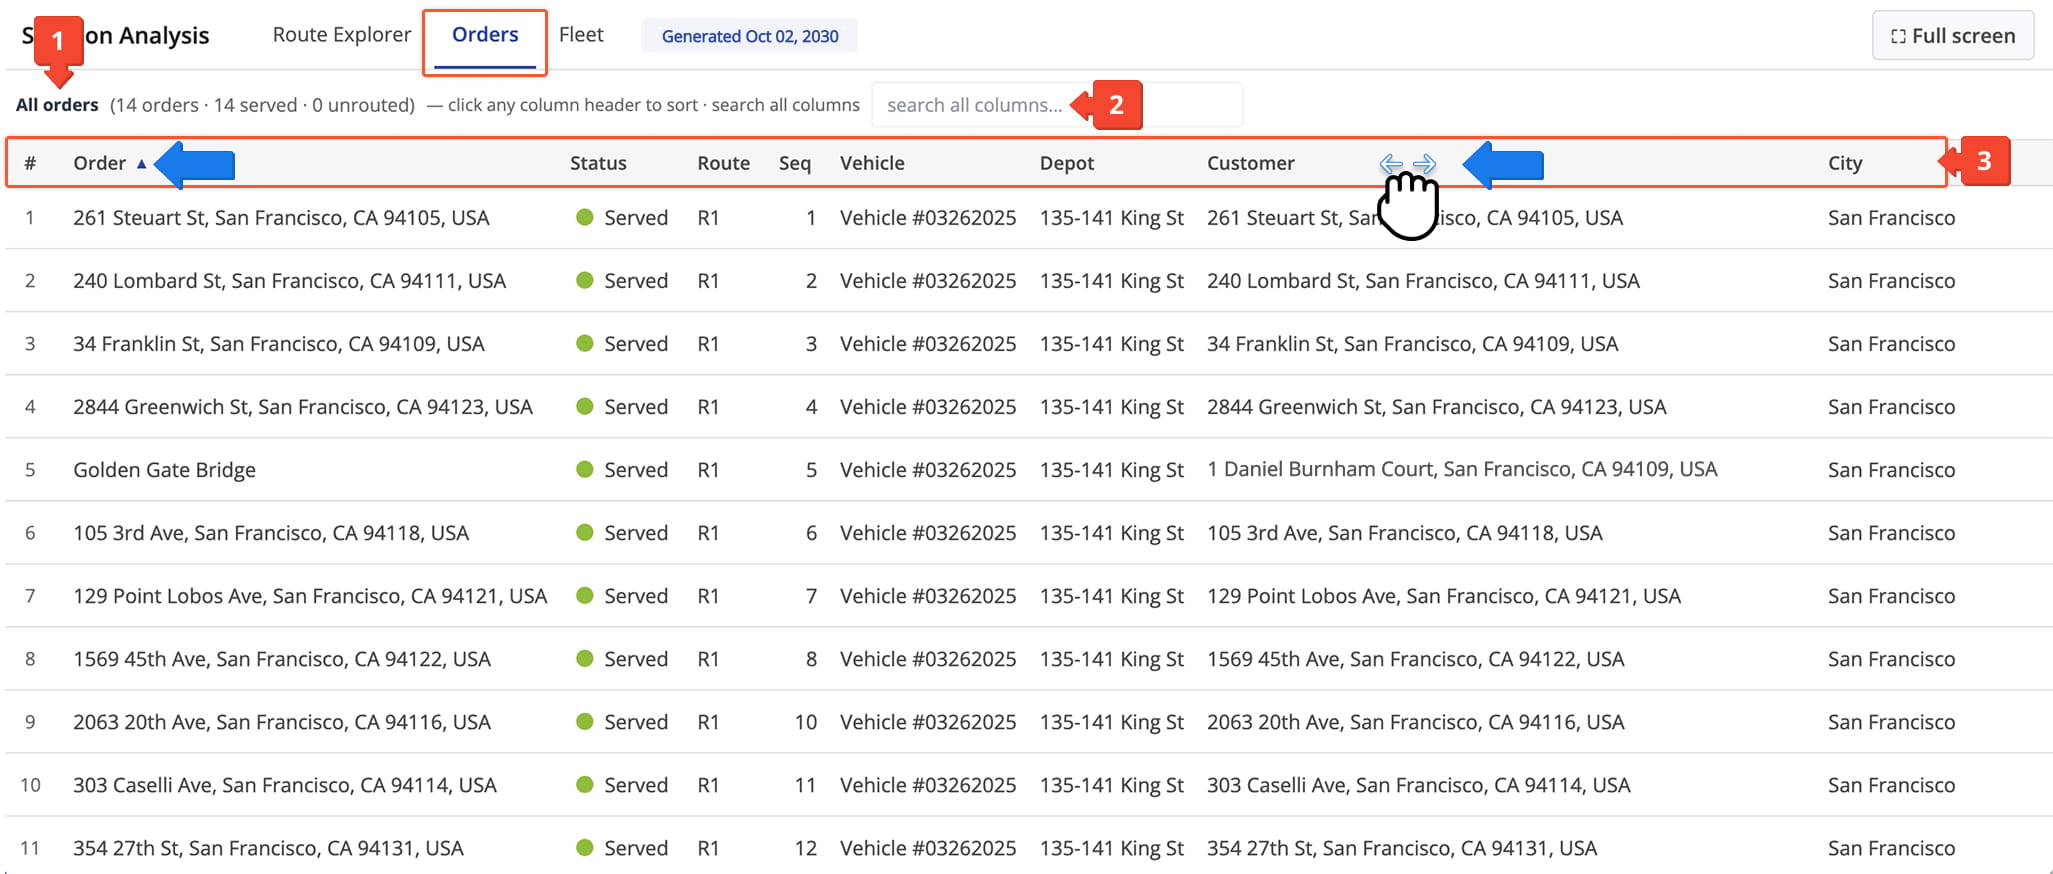
The “Orders” tab lists every order in your report, so you can see which were served and which were left unrouted. It includes the following:
- Order Summary: Shows the total number of orders and how many were served or unrouted.
- Search Field: Use the “Search All Columns” field to quickly find an order by any value in the table.
- Orders Table: Shows the details for each order. Click a column header to sort a column. Scroll sideways to see more columns. See the table below for a breakdown of each column.
Order Tab Data Columns
Fleet Tab – Track Vehicle Usage And Fleet Utilization
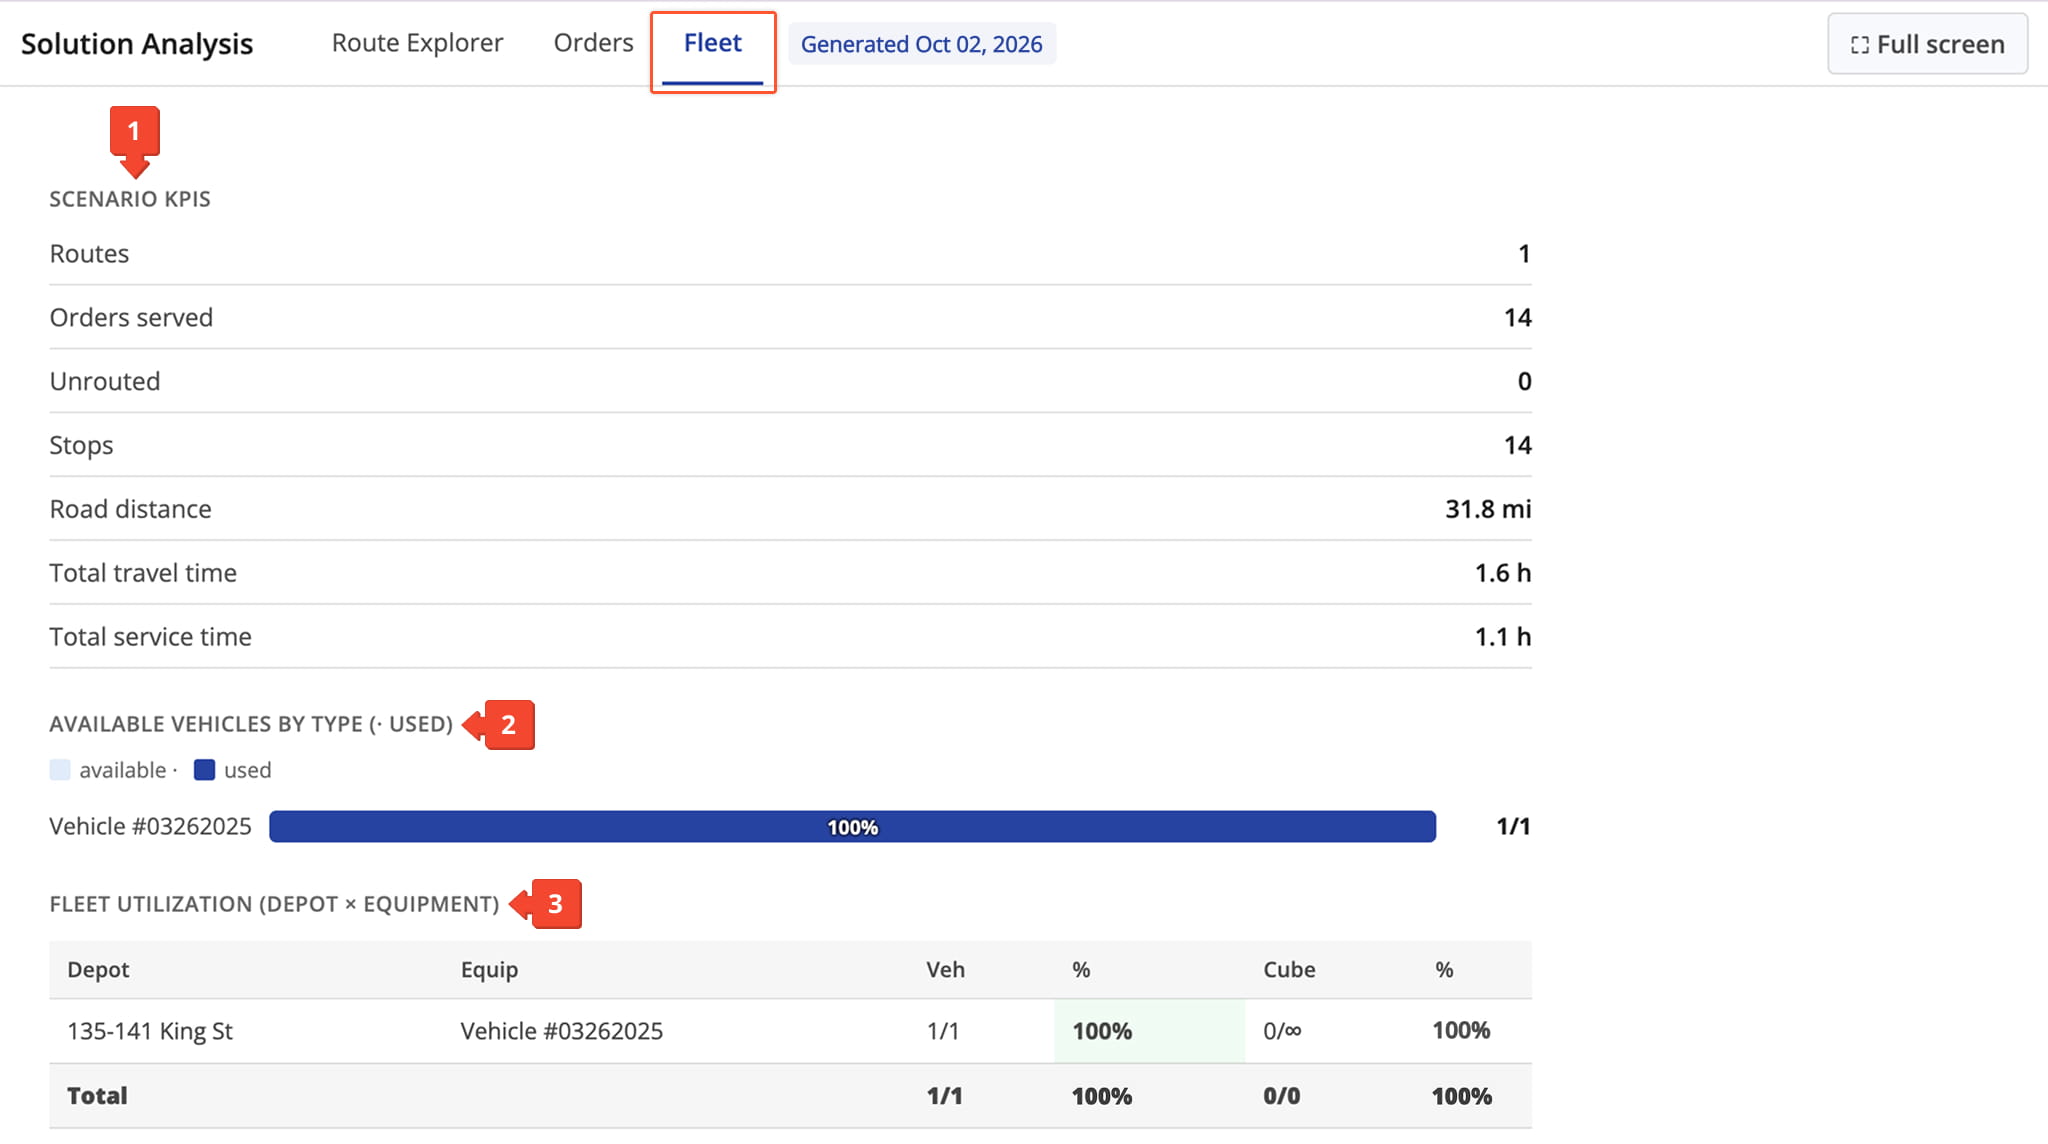
The “Fleet” tab summarizes how your vehicles were used across your routes. It includes the following:
- Scenario KPIs: Shows totals for the whole report. See the table below for a breakdown of each KPI.
- Available Vehicles By Type: Shows how many vehicles of each type were available and how many were used.
- Fleet Utilization: Breaks down vehicle usage by depot and equipment type, including how much of each vehicle’s capacity was used.
Scenario KPIs
Visit Route4Me's Marketplace to Check out Associated Modules:
- Operations
Advanced Team Management Add-On
- Operations
Audit Logging and Activity Stream
About author: Daniel Archer