
Strategic Optimization AI Summary – Newspaper-Style Reports For Routing Scenarios
Route4Me’s integrated Strategic Route Data AI Summary generates high-level executive KPI reports and operations news for your Strategic Optimizations. When you open a multi-scenario optimization, the system instantly synthesizes complex routing variables into a clear, scannable “newspaper”. By highlighting vital metrics such as cost-per-stop, waste ratios, and asset utilization, AI summaries accelerate data analysis and help logistics planners identify the highest-performing Strategic Routing Scenarios.
Table of Contents
Strategic Optimization AI Summary Overview
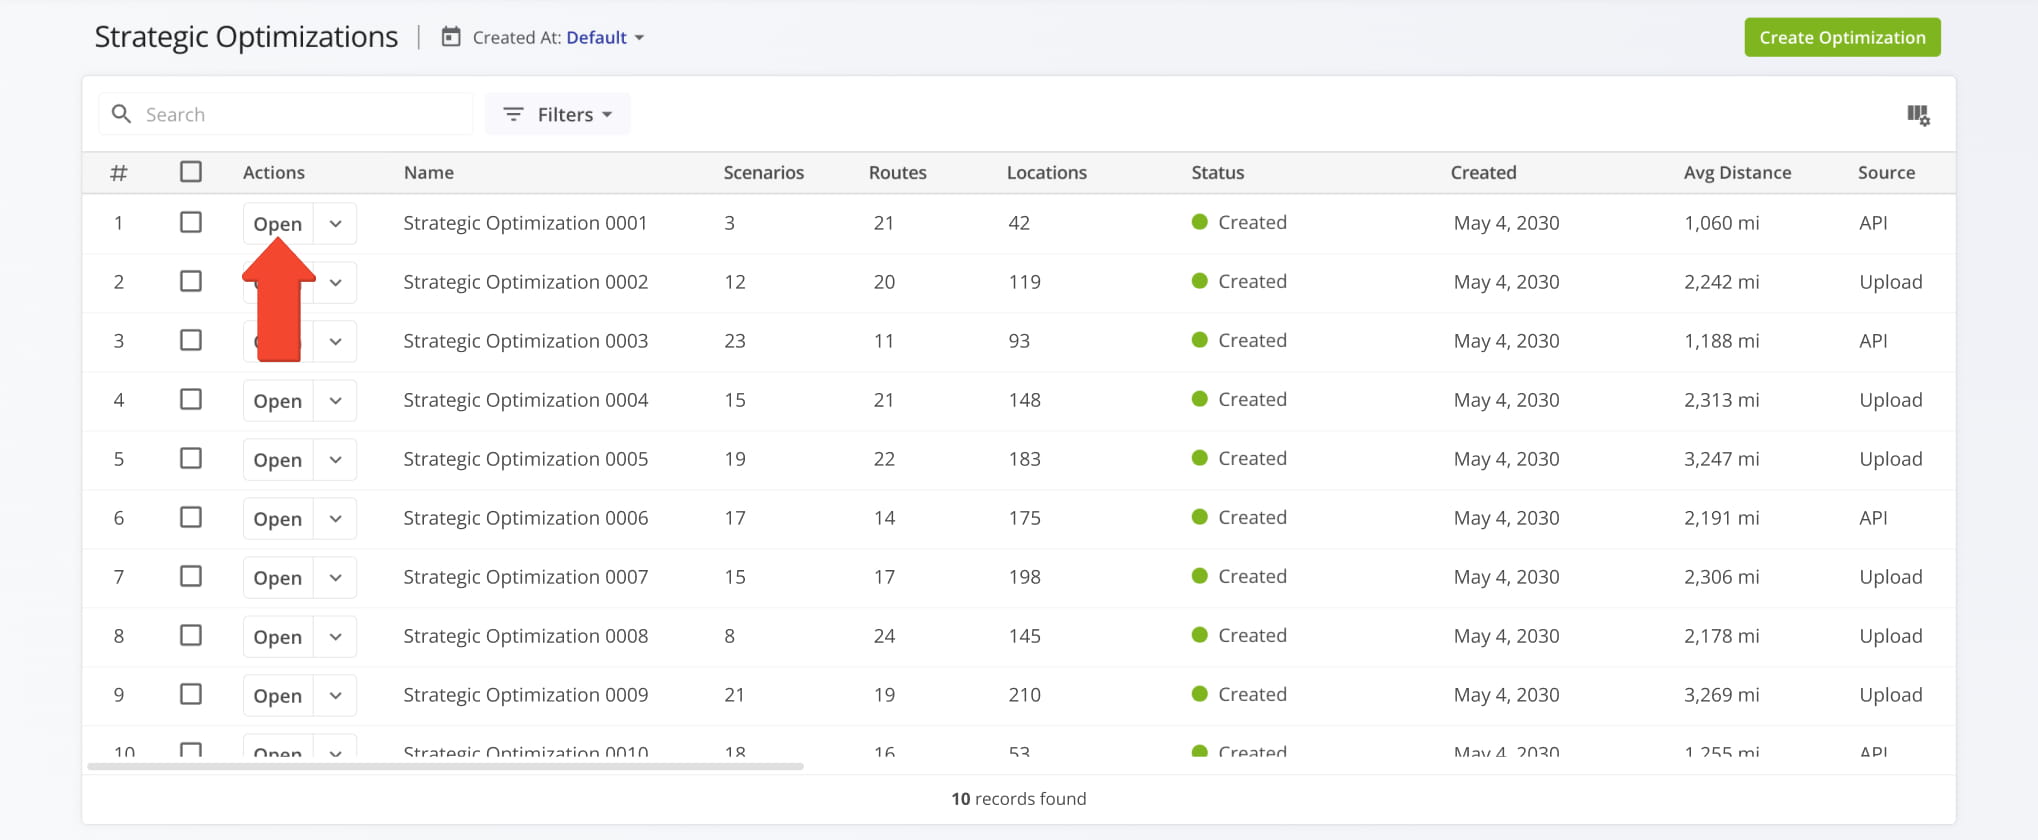
To access a Summary, click “Strategic Routing” > “Scenarios” from the Navigation Menu, then click “Open” next to the Strategic Optimization for which you want to view an AI Summary.
Open Your Strategic Optimizations
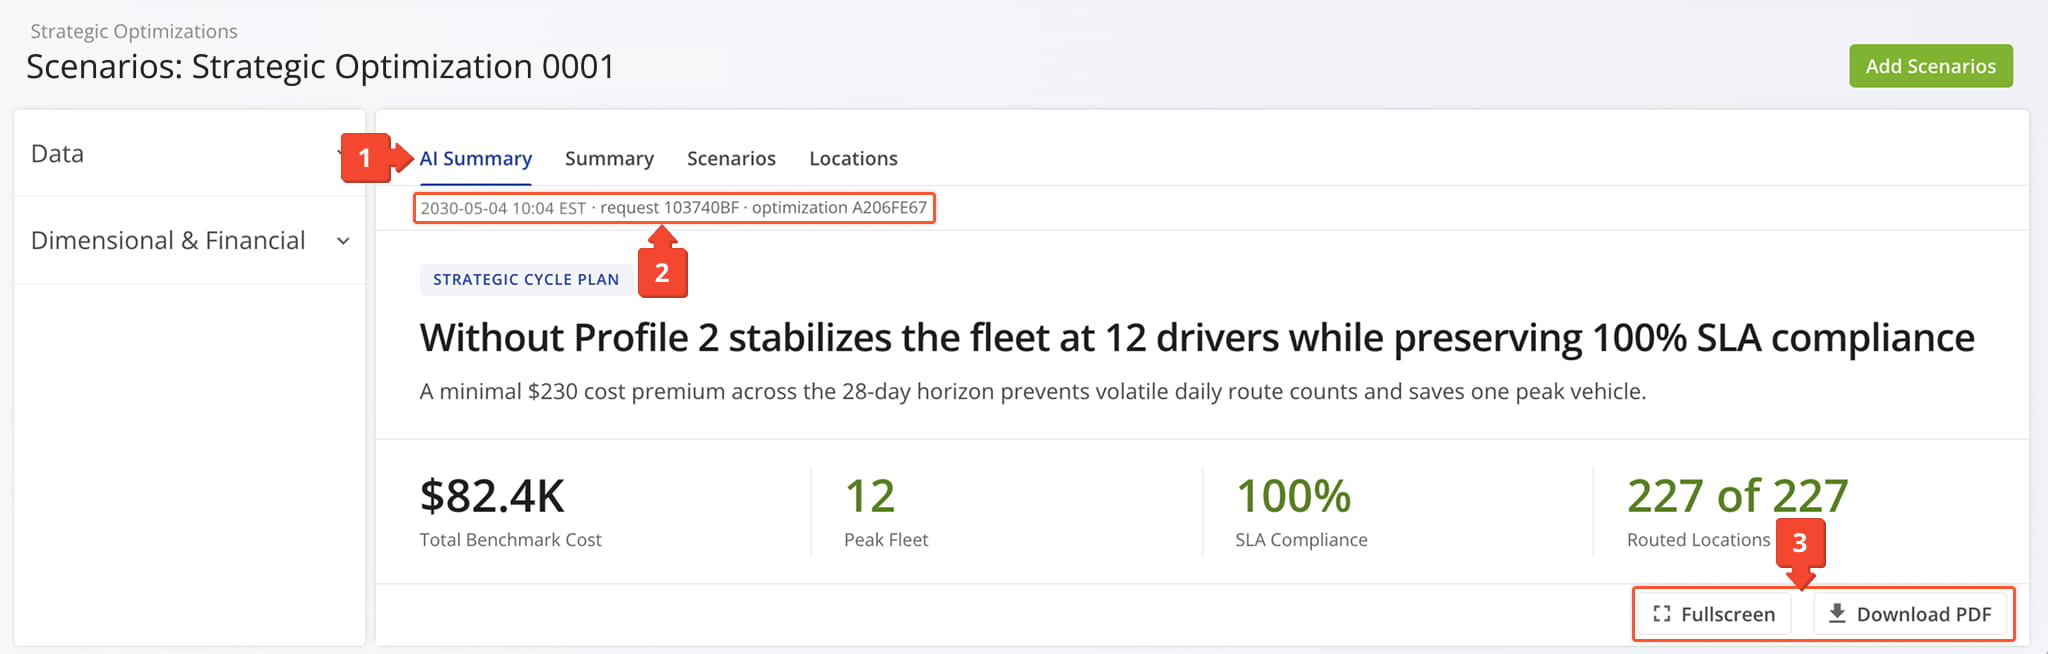
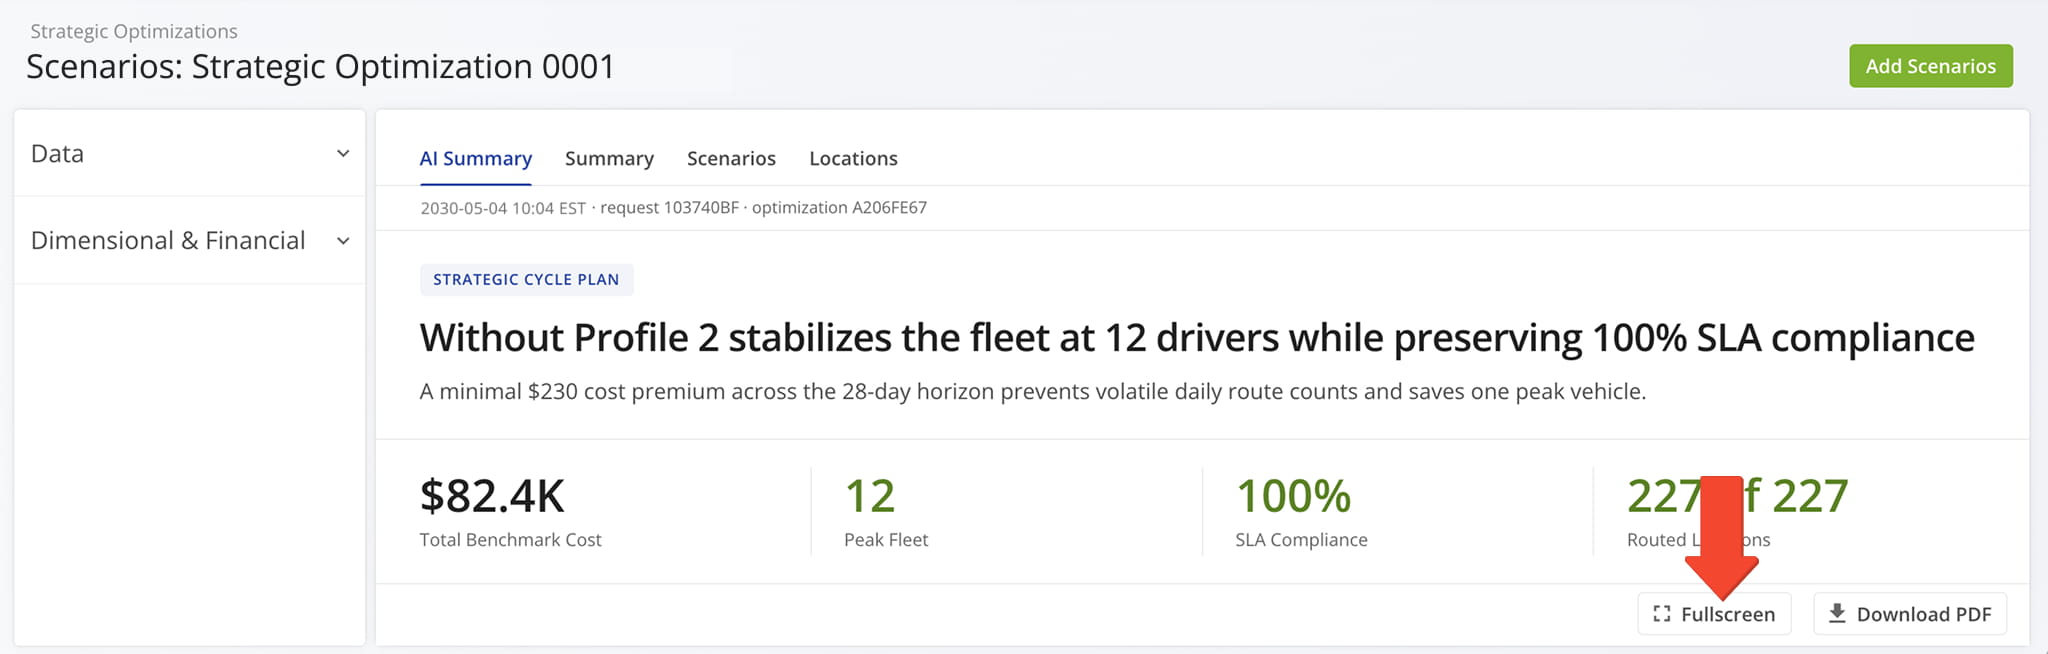
Upon opening the Strategic Optimization, Route4Me automatically generates an AI Summary, enabling you to quickly review key strategic insights, optimization results, and operational news at a glance. What you’ll find:
- The “AI Summary” tab opens by default, displaying the most recently generated summary.
- A timestamp shows when the summary was generated, along with its associated request and optimization IDs for reference.
- Two buttons, one to view a fullscreen version of the summary, the other to download it as a PDF.
Executive Takeaways And High-Level KPIs
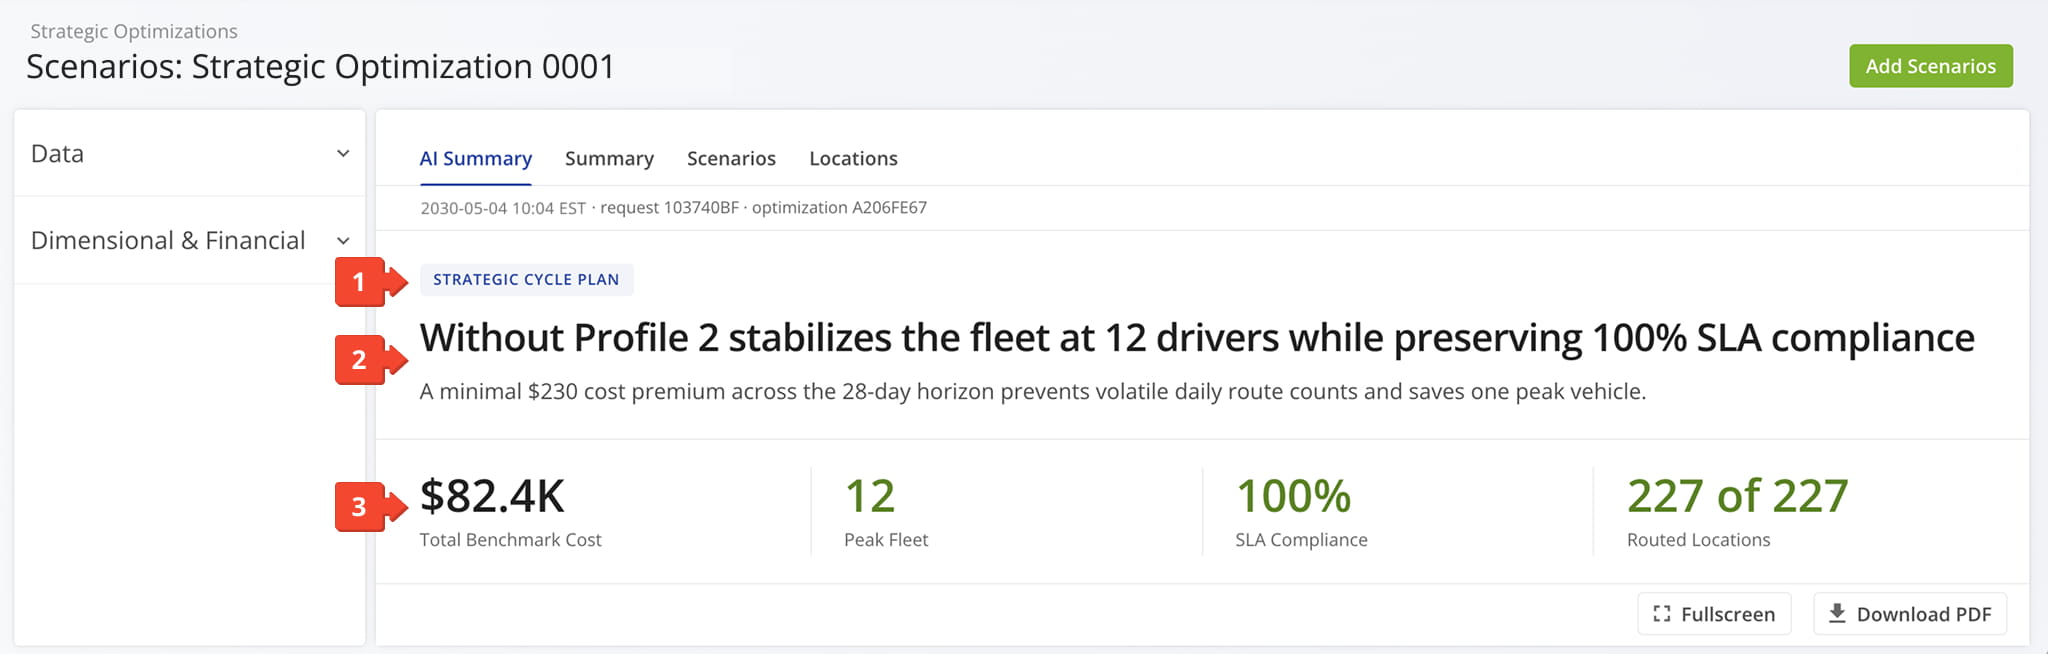
The top section of the AI Summary provides an overview of the optimization’s most impactful strategic conclusions, key business news, and core performance metrics with the following fields:
- Analysis Type Label: Label identifying the type of strategic analysis or plan being summarized.
- Key Summary Narrative: Breakdown detailing how the optimal strategy achieves its results.
- Core Performance KPIs: Aggregate, high-level logistics and economic performance metrics of the Strategic Optimization.
Comparative Analysis And Scenario Feasibility
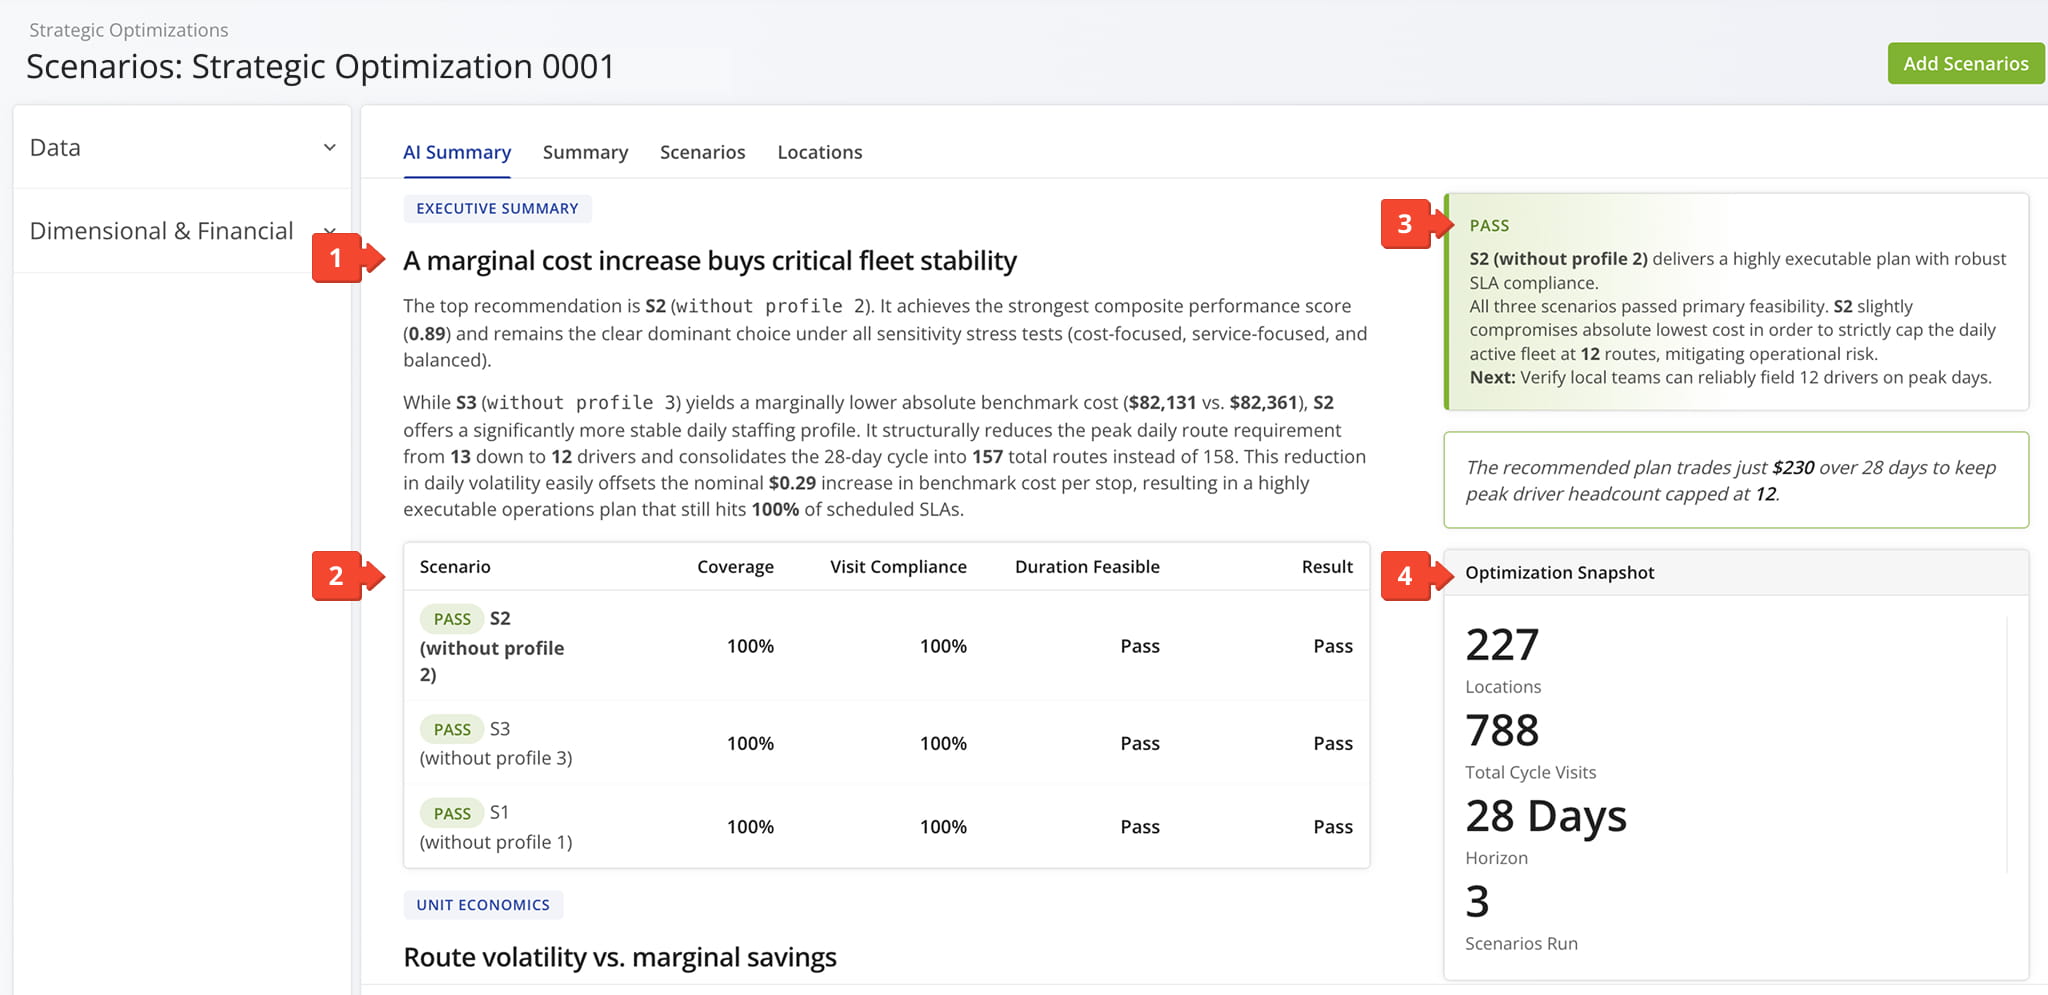
The main body of the AI Summary provides a detailed comparative analysis of your optimization models alongside core operational constraints with the following fields:
- Detailed Executive Summary: Text analysis detailing the specific financial advantages and strategic impacts of the winning scenario.
- Scenario Feasibility Table: Scenario validation comparison of Coverage, Compliance, Duration, and Results.
- Verdict: The recommended scenario and the key reasoning, trade-offs, and next steps behind the selection.
- Optimization Snapshot: Summary of the optimization’s core parameters: total locations, cycle visits, planning horizon, and scenarios run.
Unit Economics And Risk Diagnostics
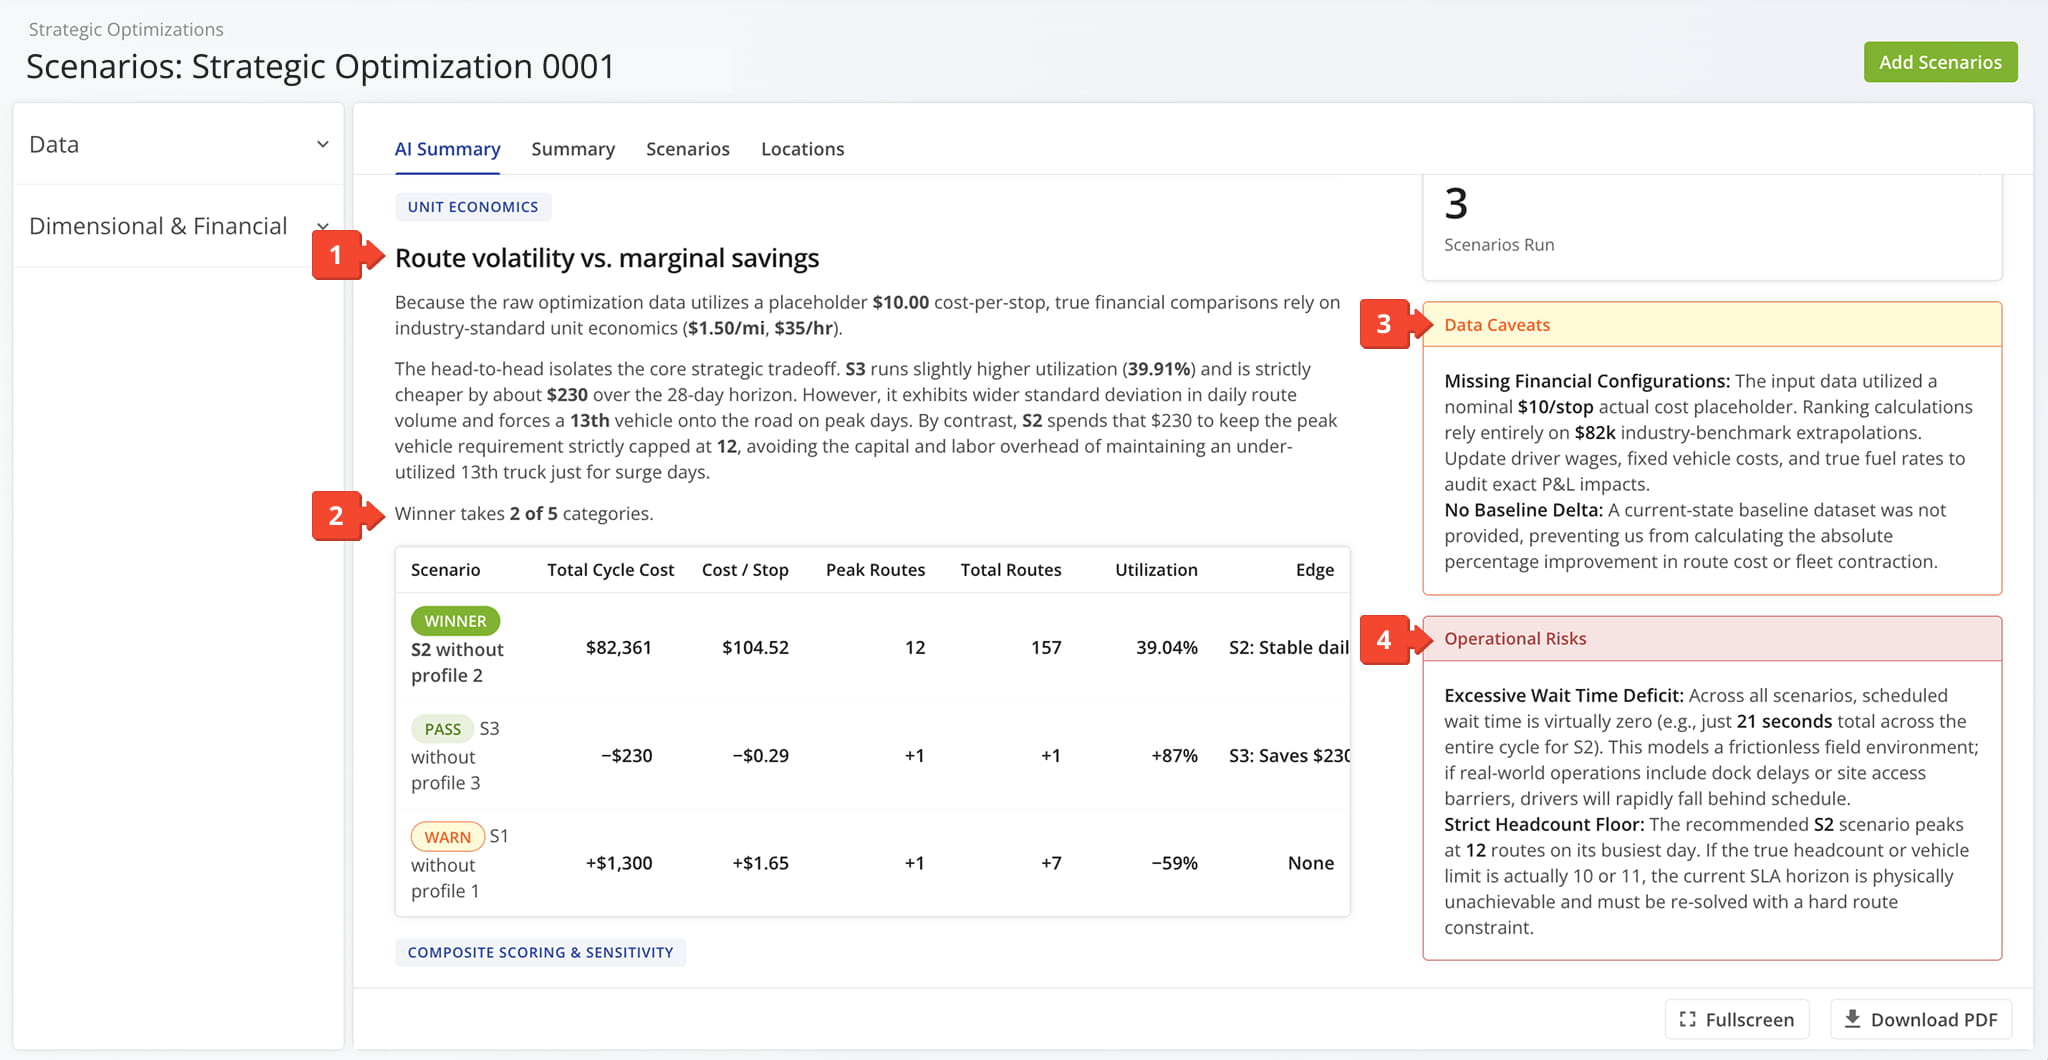
This section of the AI Summary benchmarks financial efficiency across scenarios and highlights data quality issues and operational risks with the following fields:
- Unit Economics: Scenario-by-scenario financial analysis identifying the core cost-efficiency trade-off and strategic rationale behind the recommended plan.
- Scenario Cost Comparison Table: Side-by-side metric breakdown across all scenarios: total cycle cost, cost per stop, peak and total routes, utilization, and competitive edge.
- Data Caveats: Flags missing or estimated inputs that limit the precision of financial outputs, such as placeholder costs or absent baseline data.
- Operational Risks: Critical real-world constraints that could undermine the recommended scenario’s feasibility if not addressed before deployment.
Performance Scoring And Strategic Recommendations
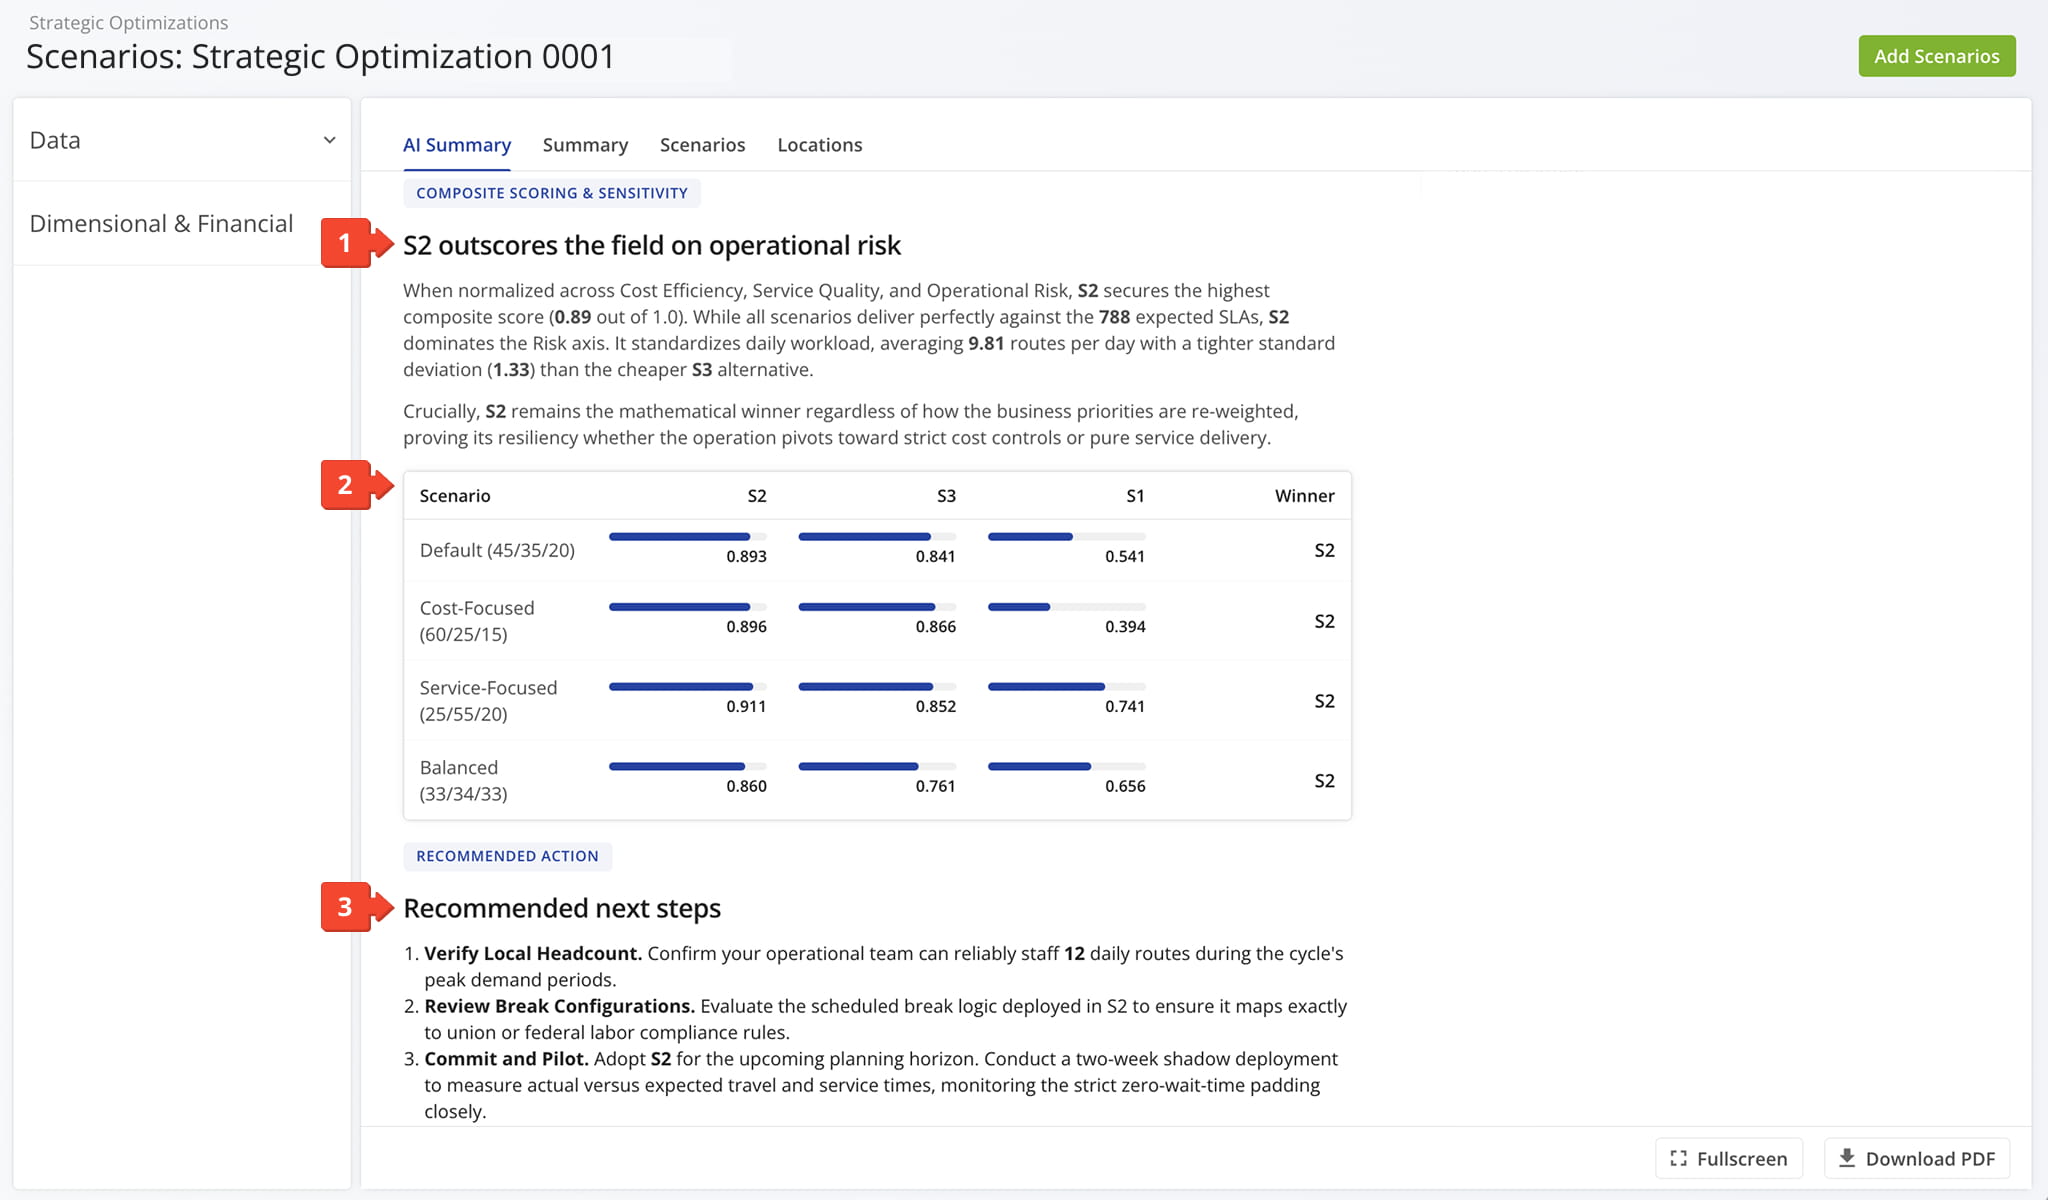
The final section of the AI Summary ranks scenarios across weighted business priorities and provides actionable next steps with the following fields:
- Composite Scoring Narrative: Analysis explaining which scenario dominates across Cost Efficiency, Service Quality, and Operational Risk, and why that conclusion holds regardless of how business priorities are re-weighted.
- Scoring Table: Composite scores for each scenario across multiple weighting profiles (Default, Cost-Focused, Service-Focused, Balanced), confirming the robustness of the winning scenario.
- Recommended Next Steps: Prioritized, actionable deployment tasks to validate and implement the winning scenario before go-live.
NOTE: Always review AI-generated materials carefully before implementing recommendations.
Customize Report Appearance – View As Newspaper, Magazine, And More
At the bottom of the screen, click the Full Screen Button to open an expanded, stylized version of the report.
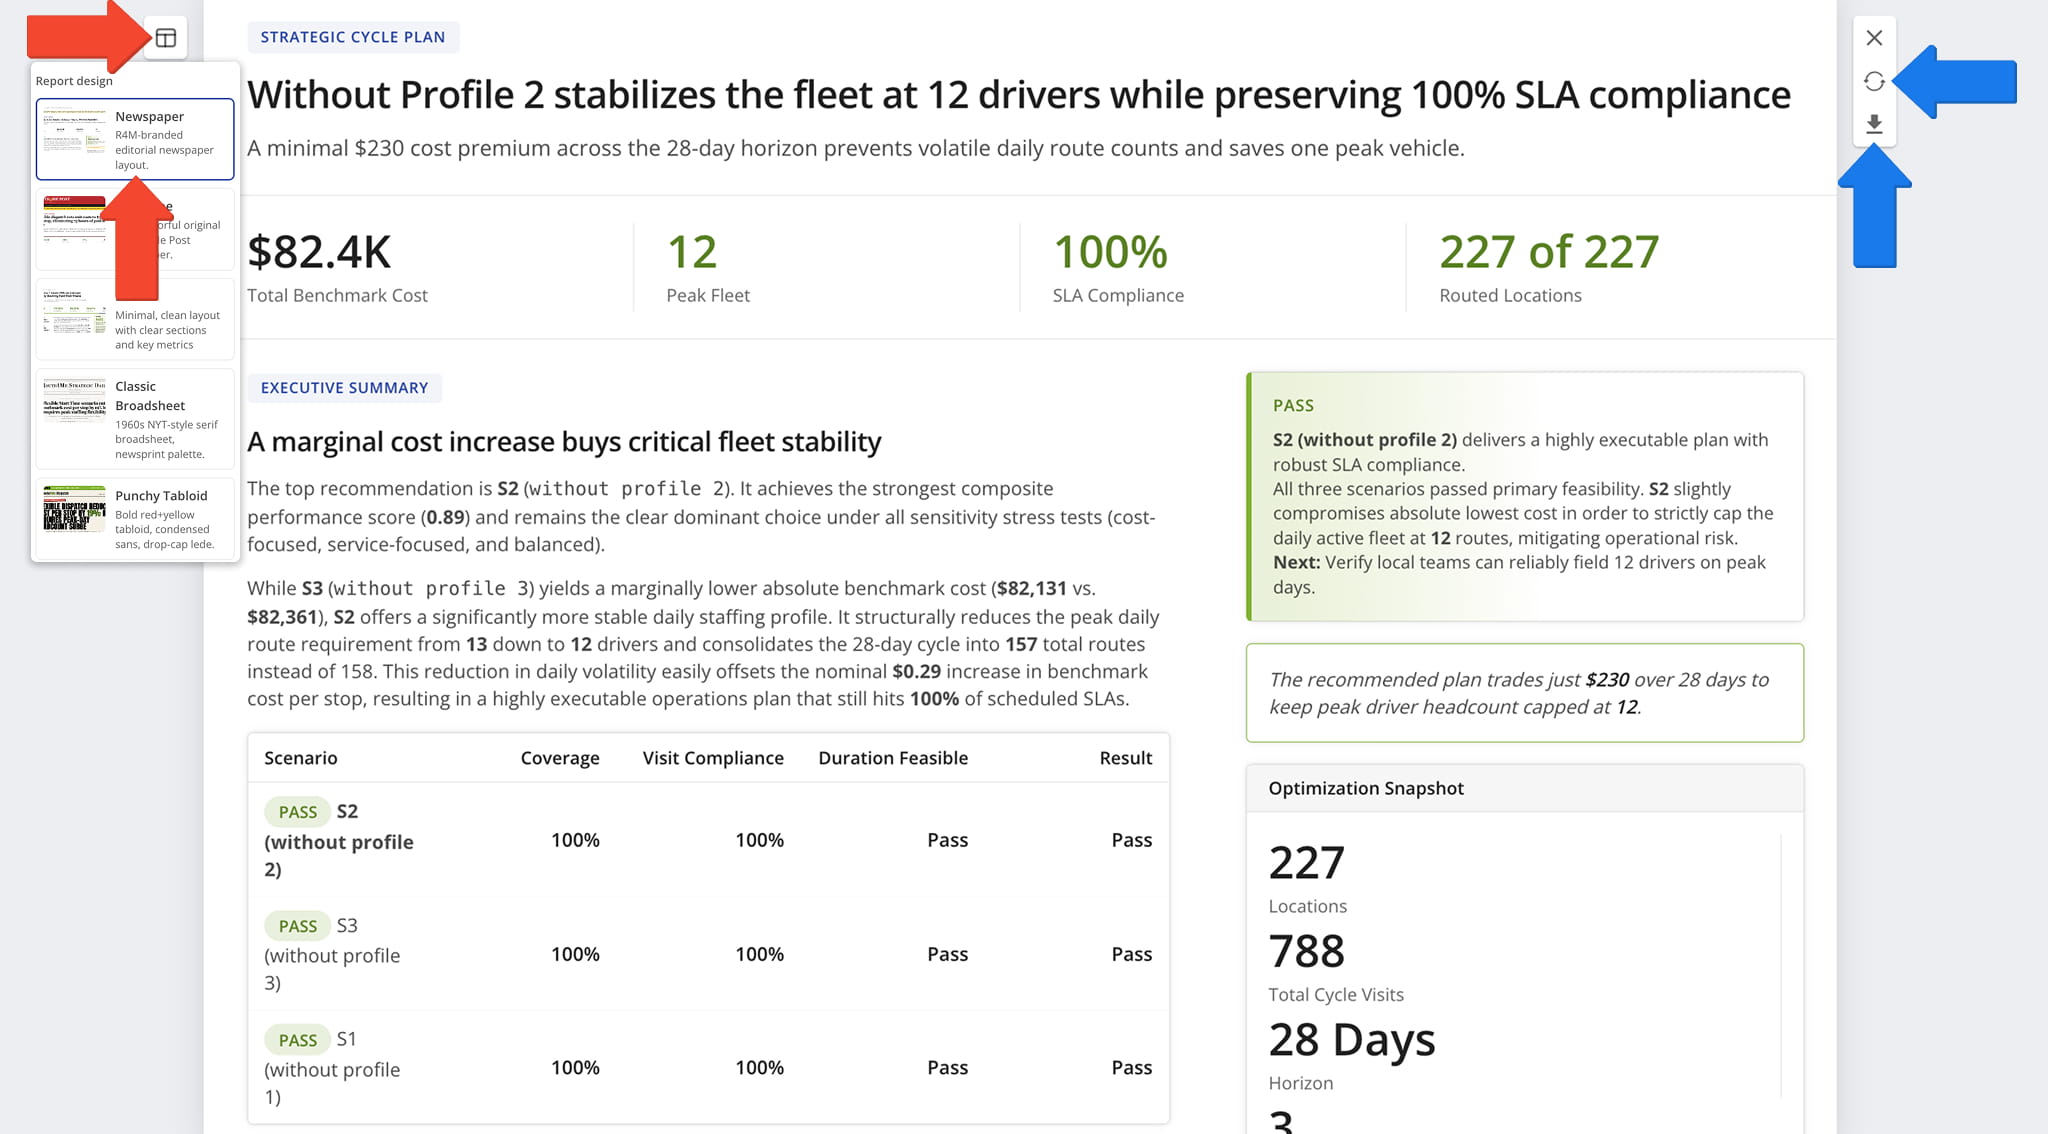
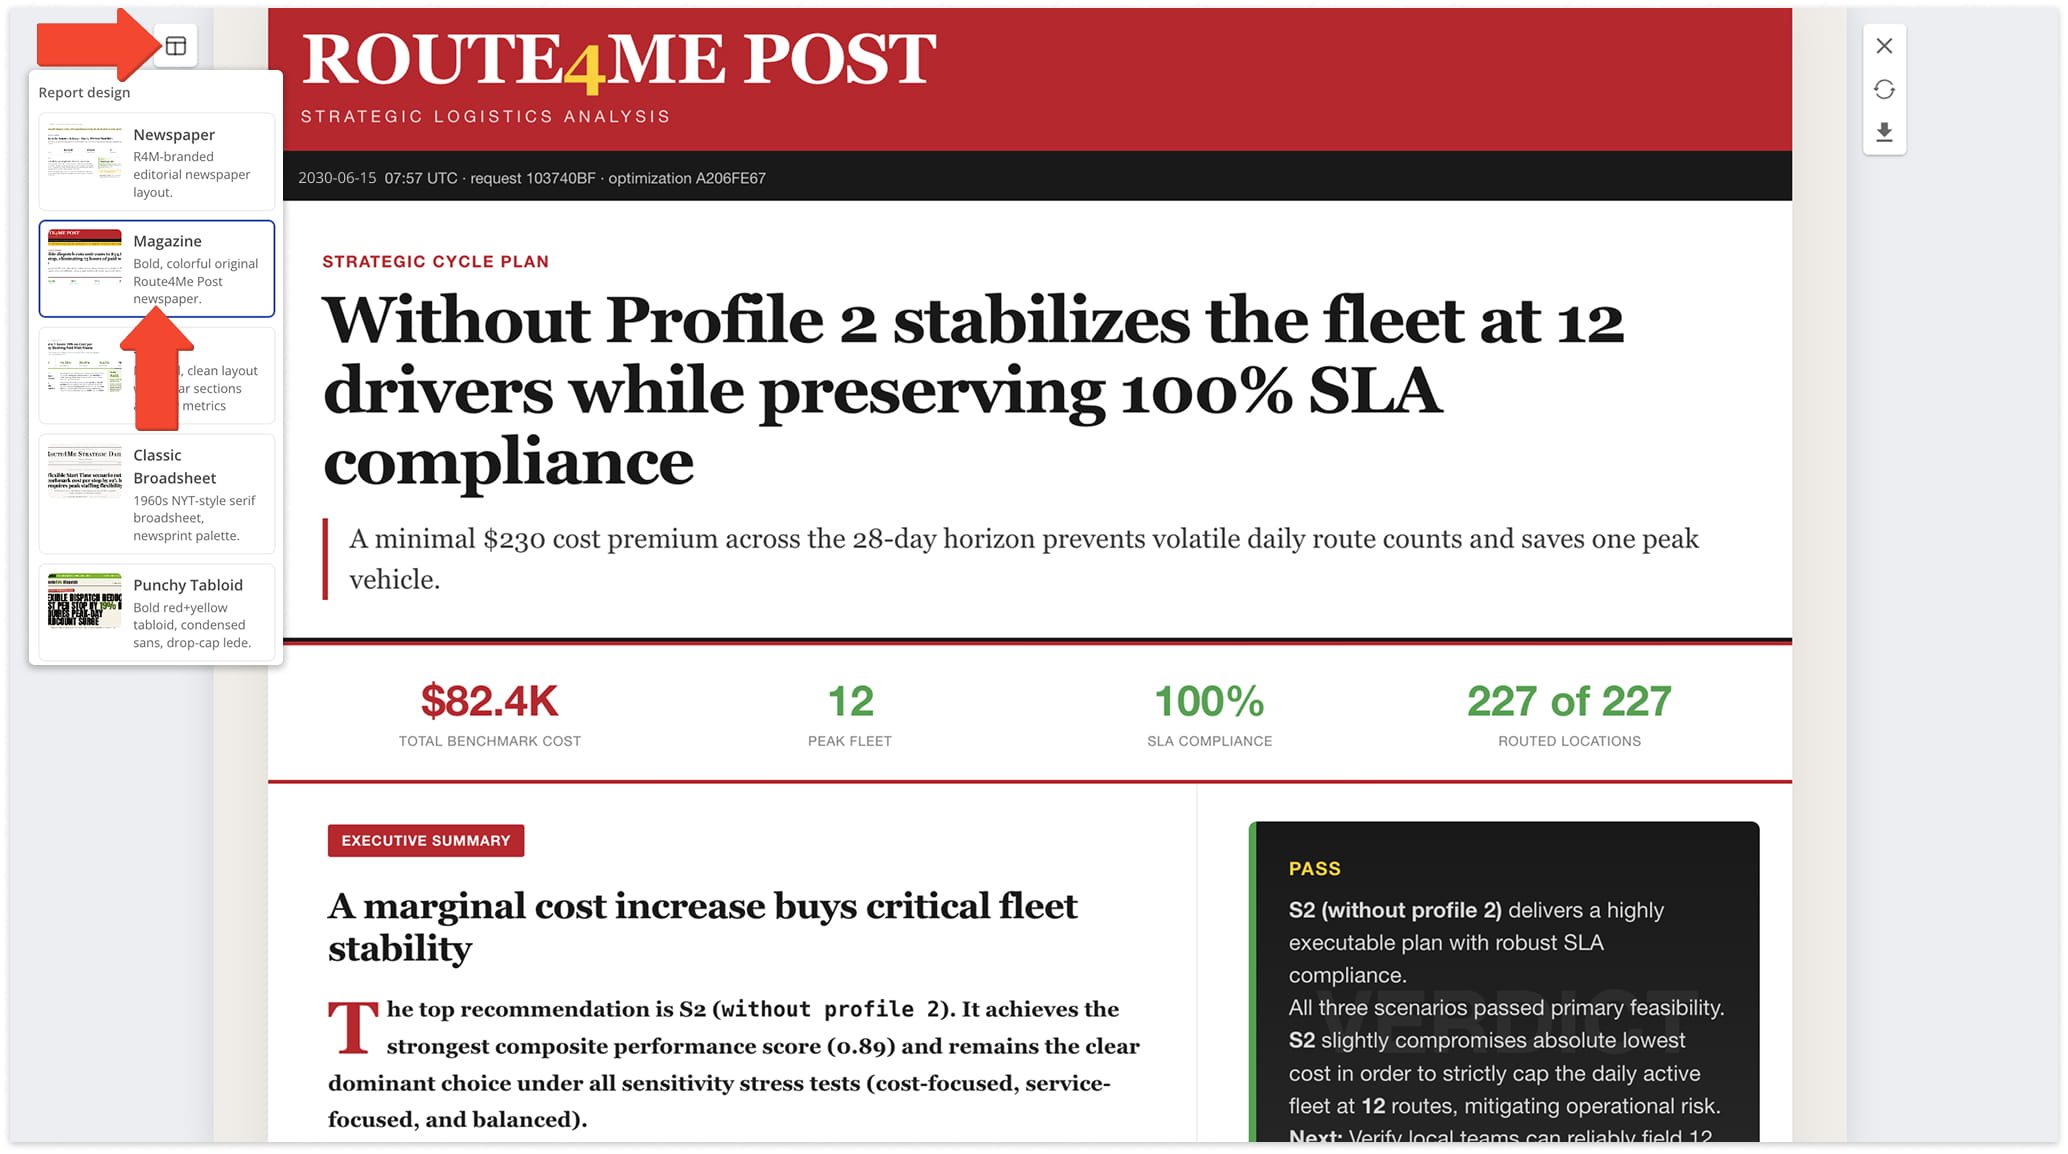
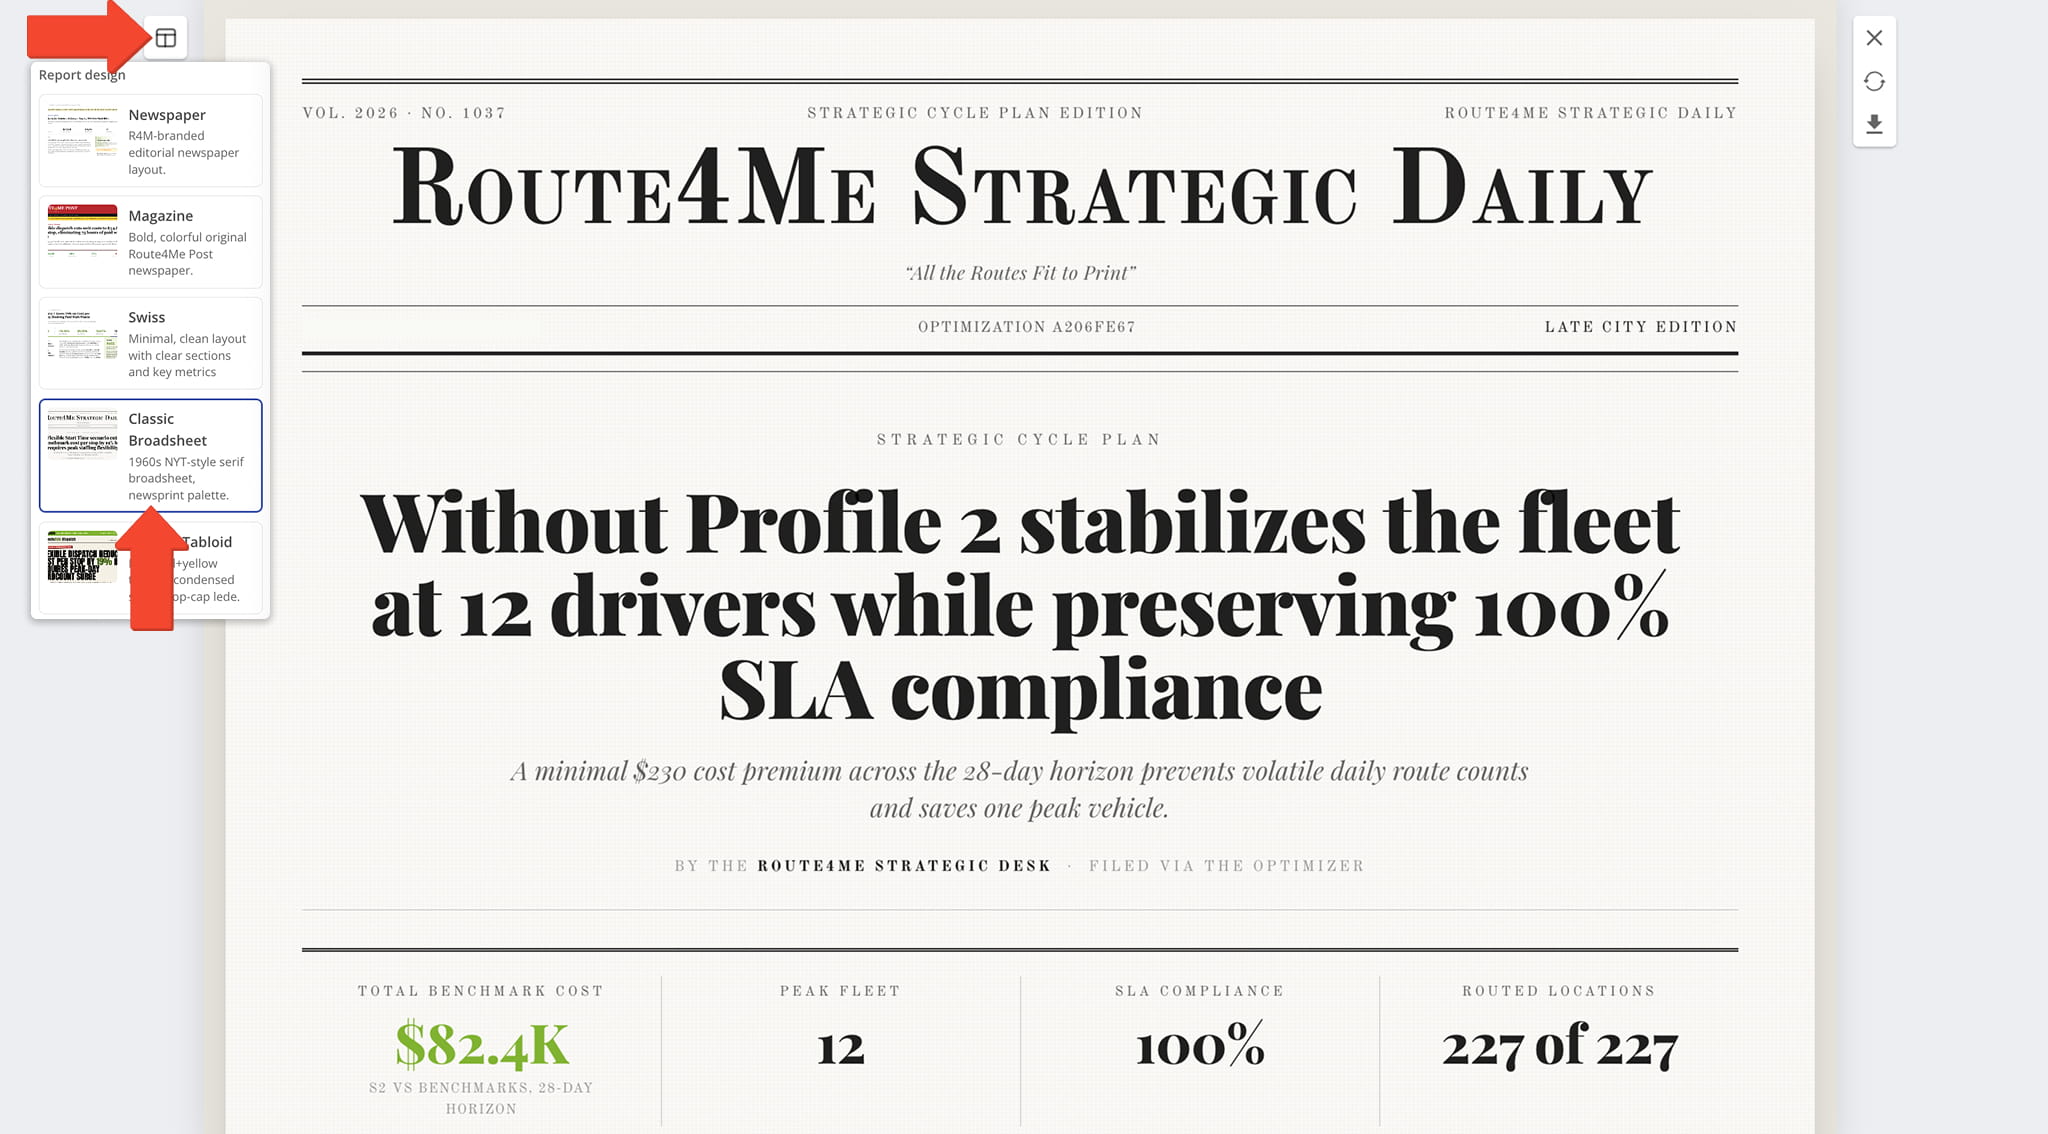
From Full Screen View, click the Report Icon in the upper-left corner to select a report design, some of which are shown below, that presents your optimization news in the format that best matches your audience and presentation preferences.
Newspaper
A clean editorial layout styled after a traditional print newspaper, ideal for a structured, text-forward presentation.
NOTE: From the Fullscreen view of this or any design style you choose, click the Circular Arrow Icon to generate an updated version of the report. Click the Download Icon to export the report in your selected design style.
Magazine
A bold, colorful design with a modern editorial feel, suited for executive briefings and high-visibility presentations.
Classic Broadsheet
A serif-heavy, newsprint-palette layout inspired by legacy publications like the New York Times, lending a formal tone.
Visit Route4Me's Marketplace to Check out Associated Modules:
- Operations
Audit Logging and Activity Stream
- Operations
Custom Data Add-On
- Operations
Advanced Team Management Add-On
About author: Kristian Andreev