
Optimization Snapshot AI Summary – Automated Insights And Reporting
Every time you plan a route, Route4Me automatically creates an Optimization, capturing the parameters and solver logic behind that route. The AI optimization summary brings automated, narrative-driven insights to this data, helping logistics planners understand exactly how the solver reached its result. Built for enterprise business needs, this AI-generated report accelerates data analysis by explaining key constraints, fleet utilization, and cost assumptions in a single, readable format.
Table of Contents
AI Summary Overview – Generating Your Optimization Report
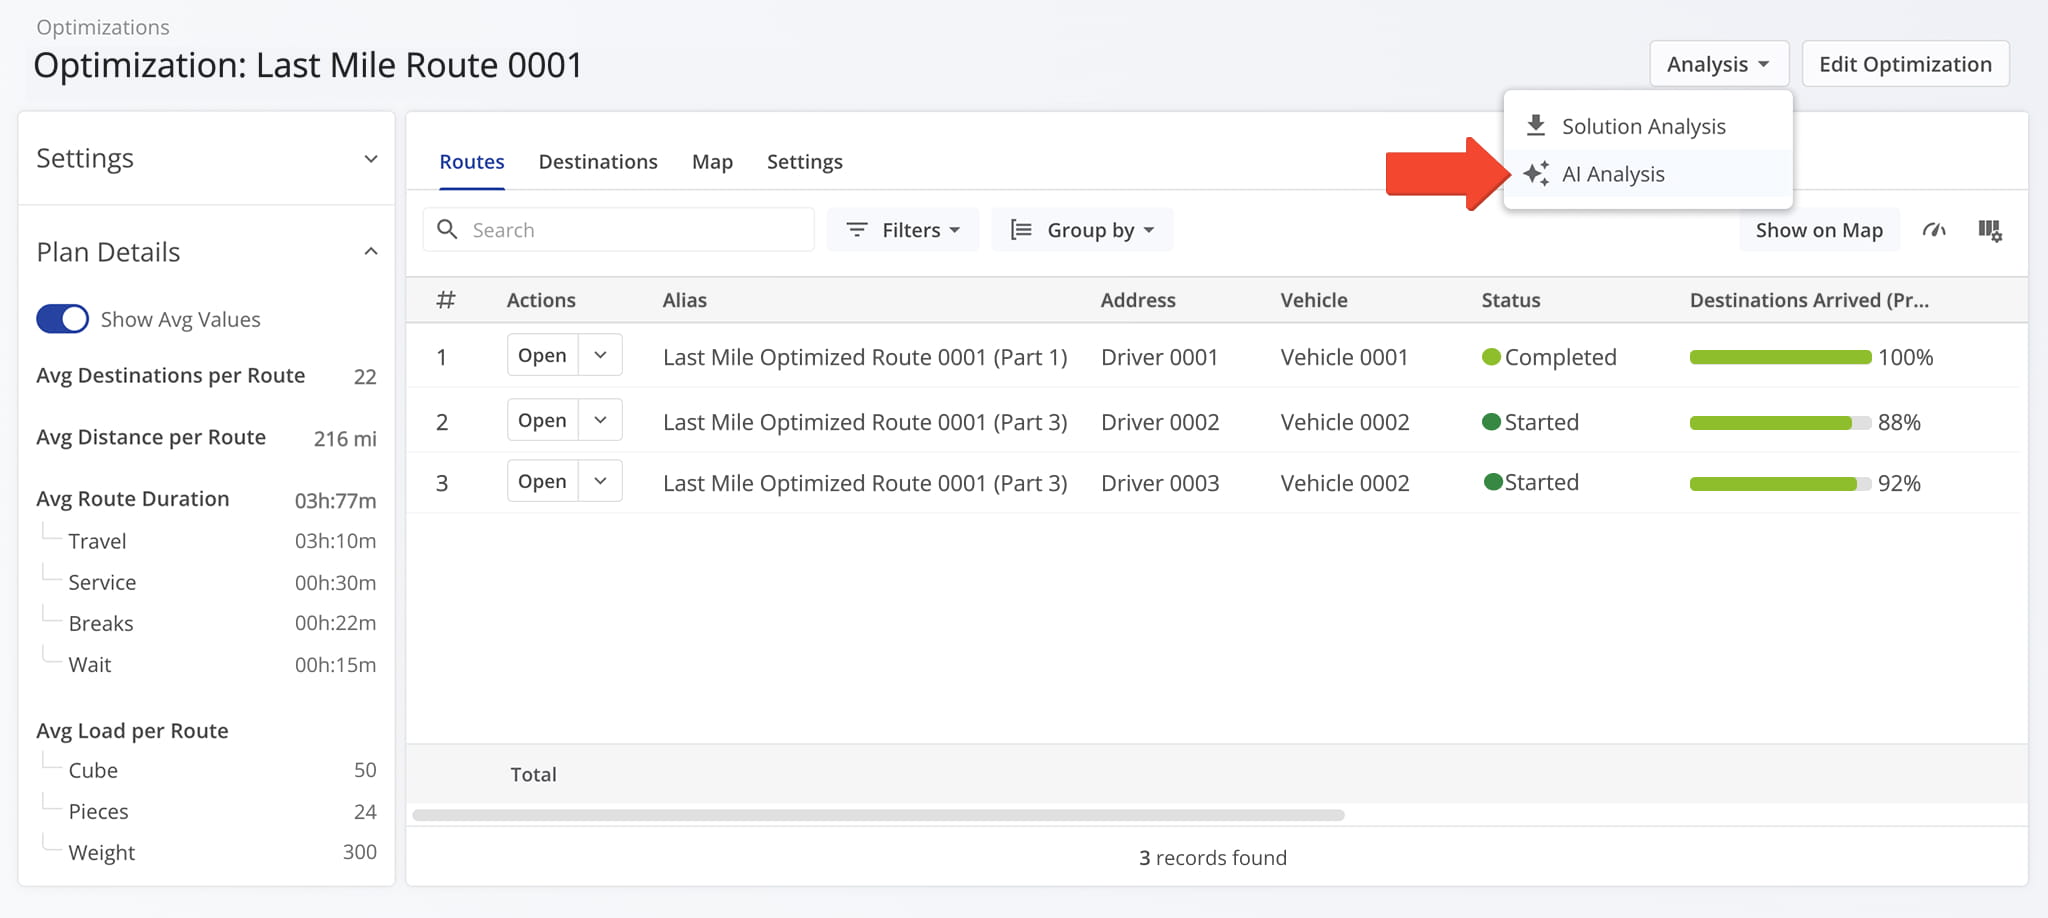
To access the AI-generated report from the Optimization Snapshot, open the “Analysis” menu and click “AI Analysis“.
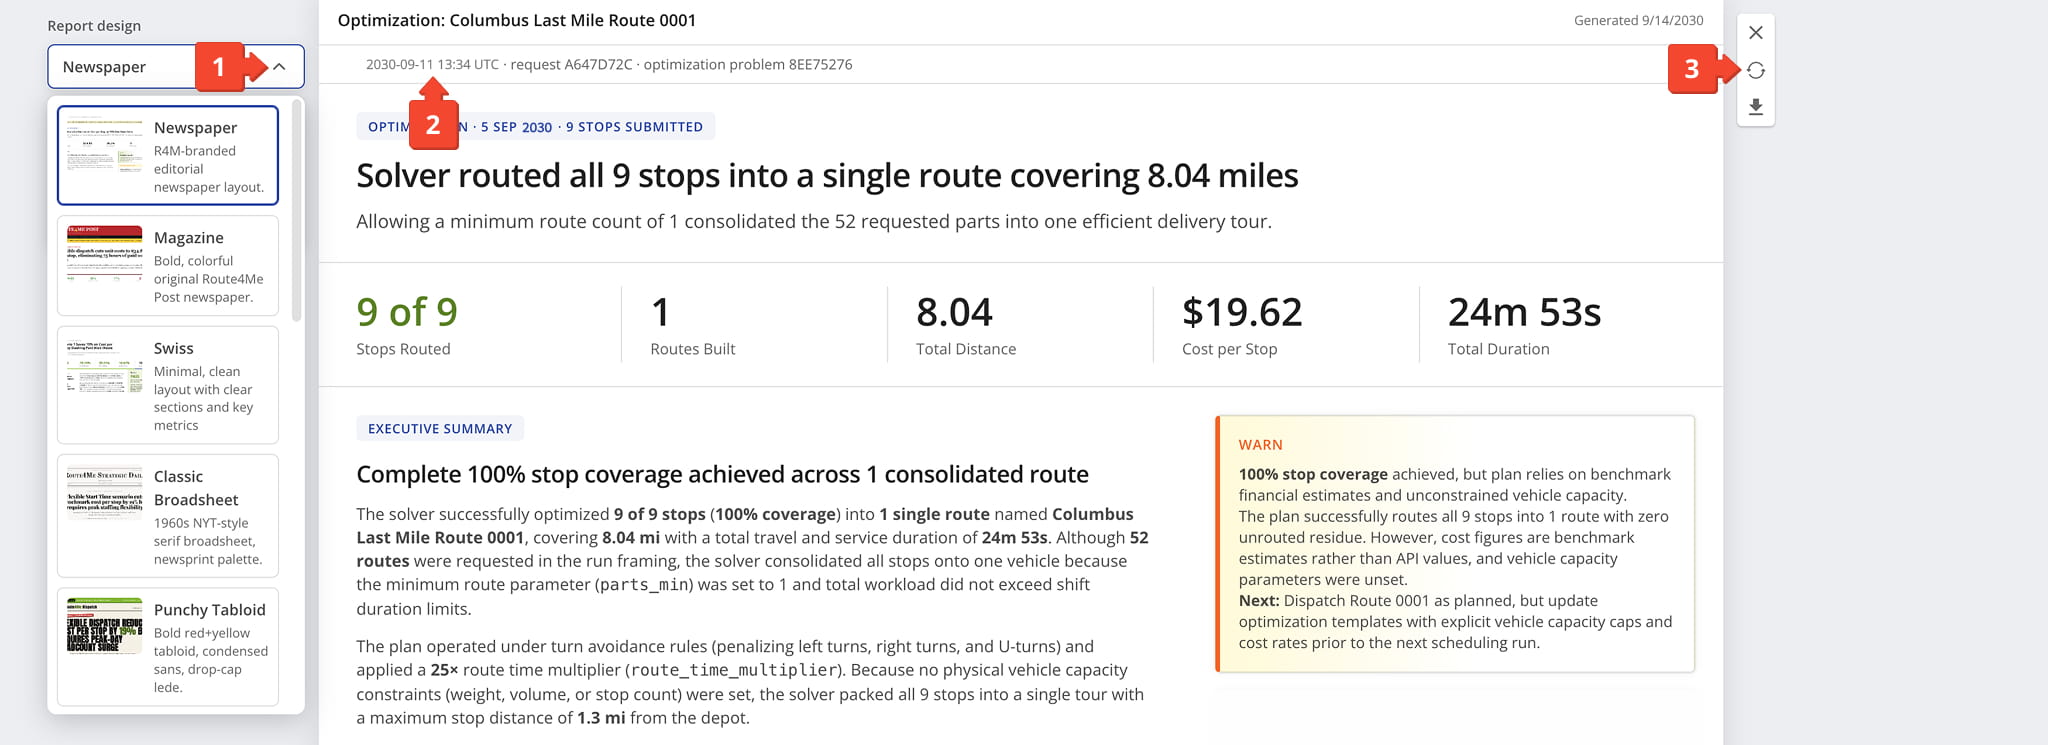
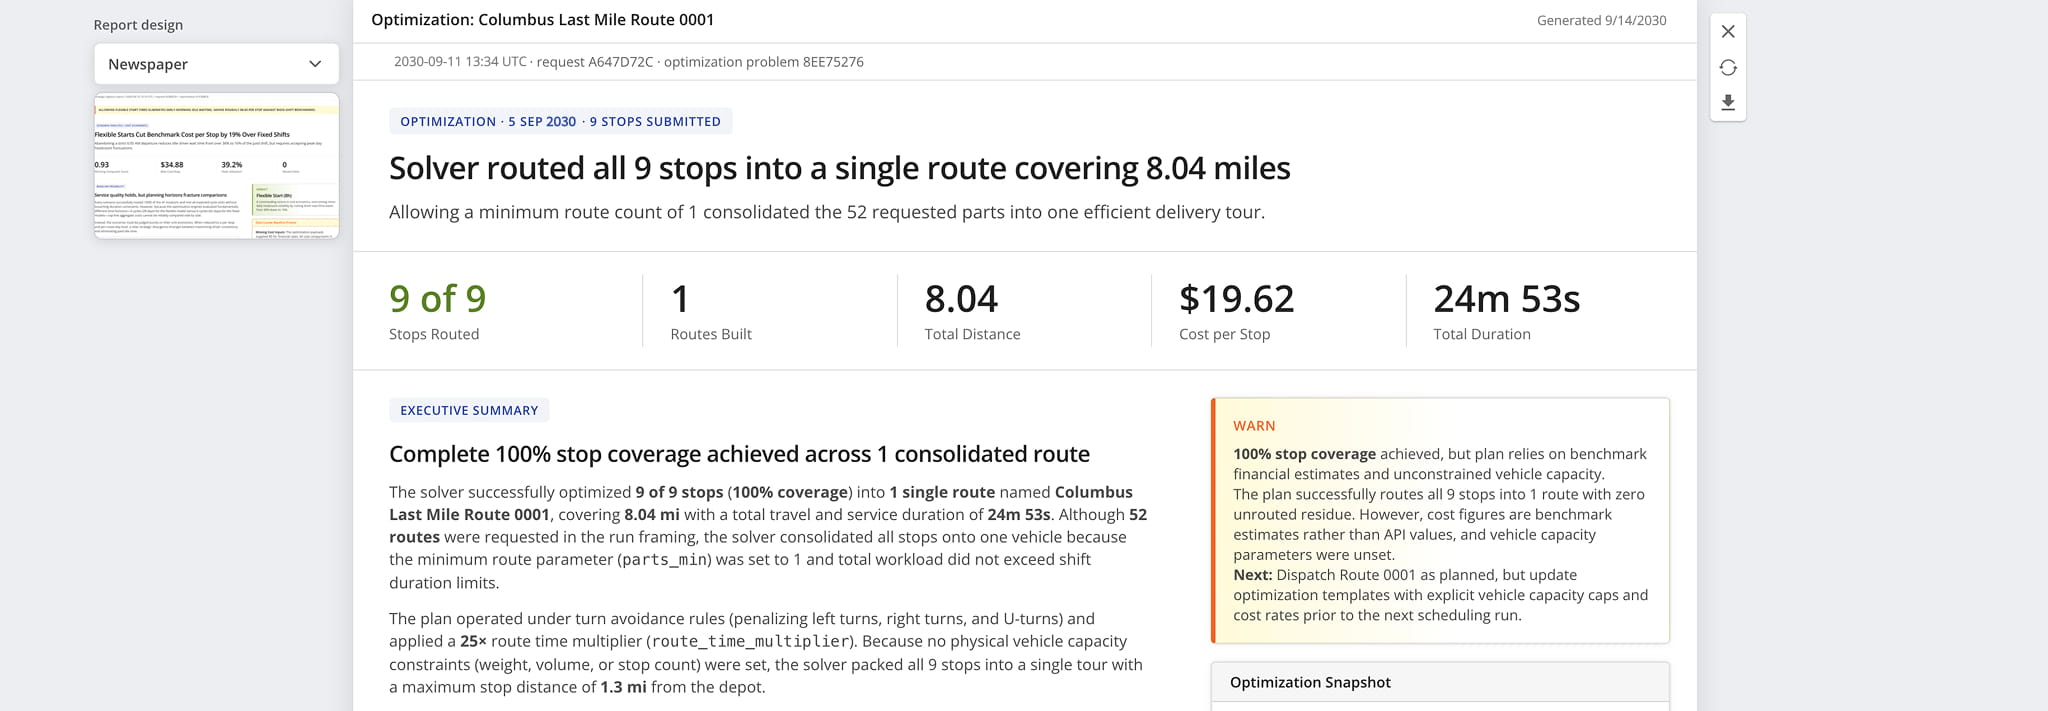
Route4Me automatically generates your report, enabling you to quickly review key strategic insights, optimization results, and operational news at a glance. What you’ll find:
- Report design options which allow you to customize its appearance, described in detail further in this guide.
- A timestamp shows when the summary was generated, along with its associated request and route IDs for reference.
- A control panel from which you can close the report by clicking “X“, regenerate the report by clicking the Circular Arrow Icon, or download a PDF version of the report by clicking the Download Icon.
NOTE: If you modify an Optimization after generating its AI summary, we recommend that you regenerate the report so it provides the most accurate, up-to-date insights.
AI Summary Breakdown – Report Structure And Contents
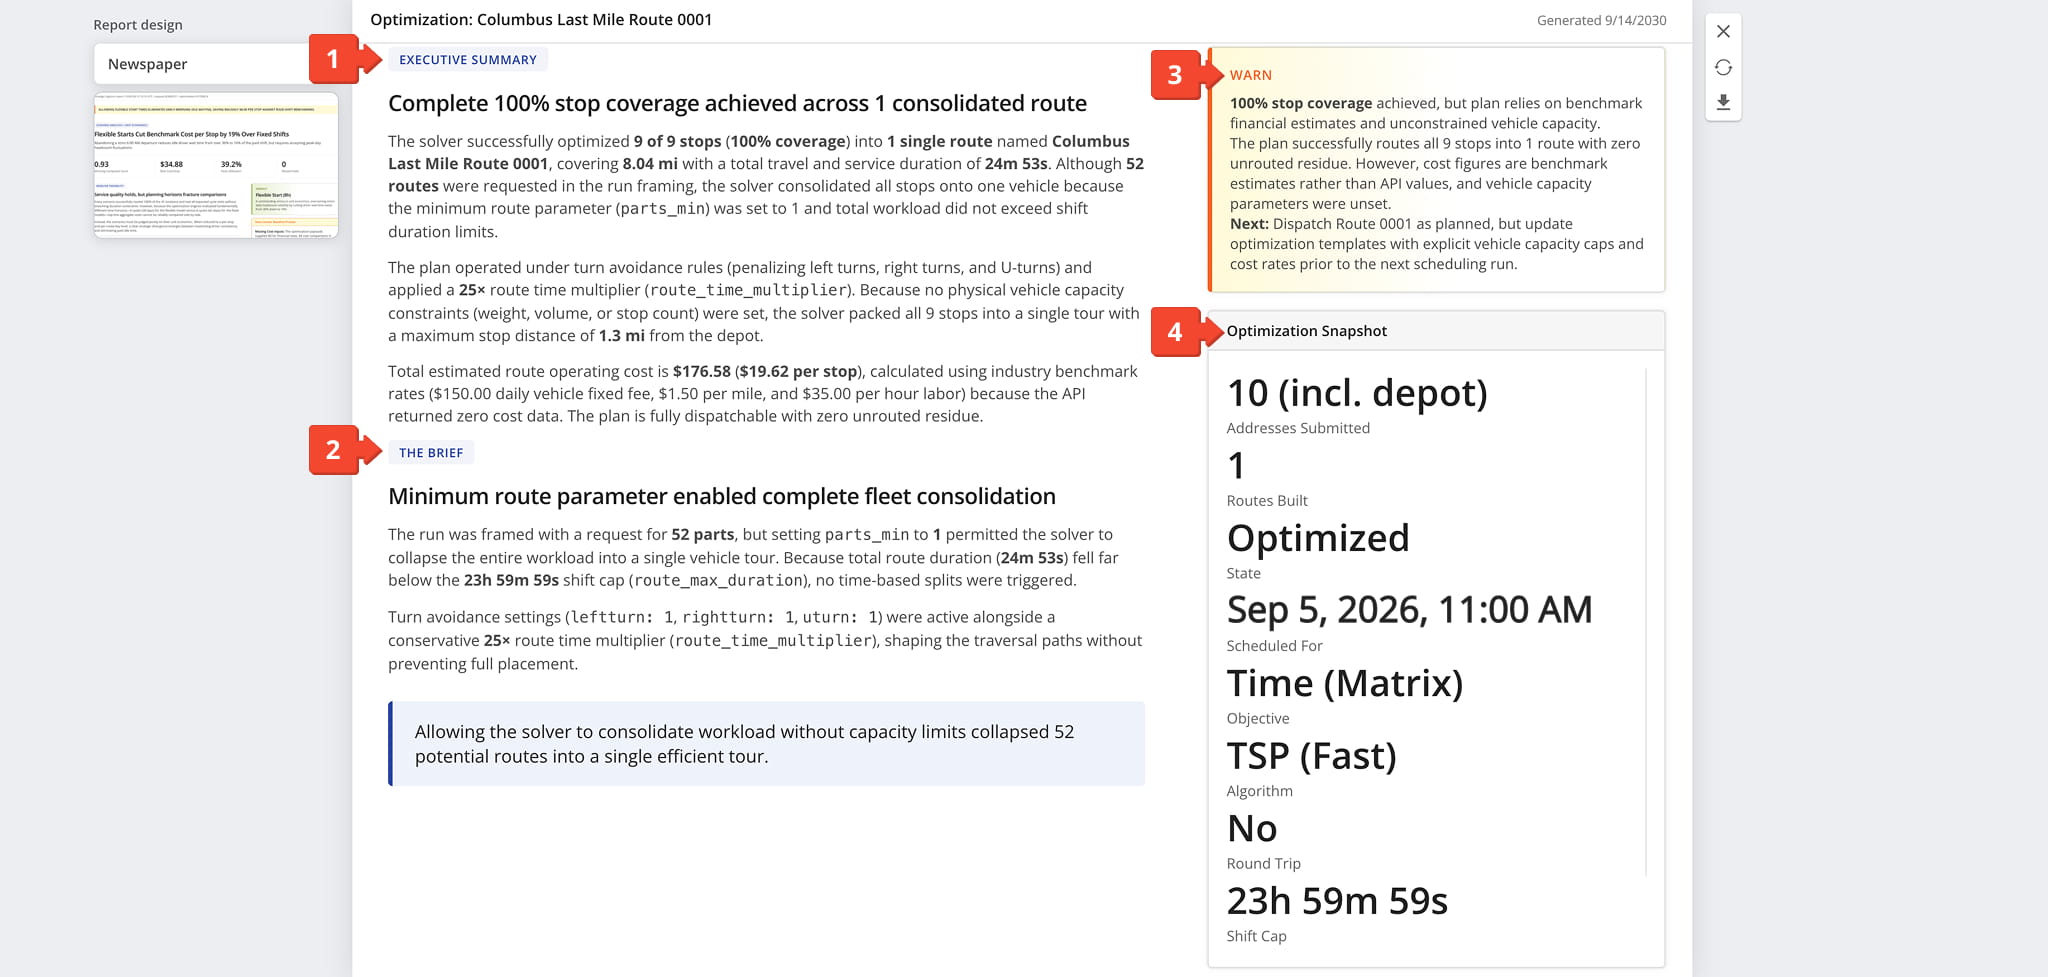
The report is organized into several parts, each covering a different aspect of the Optimization’s performance. Together, they give a complete picture of the Optimization.
Key Optimization Metrics – Stats, Alerts, Optimization Problem ID
The top section of the report identifies the optimization problem and highlights its most notable outcome alongside core solver metrics.
- Optimization Identifier Tag: Label identifying the Optimization ID, submission date, and stop count.
- Summary Headline: Headline and subheadline summarizing the Optimization’s outcome in plain language.
- Core Optimization Metrics: Aggregate metrics covering stops routed, routes built, distance, cost, and duration.

Executive Summary And The Brief – Optimization Findings And Snapshot
- Executive Summary: Condenses the Optimizations’s outcome, including coverage, consolidation, and cost.
- The Brief: Explains the key parameter that shaped the outcome, closing with a one-sentence takeaway.
- Warning Callout: Flags results relying on estimates or unset parameters, with recommended next steps.
- Optimization Snapshot: Summary of the Optimization’s core scheduling and configuration details.
Optimization Constraints – Settings And Data Caveats
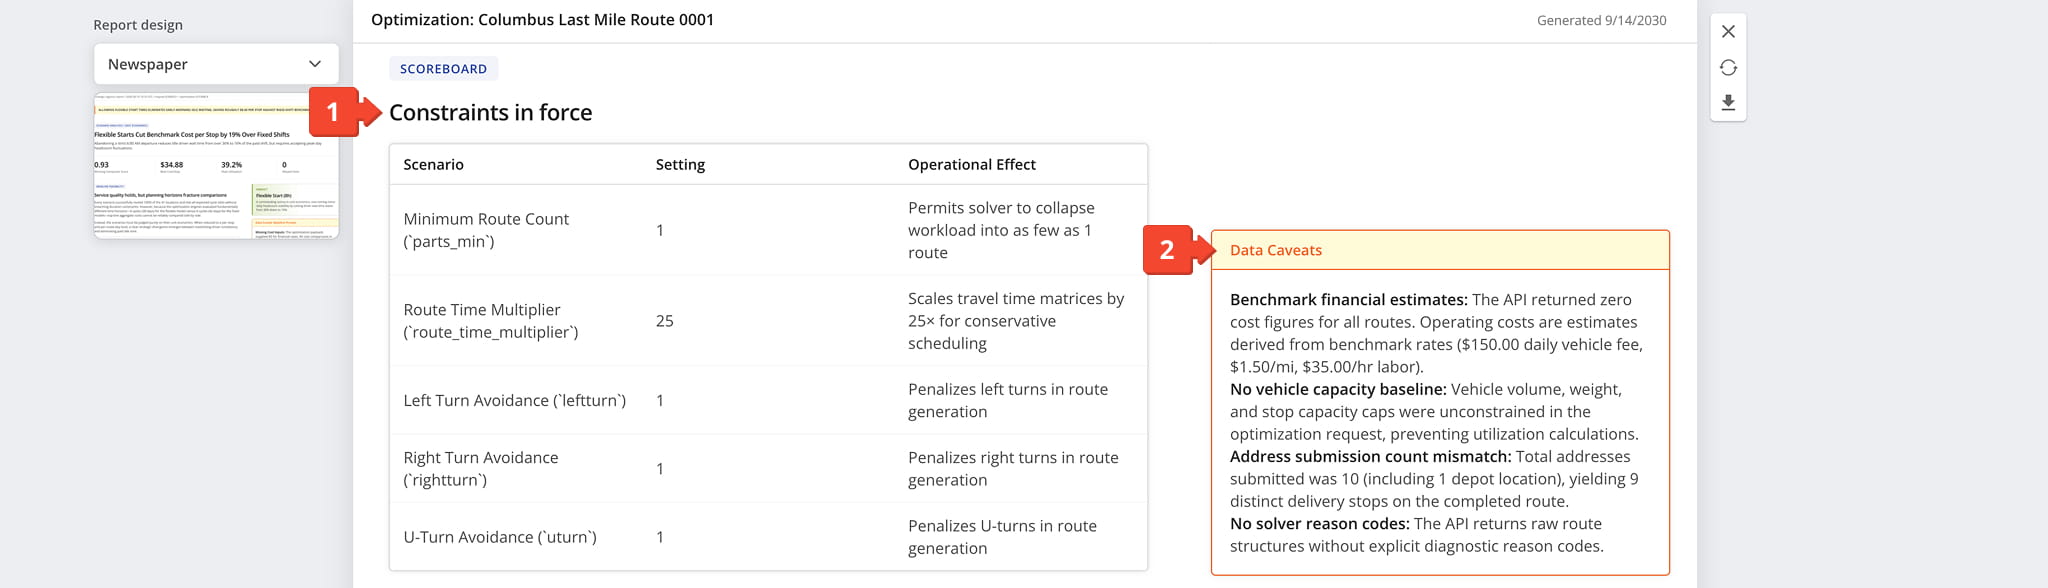
- Constraints In Force Table: List of parameters applied to the optimization and their operational effect.
- Data Caveats: Callout noting limitations or estimates in the underlying data.
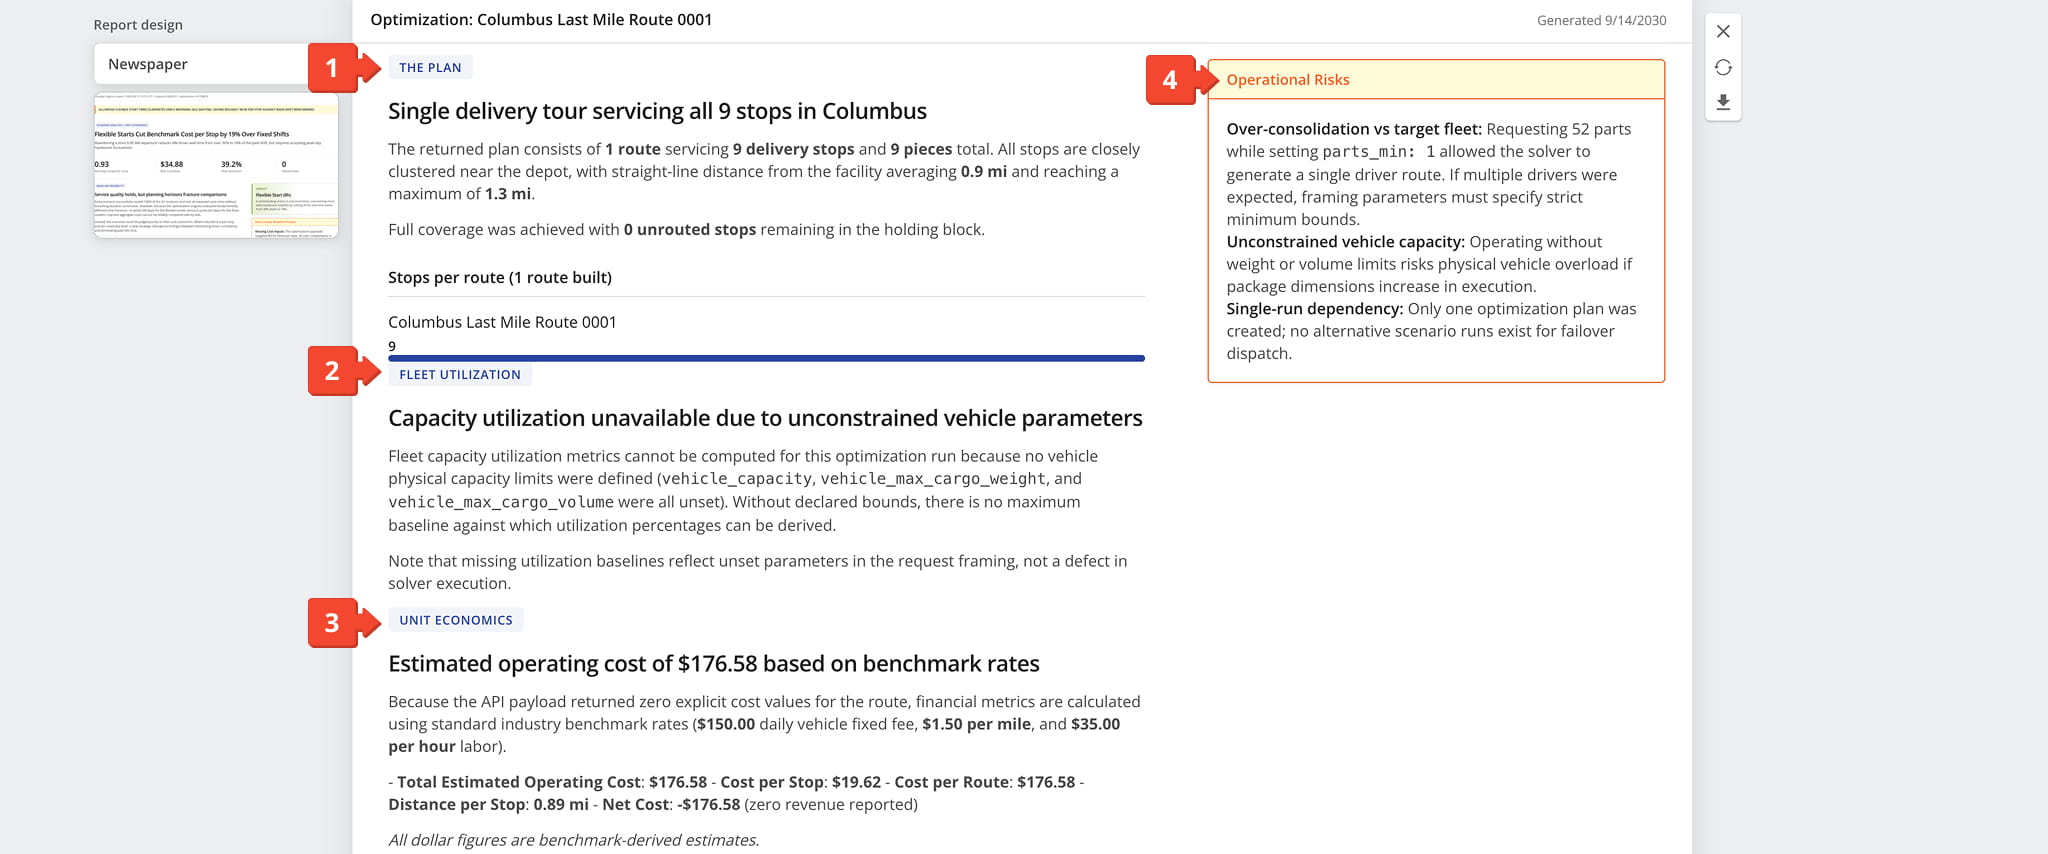
The Plan And Fleet Utilization – Route Composition And Capacity
- The Plan: Describes how stops were distributed across the optimized routes.
- Fleet Utilization Analysis: Assessment of capacity utilization and why it may be unavailable.
- Unit Economics: Explains how the Optimization’s estimated operating cost is calculated, including rates and assumptions used.
- Operational Risks: Callout highlighting planning flaws or unset parameters.
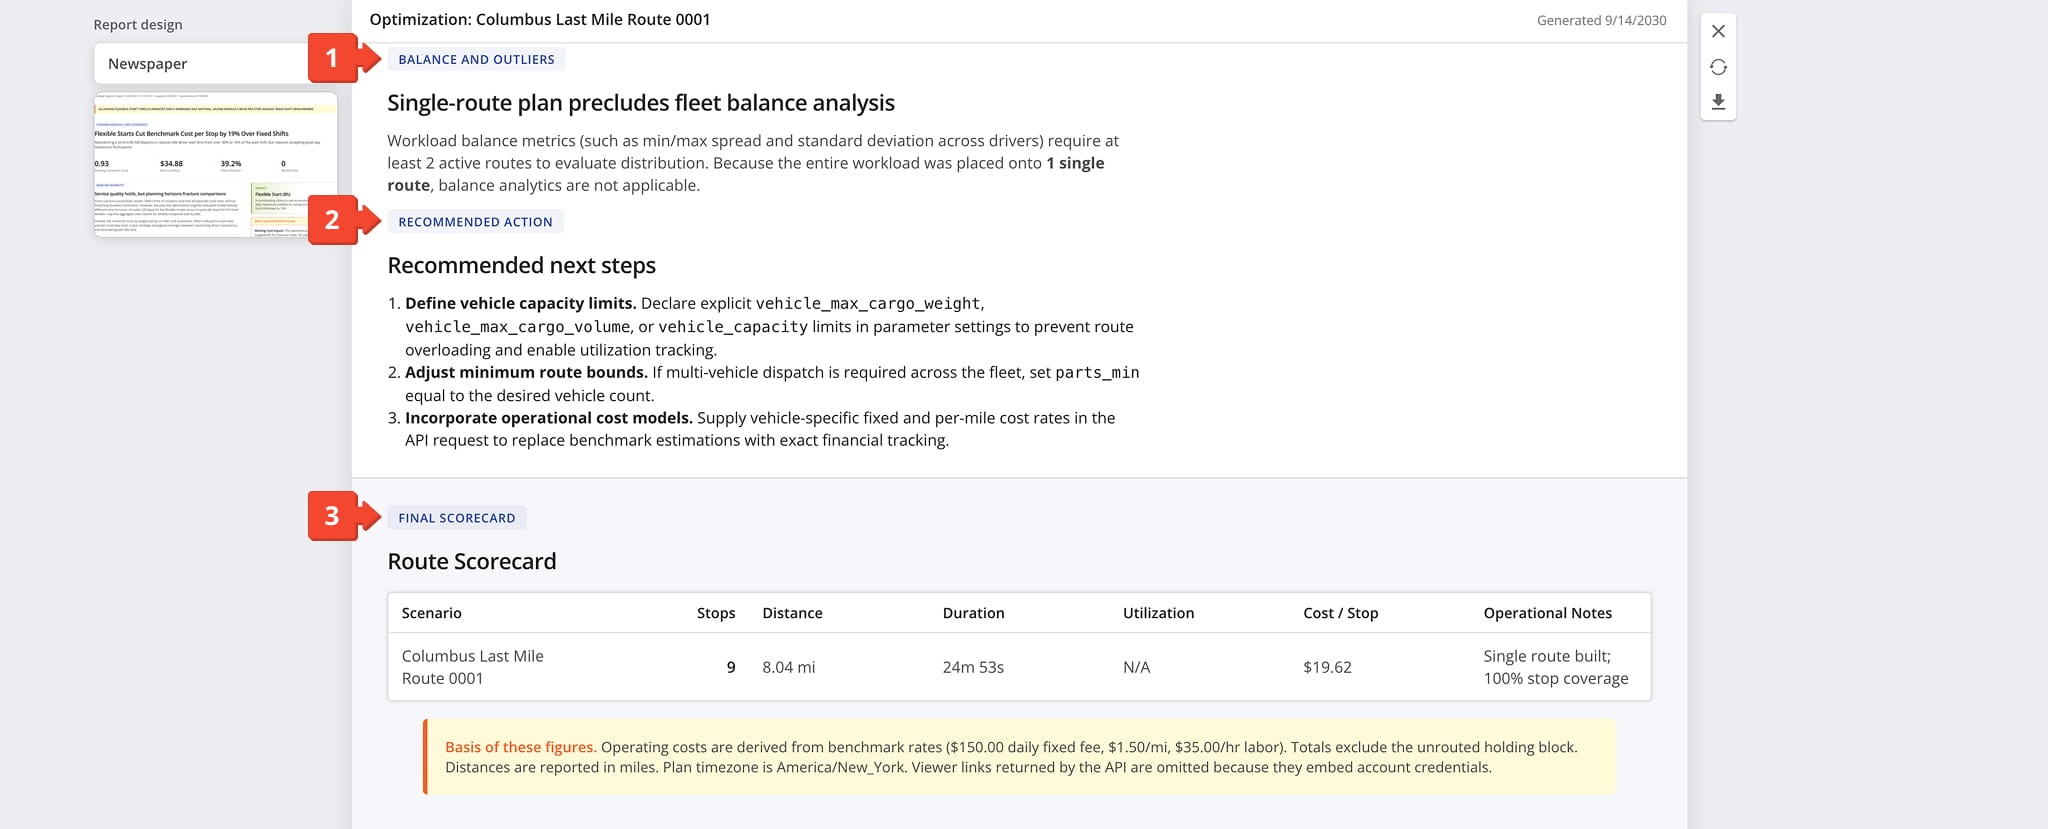
Balance Analysis And Recommended Actions – Next Steps And Route Scorecard
This section evaluates how evenly workload was distributed across routes and closes with prioritized next steps and a summary scorecard.
- Balance And Outliers: Assessment of workload distribution across routes.
- Recommended Next Steps: Prioritized, actionable tasks for improving future optimizations.
- Route Scorecard Table: Summary of each route’s stops, distance, duration, utilization, and cost.
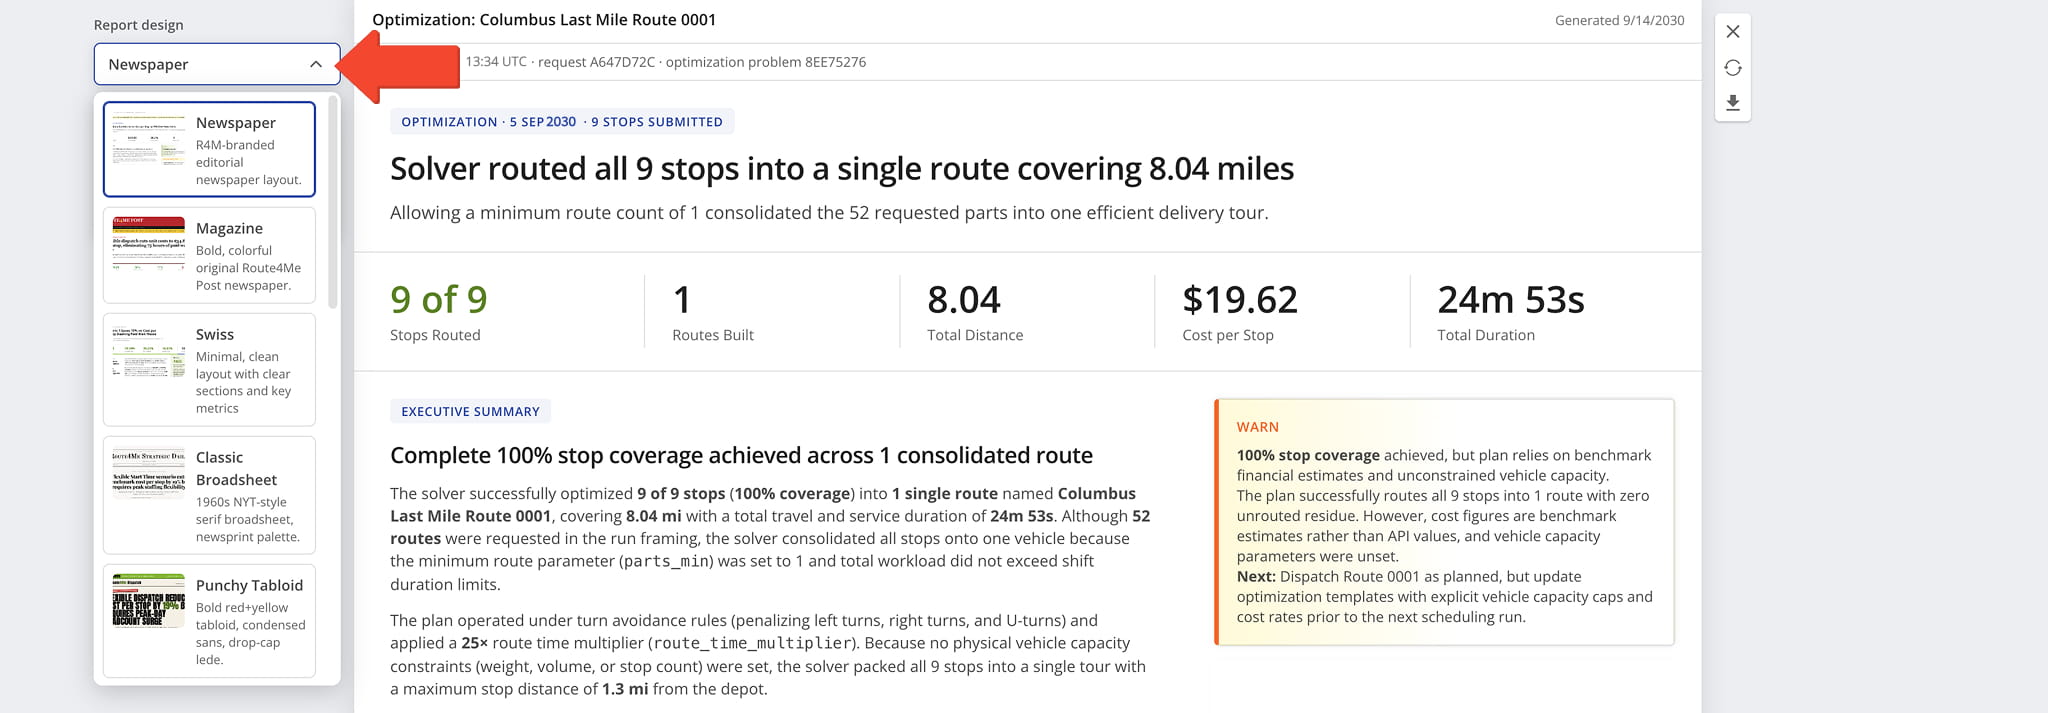
AI Summary Appearance – Customizable Layout Templates
Click the “Report Design” button to adjust the visual style of the AI summary. Options range from Newspaper, Magazine, and Classic Broadsheet to Modern Editorial Magazine Cover and Infographic Dashboard.
Choosing a different layout can make the report easier to scan, present, or share depending on the audience. See the examples below.
Newspaper
A clean editorial layout styled after a traditional print newspaper, ideal for a structured, text-forward presentation.
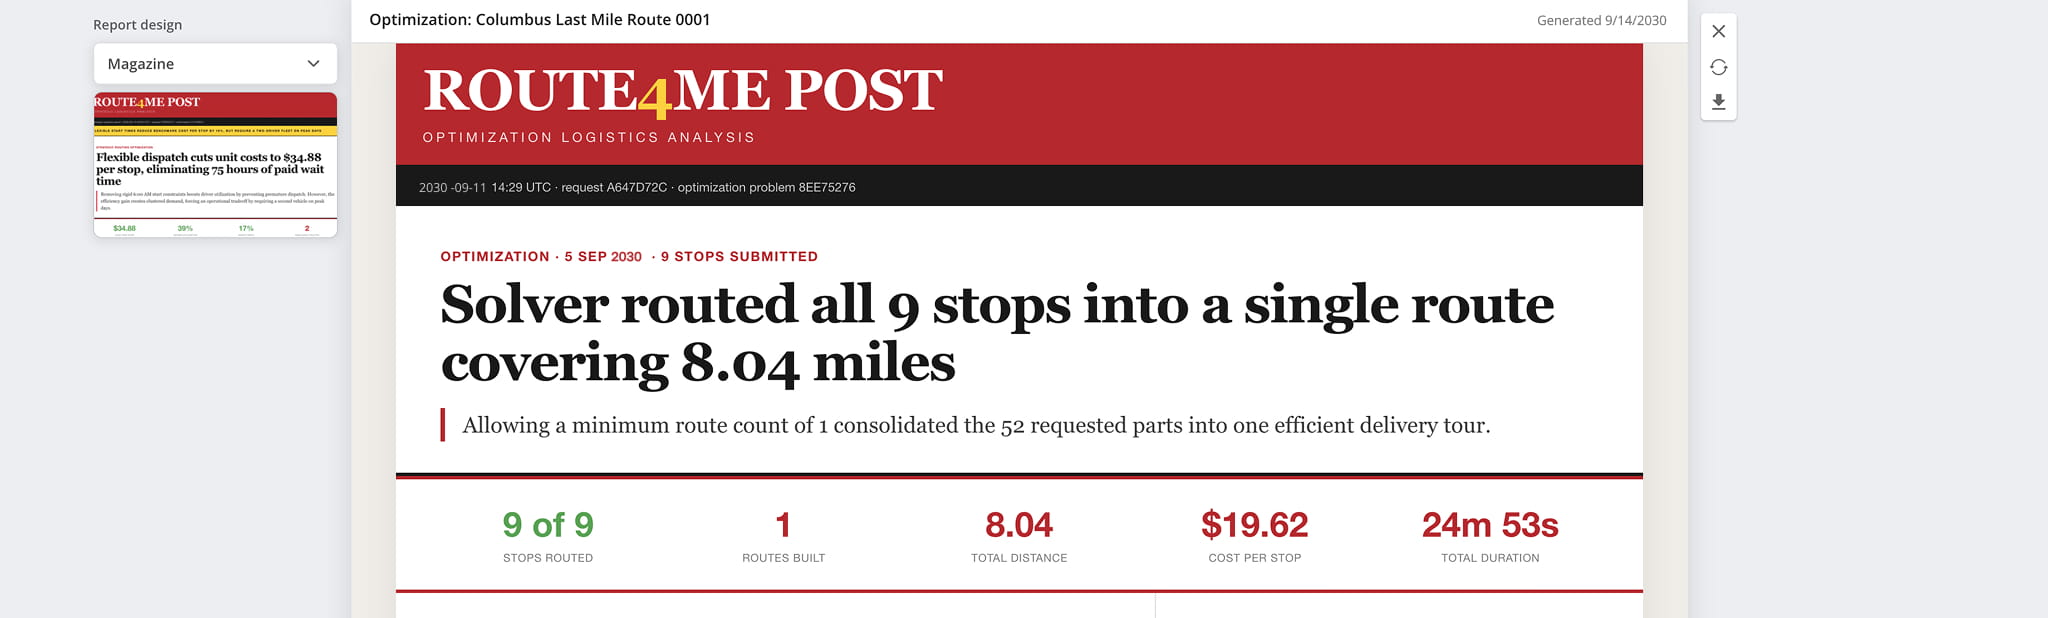
Magazine
A bold, colorful design with a modern editorial feel, suited for executive briefings and high-visibility presentations.
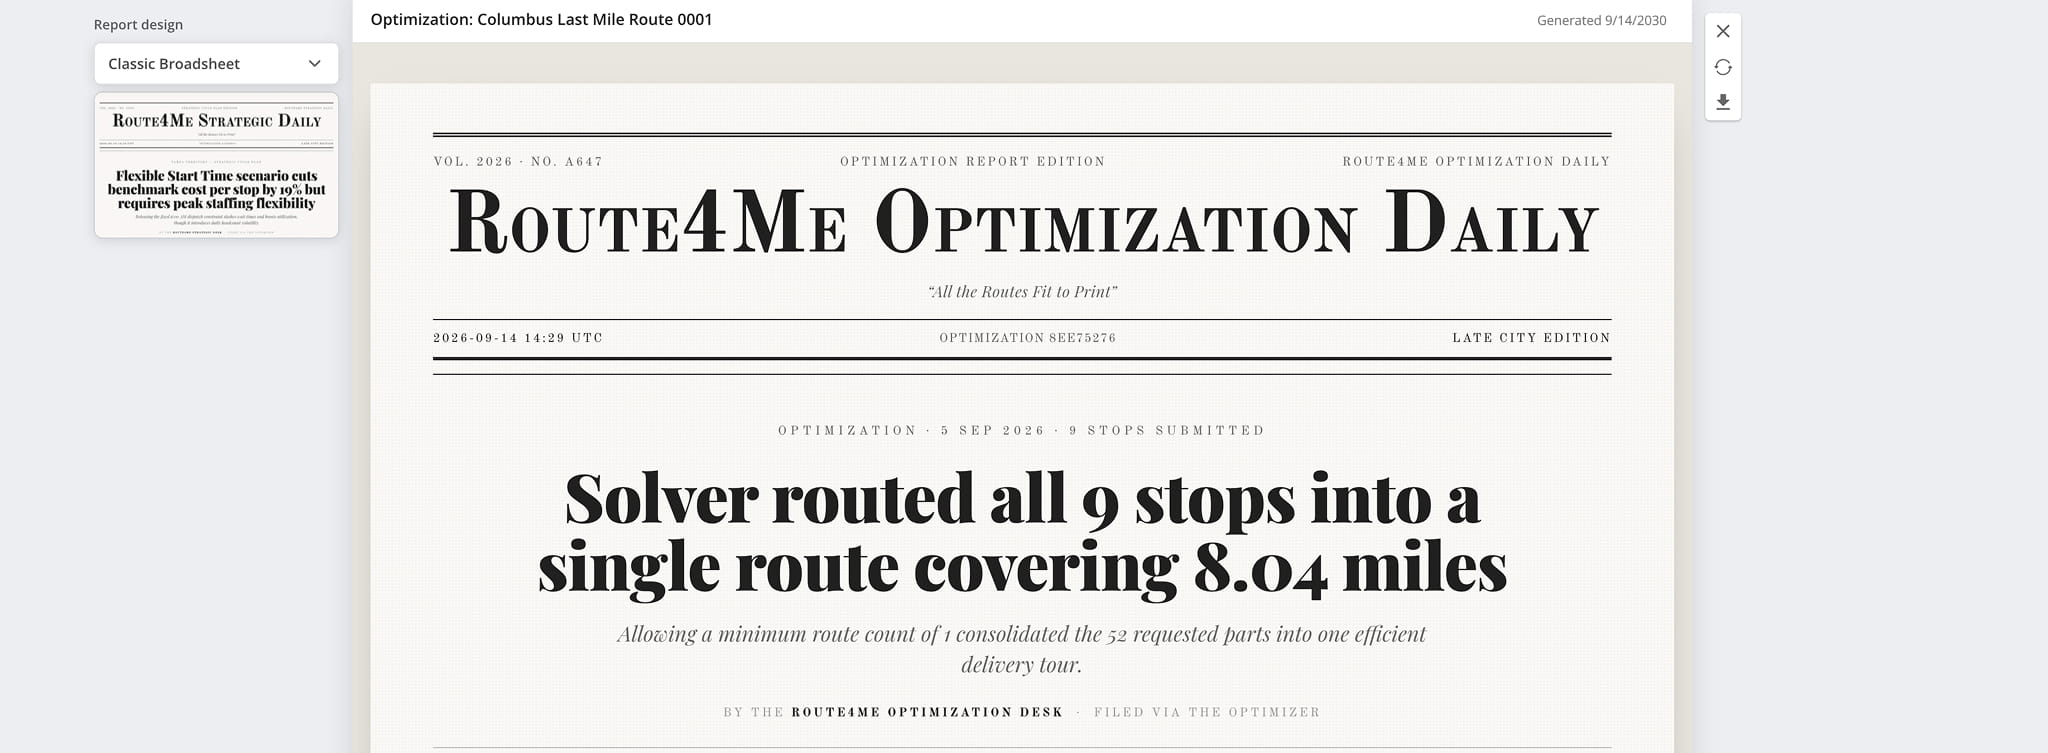
Classic Broadsheet
A serif-heavy, newsprint-palette layout inspired by legacy publications like the New York Times, lending a formal tone.
Visit Route4Me's Marketplace to Check out Associated Modules:
- Operations
Audit Logging and Activity Stream
- Operations
Custom Data Add-On
- Operations
Advanced Team Management Add-On
About author: Daniel Archer