Operations Dashboard – Real-Time Company Performance & Operations Health Overview
The Operations Dashboard gives you a real-time overview of your organization’s last mile performance and operations health. Track User and Vehicle locations on the Live Map, monitor route and destination completion metrics, and stay on top of route, destination, and operational events with a prioritized Activity Feed – all from a single, configurable interface. In this guide, you’ll learn how to set up the Dashboard, track resources on the Live Map, and monitor operational events in real time.
NOTE: Operations Dashboard Resources currently include Routes, Users, Vehicles, Facilities, and Regions.
Table of Contents
Operations Dashboard Overview And Interface Structure
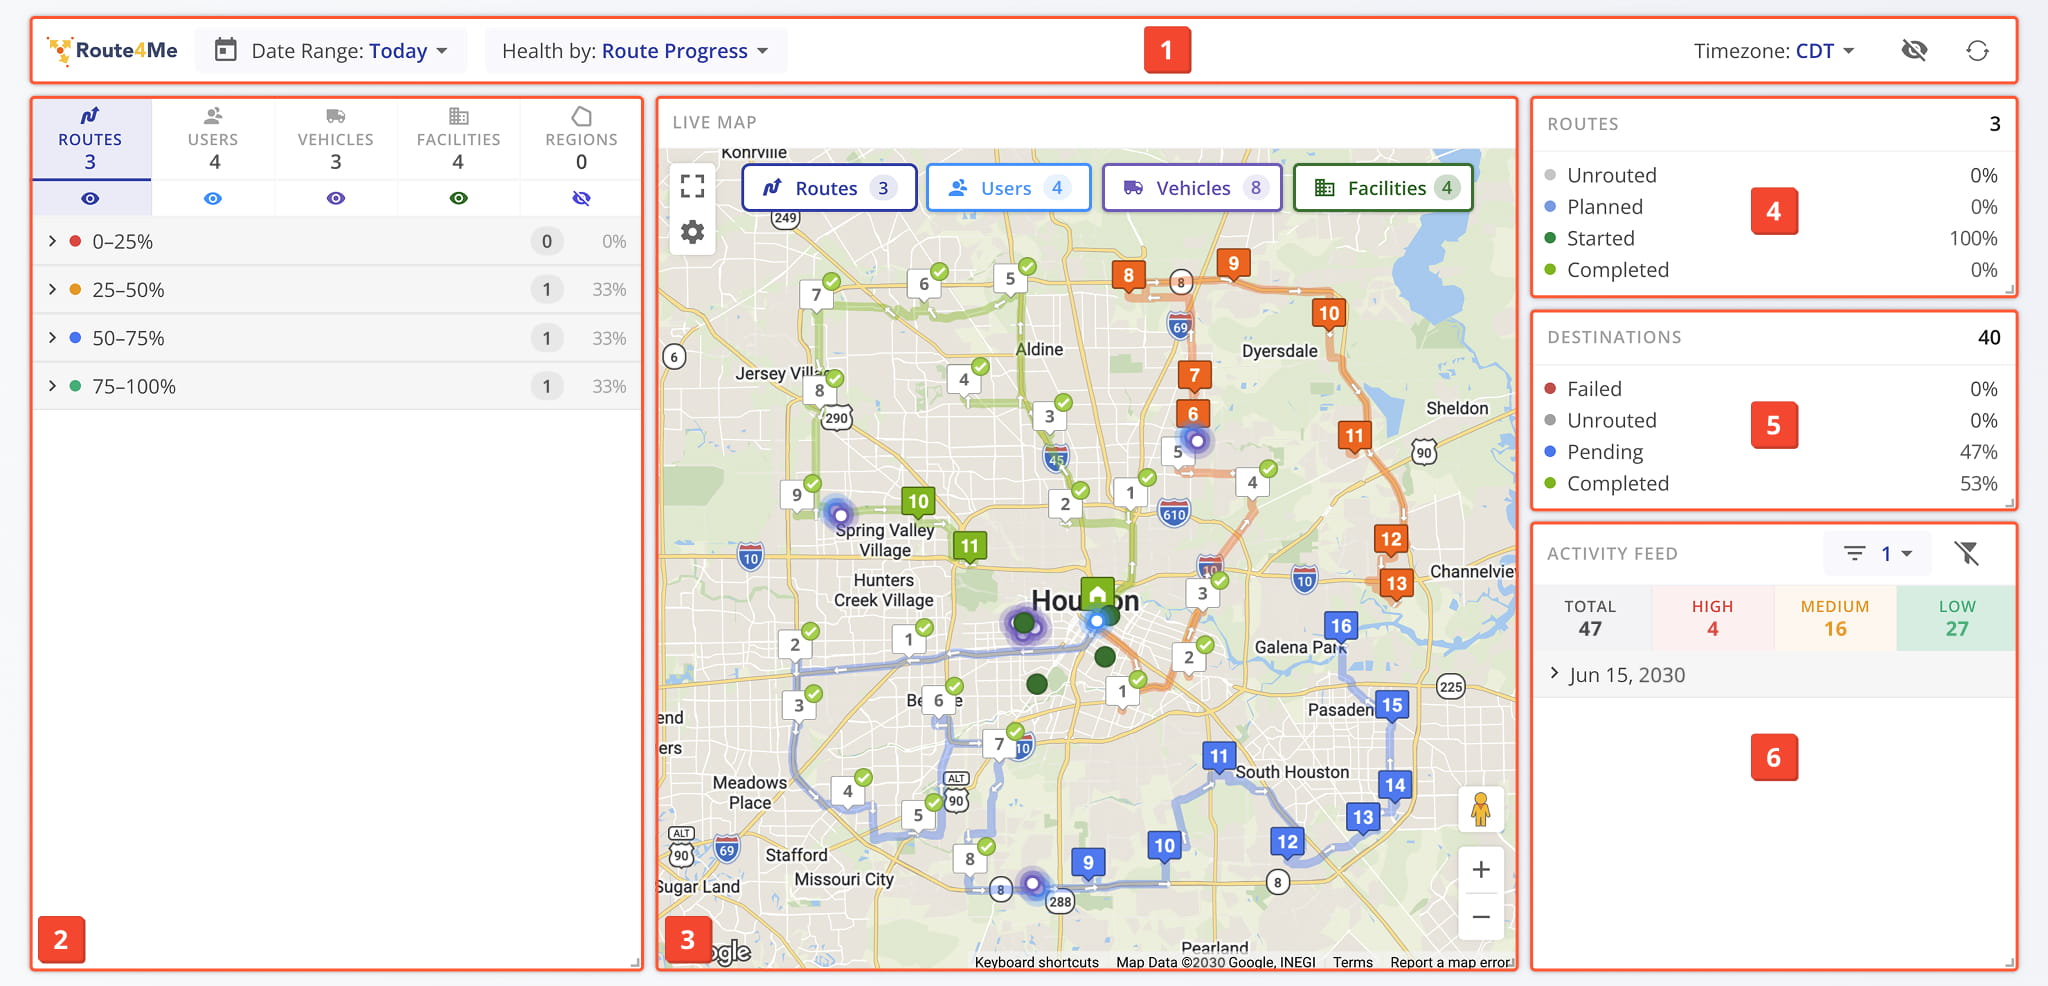
The Dashboard is organized into six core tools that work together to provide full visibility into your last mile operations:
- Header: Top bar where you can configure dashboard settings.
- Resource List: Side bar where you can toggle resource visibility for the Live Map.
Dashboard resources include Routes, Users, Vehicles, Facilities, and Regions. - Live Map: Shows the most recently synced locations of resources enabled on the dashboard.
- Routes: Status tracking panel showing route status distribution across Routes scheduled for the selected Date Range.
- Destinations: Status tracking panel showing the destination status distribution across Routes scheduled for the selected Date Range.
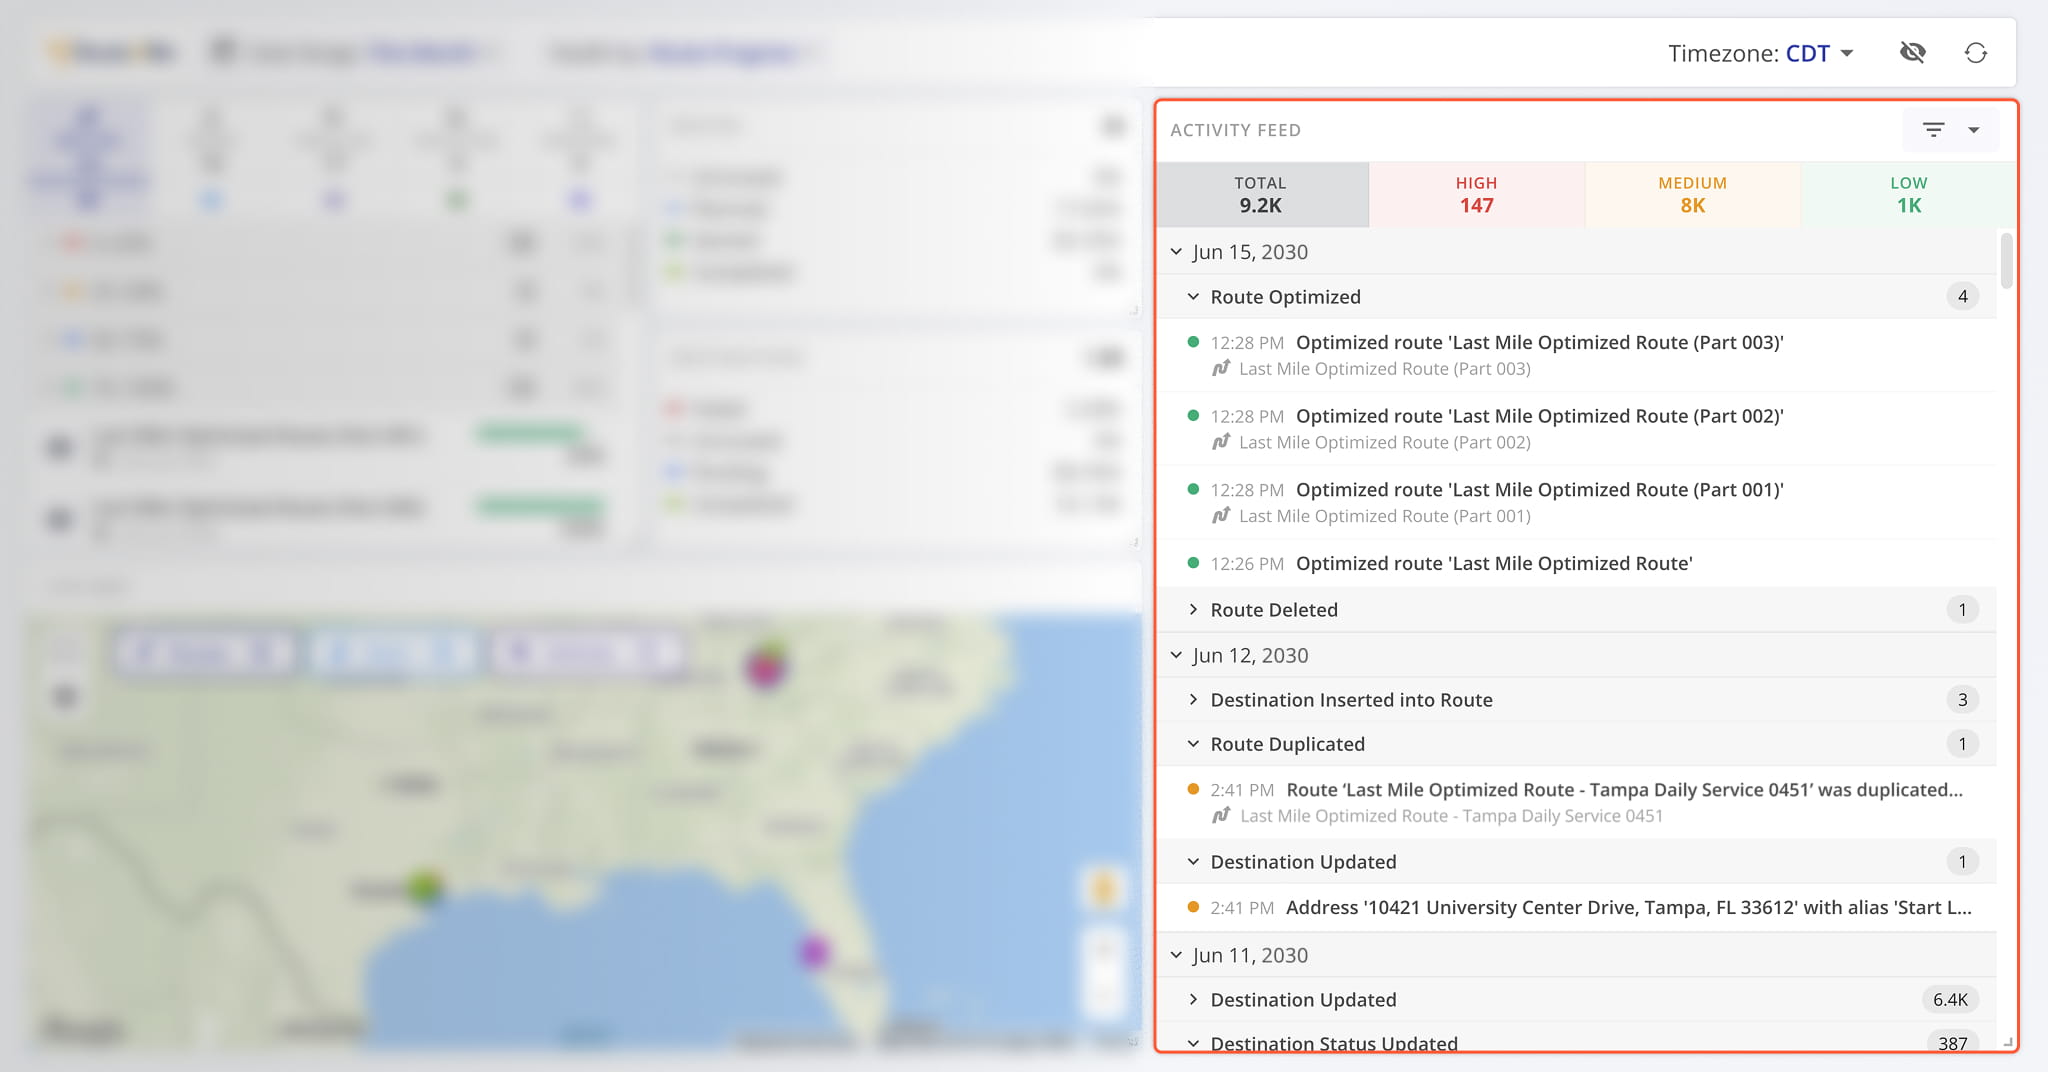
- Activity Feed: Activity event overview showing all relevant actions and updates divided by event priority.
Open Your Operations Dashboard
Dashboard Settings – Configure Filters And Display Company Resources
Before diving into each section, you can customize the Dashboard layout to suit your workflow needs:
- Resizing panels by clicking and dragging their bottom-right corners.
- Arranging panel positions by clicking and dragging their headers.
Keep reading to learn how to configure the Dashboard and use each section to see the operations data and health metrics most relevant to your needs. If you have any further questions after reading this guide, please contact Route4Me Support.
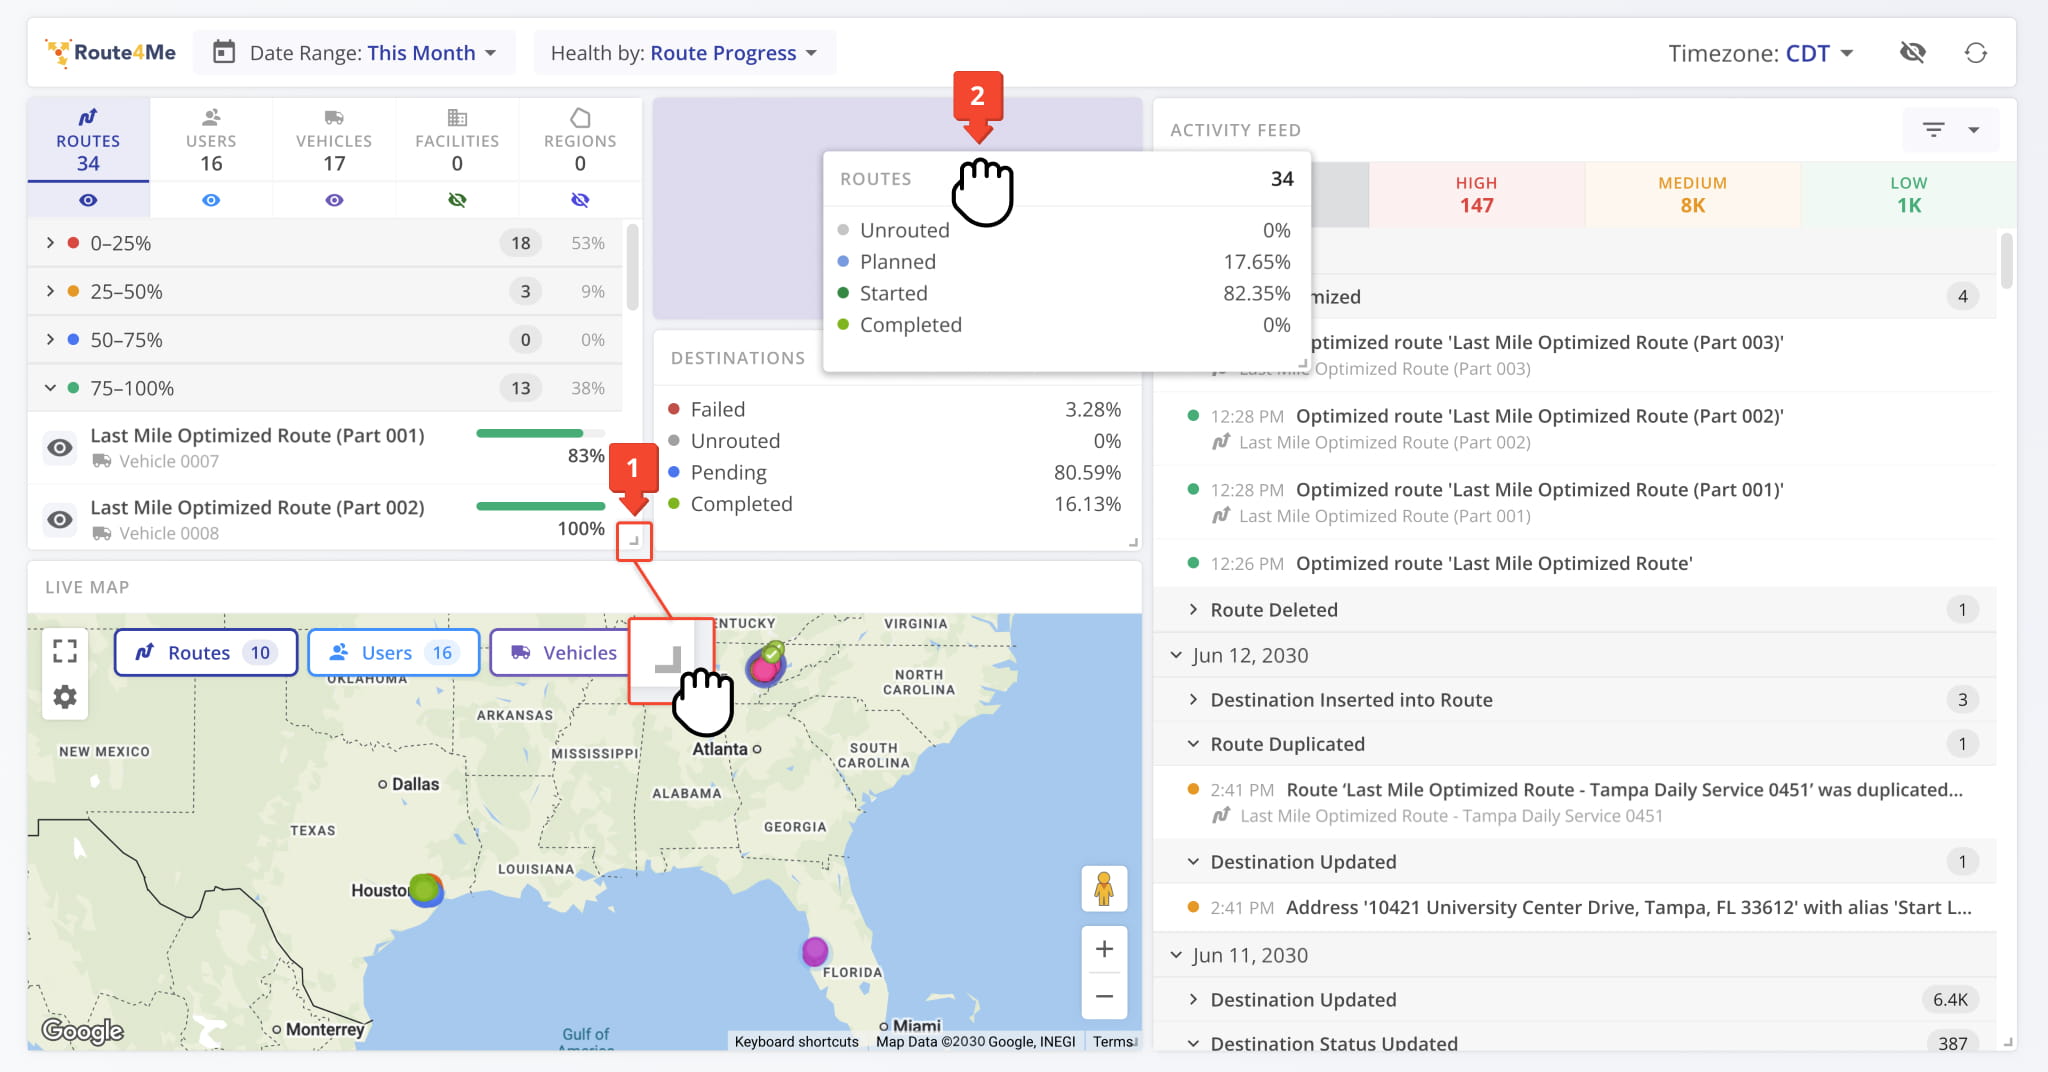
NOTE: The image above is an example of a customized layout with emphasis on the Activity Feed.
Use Date Filters And Pick Operations Health Metrics
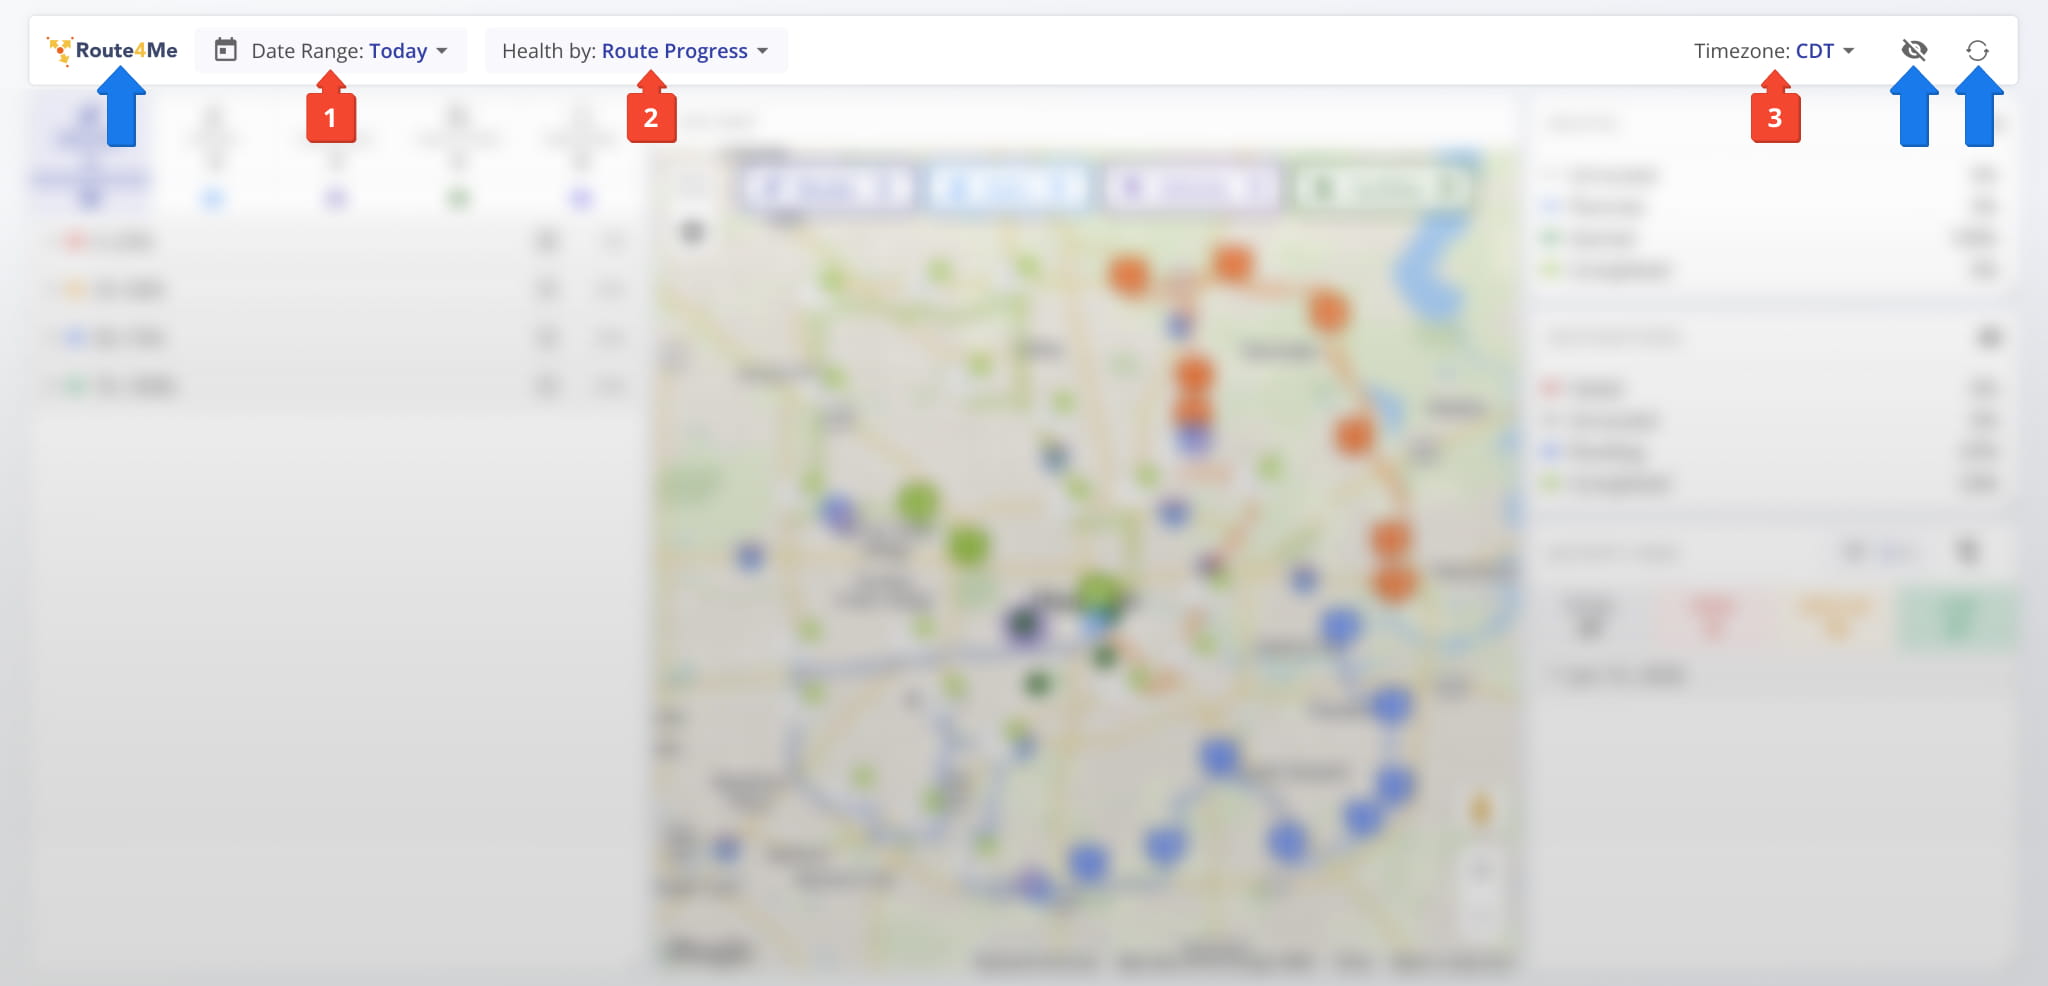
The first step of setting up the Operations Dashboard is using the Header Bar to configure the:
- Date Range: Select a date range to filter Routes by. The Dashboard will only show Routes scheduled for the selected range and their assigned Users, Vehicles, Facilities, and associated Regions.
- Health Metrics: Select which metric will be used to measure operations health:
- Route Progress: Percentage of completed destinations on Routes.
- Sequence Adherence: Percentage of destinations visited in the planned route sequence.
- Cont. Sequence Adherence: Percentage of destinations visited consecutively in the planned route sequence.
- Timezone: Select which timezone will be used on the dashboard to report events, updates, etc.
At any time, you can click the Route4Me Logo in the top-left to go back to the Routes Page. Additionally, you can use the Eye Icon in the top-right to toggle all resources on the map or click the Reset Icon to reset all Dashboard settings to the default values.
Enable Resources On The Map – Toggle Visibility For Routes, Users, Vehicles, Etc.
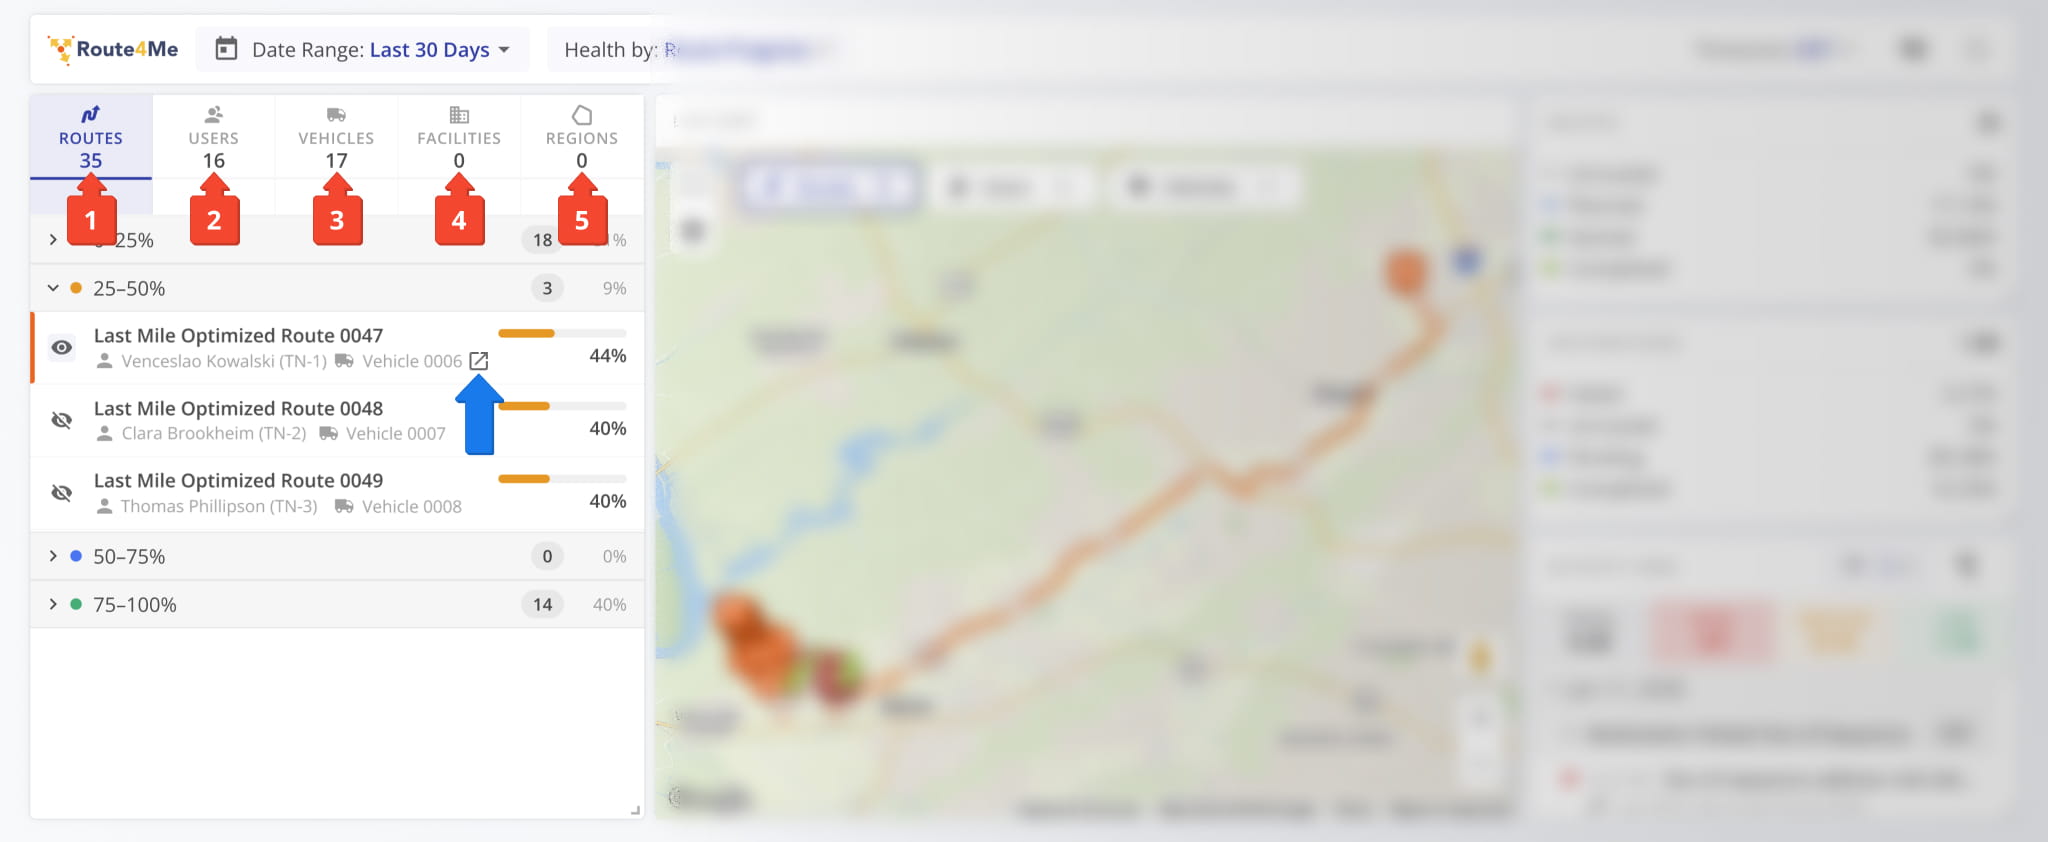
The Resource List in the Dashboard is divided into five main sections corresponding to the following resources:
- Routes: Planned and optimized last-mile Routes scheduled for the specified Date Range
- Users: Team members signed in to their Route4Me accounts during the specified Date Range.
- Vehicles: Cars, vans, and other Company Vehicles who were active during the specified Date Range.
- Facilities: Depots, warehouses, and other Company Facilities assigned to Routes scheduled for the specified Date Range.
- Regions: Operational Regions associated with Routes scheduled for the specified Date Range.
Each section is then divided into four subsections based on the value specified in the “Health by” field. Additionally, when you hover over a resource or entity in the Resource List, you can click the Open Icon to open its associated snapshot.
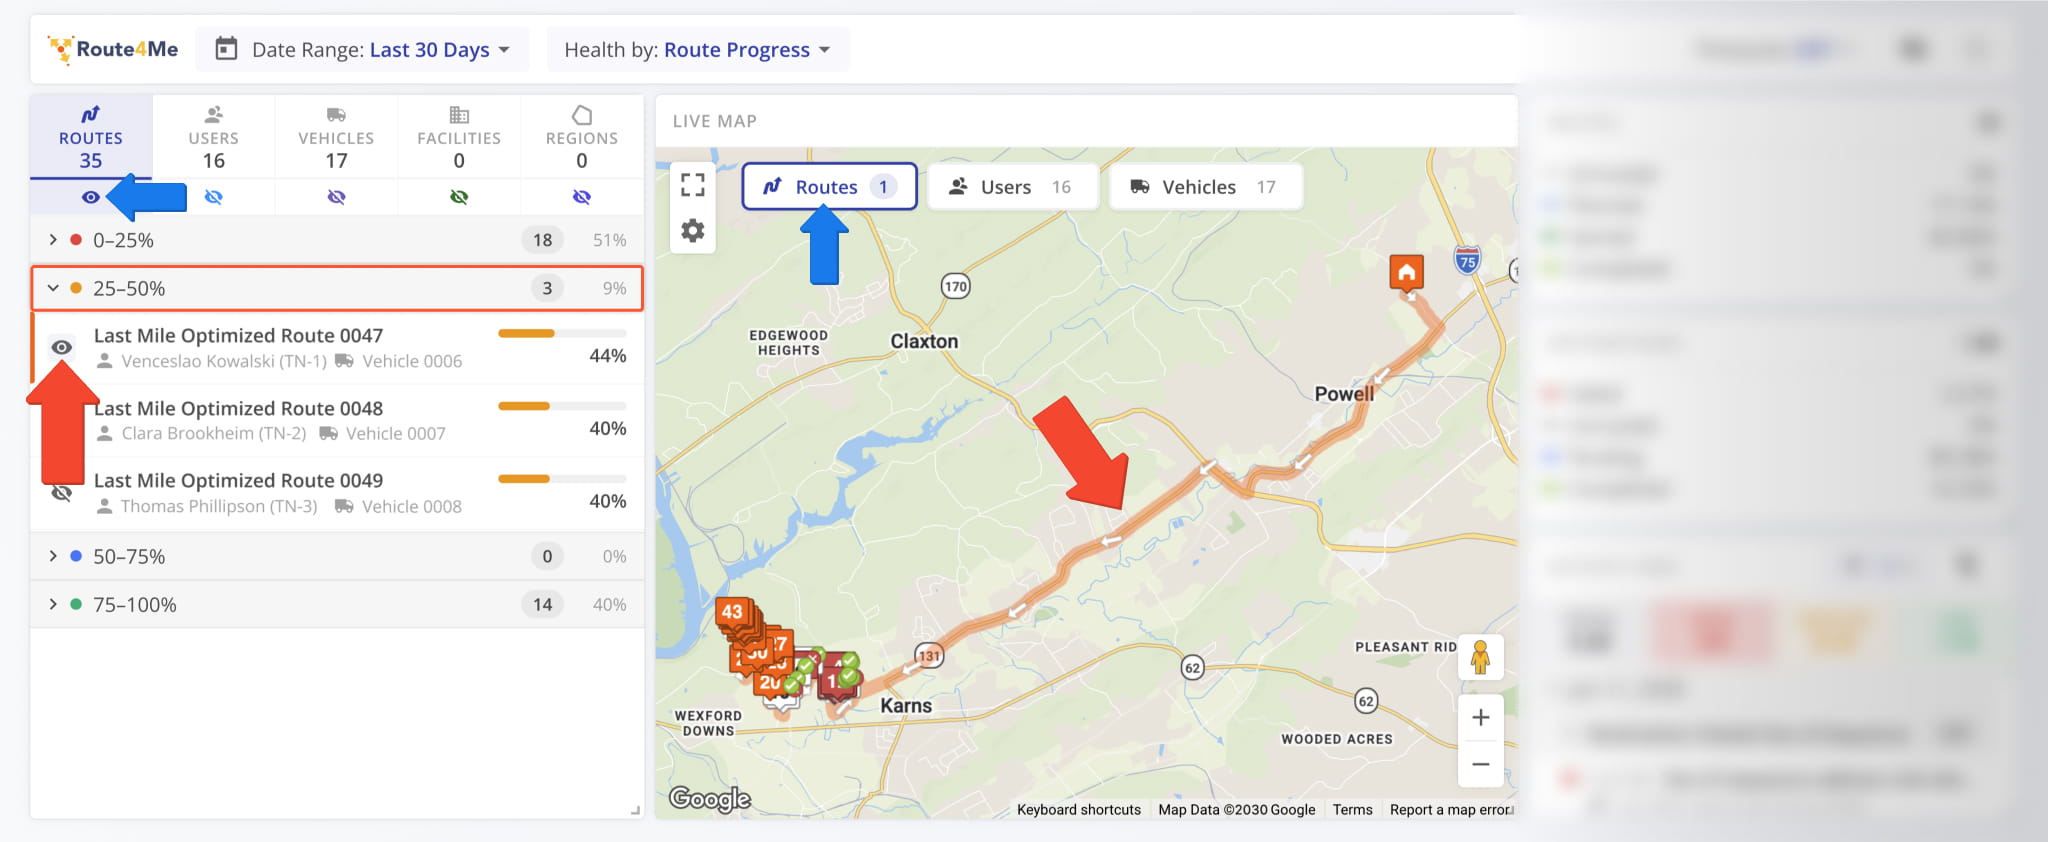
To see a specific resource on the map, you have to enable it. To do so, first open the relevant section of the Resource List and click the Eye Icon next to the resource. Additionally, to show all resources of that type on the map, you can:
- Click the Eye Icon under the Resource List section.
- Click the Resource Label in the “Live Map” panel of the Dashboard.
You can also use Map Layers to toggle resource visibility. Keep reading to learn about using the Live Map.
Live Map – Operations Dashboard Resource Map Settings And Details
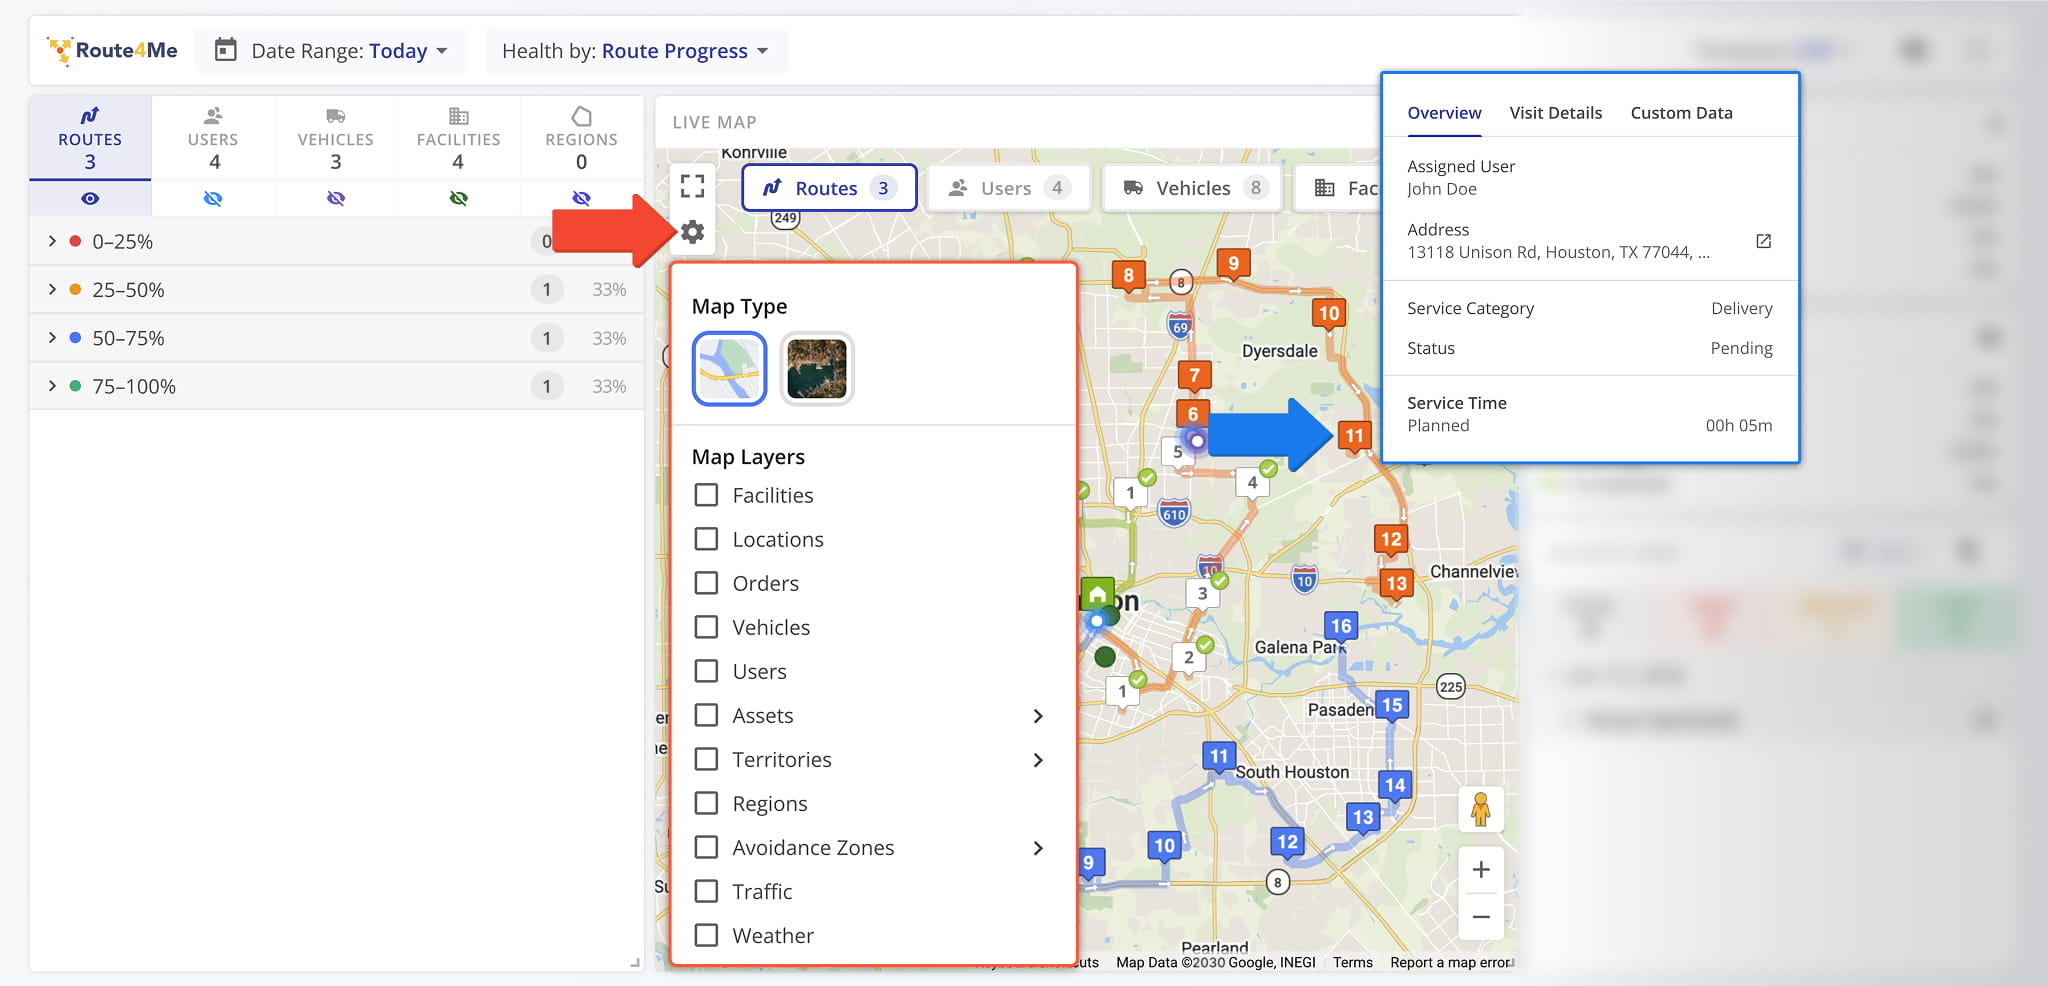
The Live Map shows the last synced location of the resources you selected, as described above. You can hover over any resource to see an overview of its associated details, e.g. hover over a destination to see its visit details, etc.
To enable map layers, simply click the Gear Icon and select your preferred options. Layers available in the Live Map are similar to those you can find in the main Routes Map on your account. See the table below to learn more.
Enable Facility location indicators on the map, with the following additional options:
- Labels: Show Facility name/alias labels
- Completed Routes: Show Facilities on the map regardless of their associated routes' completion status
Enable Customer Locations on the map, with the following additional options:
- Clusters: Group nearby Locations for easier viewing
- Density Heatmap: Show a heatmap overlay based on relative Location densite across the map
Enable Order location indicators on the map, with the following additional options:
- Clusters: Group nearby Orders for easier viewing
Enable Vehicle location indicators on the map, with the following additional options:
- Labels: Show Vehicle name/alias labels
- Fuel/Battery: Show Vehicle fuel and battery levels
- Active Vehicles: Only show active Vehicles on the map
Enable team member location indicators on the map, with the following additional options:
- Labels: Show User name labels
Enable Company Asset location indicators on the map.
NOTE: Only Assets associated with routes scheduled for the specified Date Range will be shown.
Enable saved Territories as overlays on the map.
Enable saved Regions as overlays on the map, with the following additional options:
- Labels: Show Region name/alias labels
Enable saved Avoidance Zones as overlays on the map.
Traffic
Enable a live traffic overlay showing real-time conditions on the road.
Enable any of the following Weather Map Layers:
- Radar: Show rainfall levels on the map
- Satellite: Show cloud coverage on the map
- Wind: Show a wind speed heatmap on the map
- Storm: Show localized storm indicators on the map
- Snow: Show snowfall and accumulation on the map
- Temperature: Show localized temperature values on the map
Filter Activity Feed Events
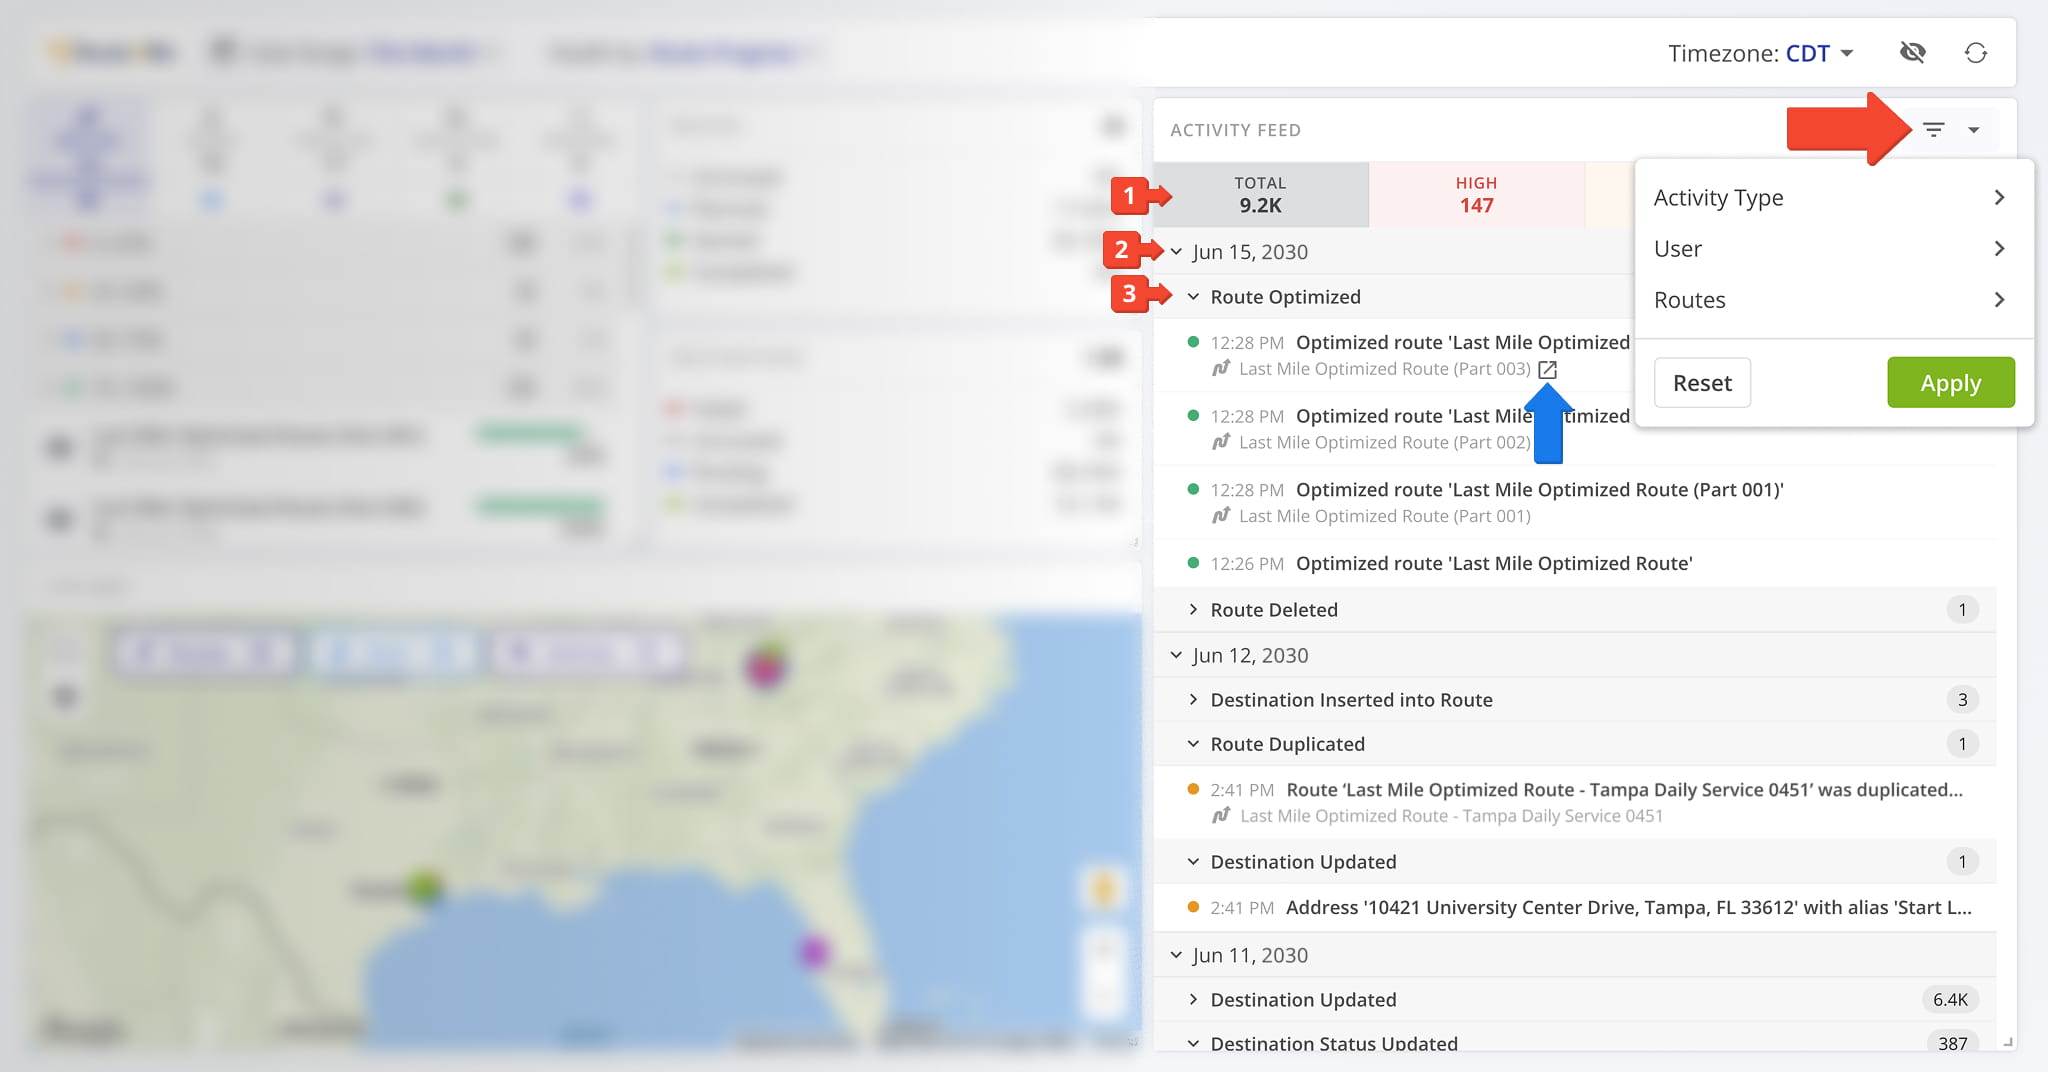
Data in the “Activity Feed” section of the Operations Dashboard is structured in the following three levels:
- Priority: Groups events by how much attention they might require.
- Date: Header that groups all event types that occurred on a specific date.
- Event Type: Header that groups all events of the same type with timestamps.
You can hover over entities like Routes and Users to see the Open Icon. Click it to go to the corresponding snapshot.
To more easily find the Activity Feed Events relevant to your needs, you can use the Filters Menu by clicking the button in the top-right. This enables you to filter the Activity Feed by event type, associated user, and Routes on which events occurred.
Activity Feed Event Priority
The “Activity Feed” section of the Operations Dashboard shows activity updates divided into three priority tiers:
- High: Events that may require attention due to disrupting planned Routes.
- Medium: Changes made to Routes, destinations, and other non-disruptive manual actions.
- Low: Standard events triggered during normal operations such as visiting destinations and completing Routes.
See the table below for a full list of Activity Feed events by priority. Learn more about the Route4Me Activity Feed.
Destination Visited Out Of Sequence
Late Arrival
Route Paused
Destination Deleted
Early Arrival
Destination Inserted Into Route
Destination Moved (Manual Sequence Edit)
Note Added To Destination
Order Deleted
Order Updated
Route Deleted
Destination Status Updated
Route Duplicated
Route Merged
Destination Updated
User Note Added (User Message)
Approved To Execute
Geofence Entered
Geofence Departed
Destination Marked As Visited
Destination Marked As Departed
Order Created
Pickup Label Code Scanned
Route Ended
Route Optimized
Route Started
Visit Route4Me's Marketplace to Check out Associated Modules:
- Operations
Audit Logging and Activity Stream
- Operations
Custom Data Add-On
- Operations
Advanced Team Management Add-On
About author: Kristian Andreev
Kristian is a Technical Writer at Route4Me. With over a decade of experience in writing and localization, he's an expert at communicating complex technical data in a clear, concise, and user-friendly way. Passionate about bridging the gap between engineers and users, he specializes in creating documentation to streamline onboarding, enhance product usability, and support global teams on the path to success.