
Route Snapshot AI Summary – Automated Route Insights And Reporting
Route4Me’s AI route summary brings automated, narrative-driven insights to last mile route planning, helping logistics planners move faster from raw route data to actionable decisions. Built for enterprise business needs, this AI-generated report accelerates data analysis by highlighting key metrics, risks, and recommendations in a single, readable format. Learn what the AI route summary includes, how to read each section, and how to customize its appearance to fit your workflow.
Table of Contents
AI Summary Overview – Generating Your Route Report
There are two ways to access the AI-generated report from the Route Snapshot: click the “AI Analysis” Button in the the upper-right corner or select “AI Analysis” from the Down Arrow drop down menu.
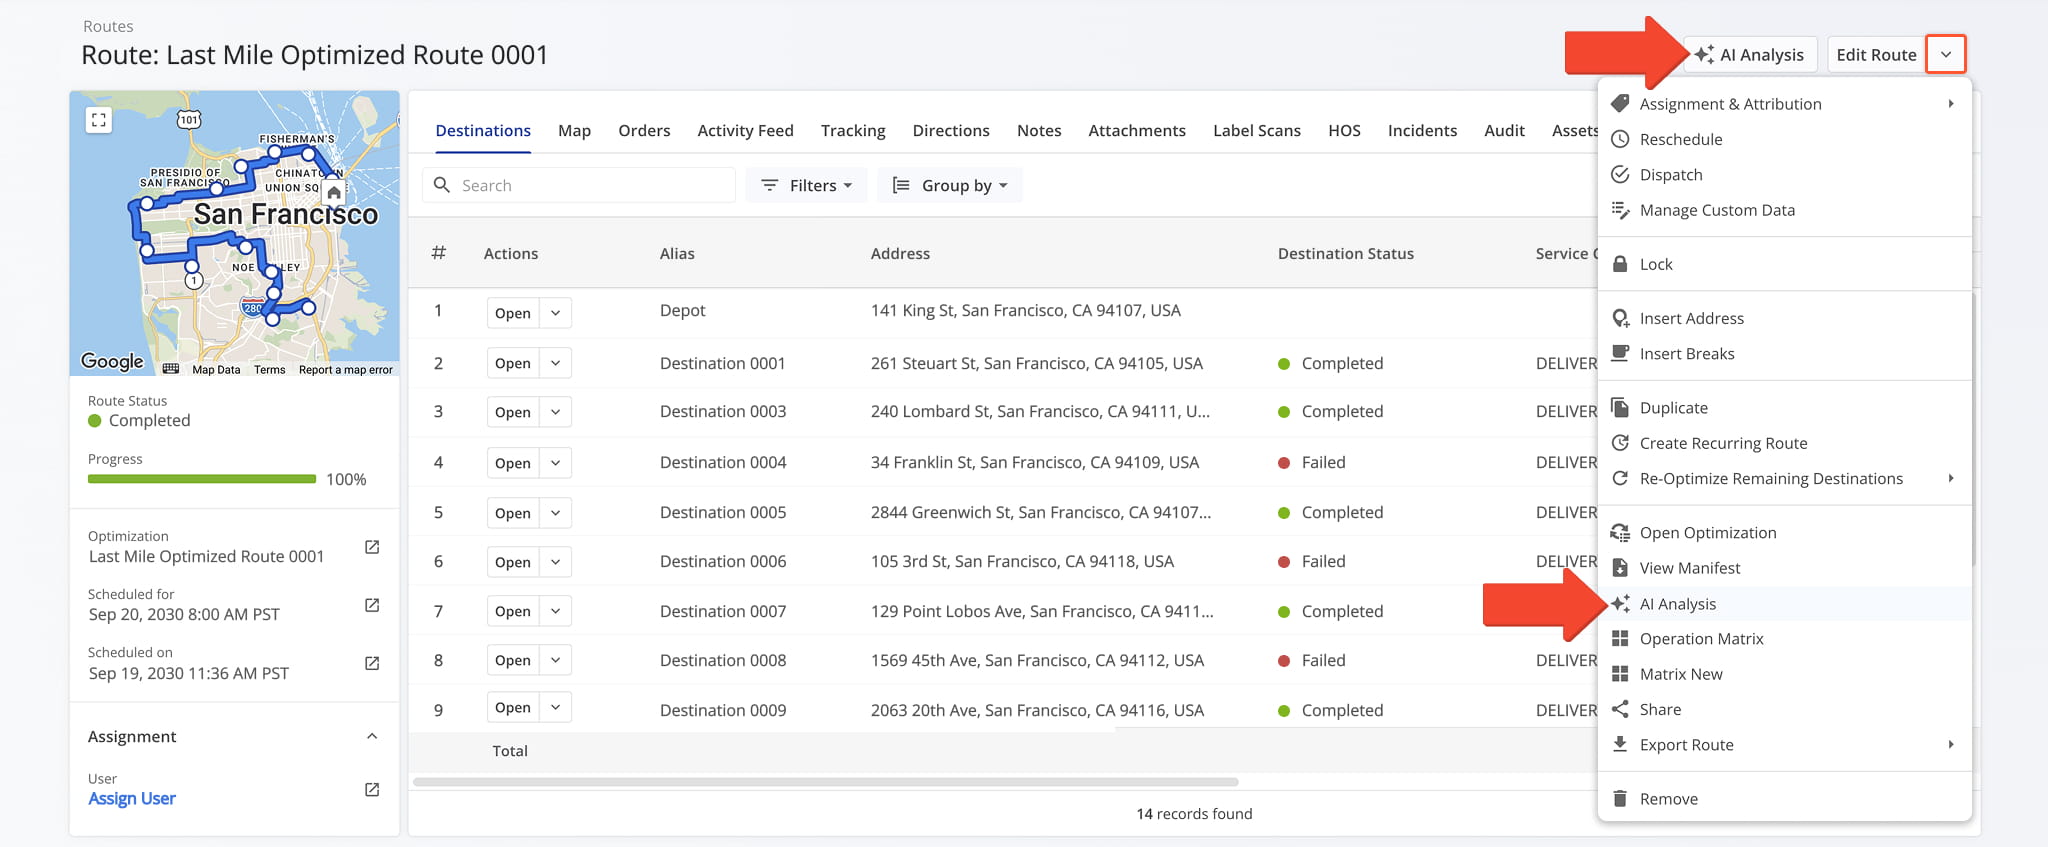
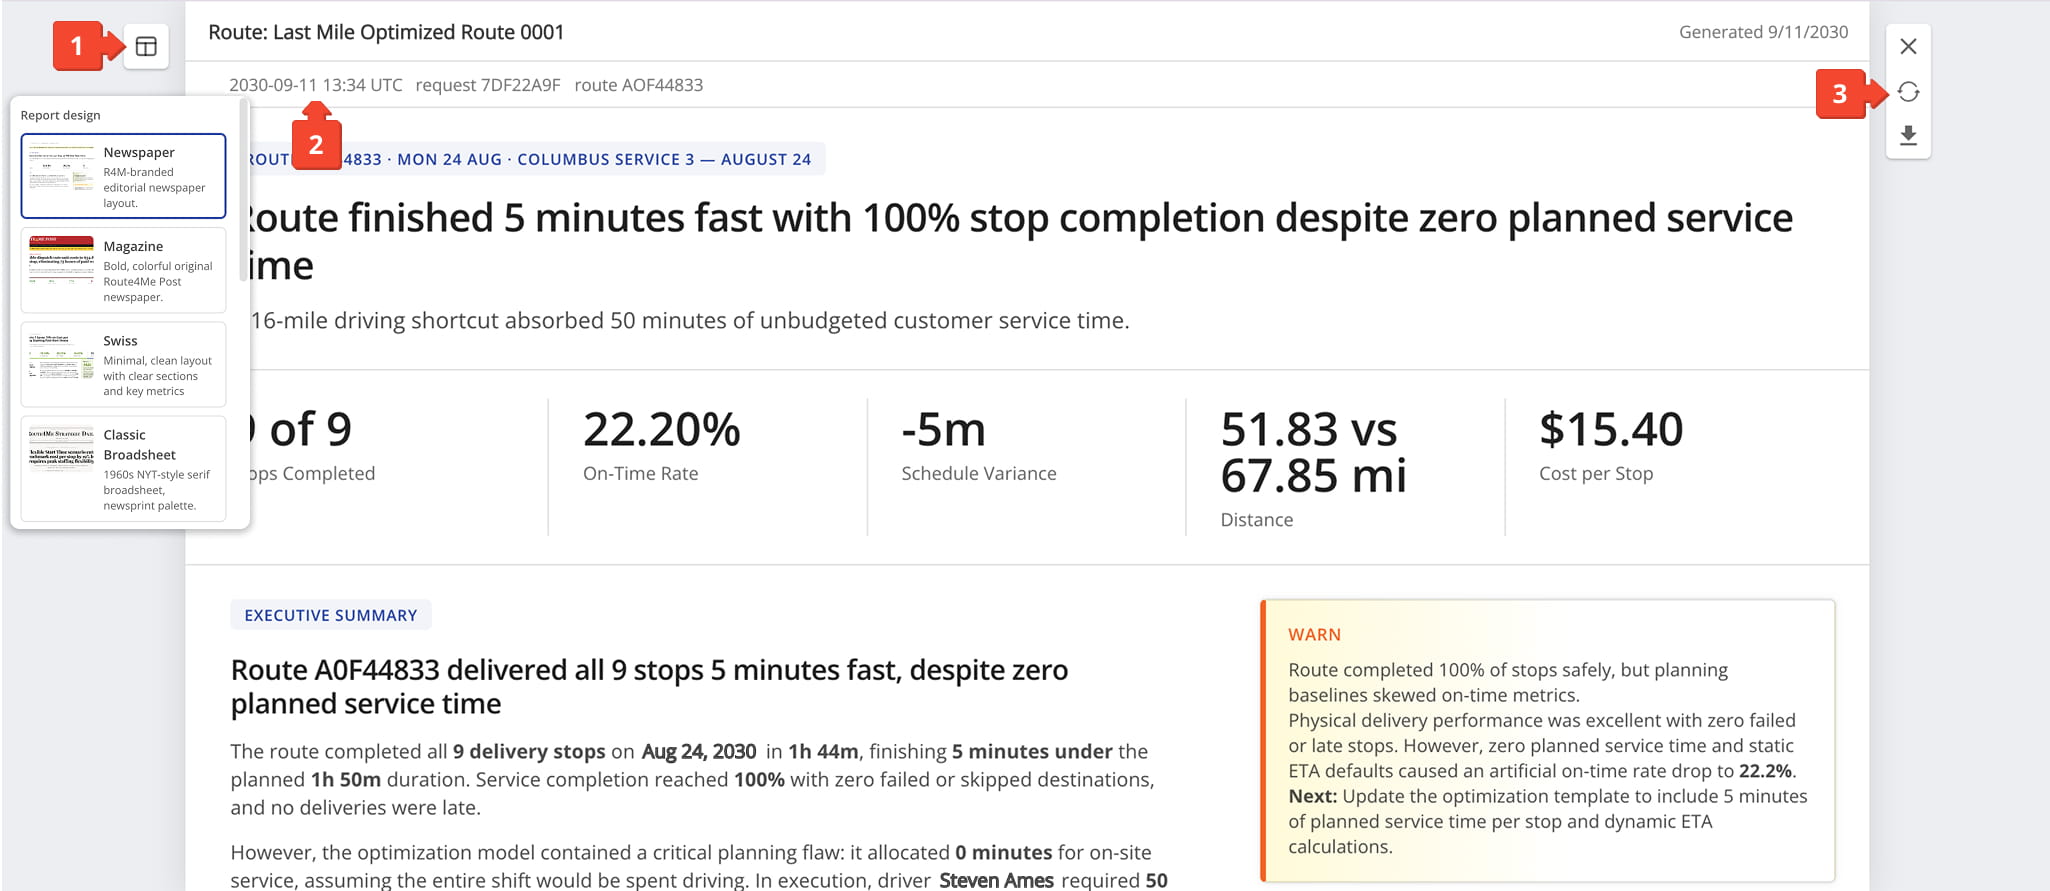
Route4Me automatically generates your report, enabling you to quickly review key strategic insights, optimization results, and operational news at a glance. What you’ll find:
- Report design options which allow you to customize its appearance, described in detail further in this guide.
- A timestamp shows when the summary was generated, along with its associated request and route IDs for reference.
- A control panel from which you can close the report by clicking “X“, regenerate the report by clicking the Circular Arrow Icon, or download a PDF version of the report by clicking the Download Icon.
NOTE: If you modify a route after generating its AI summary, we recommend that you regenerate the report so it provides the most accurate, up-to-date insights.
AI Summary Breakdown – Report Structure And Contents
The report is organized into several parts, each covering a different aspect of the route’s performance. Together, they give a complete picture of how the route’s actual performance compares to what was planned.
Key Route Metrics – Stats, Alerts, And Route ID
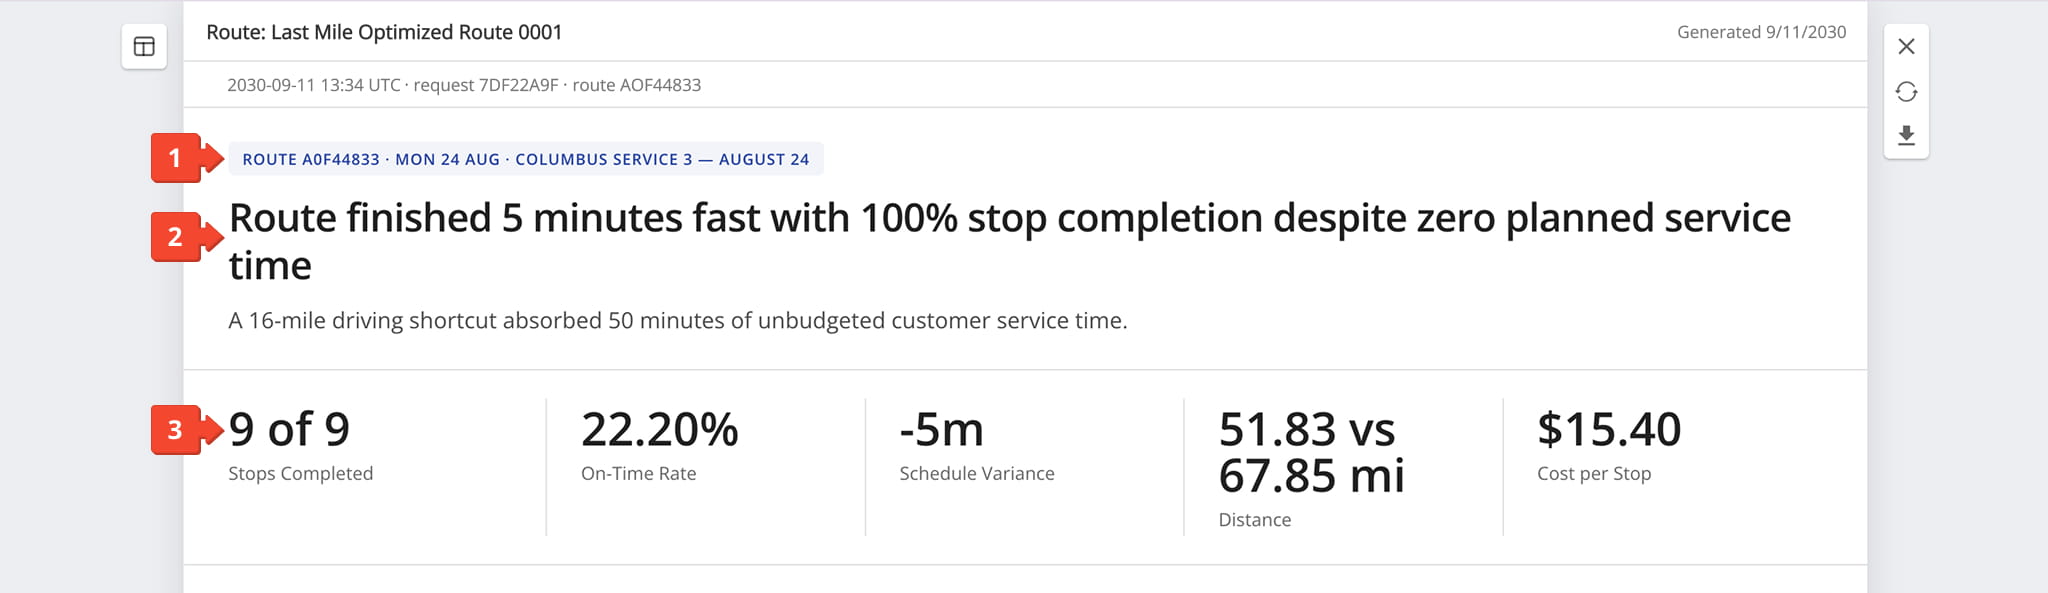
The top section of the report identifies the route and highlights its most important outcome alongside core performance metrics.
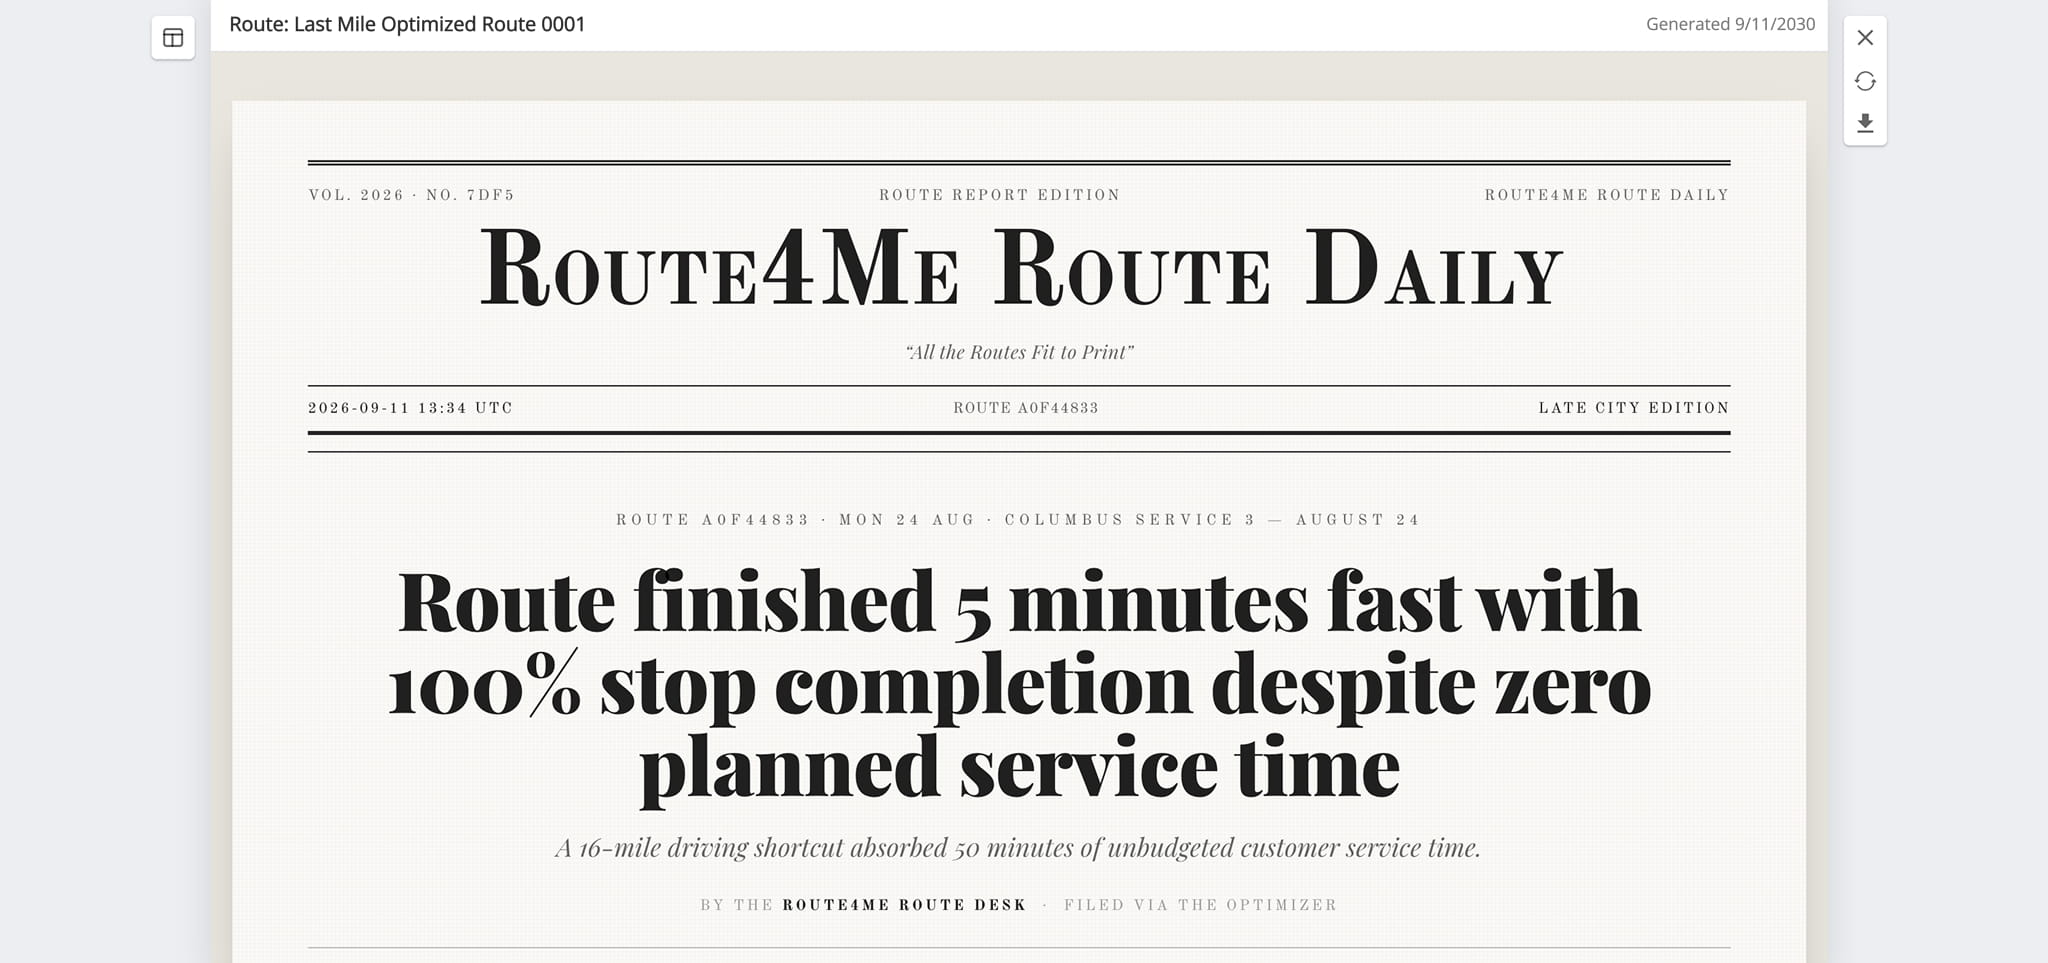
- Route Identifier Tag: Label identifying the route ID, scheduled date, and route name.
- Summary Headline: Headline and subheadline summarizing the route’s most notable outcome in plain language.
- Core Route Metrics: Aggregate performance metrics for the route, covering completion, timing, distance, and cost.
Executive Summary And Plan Vs Actual – Route Performance Findings
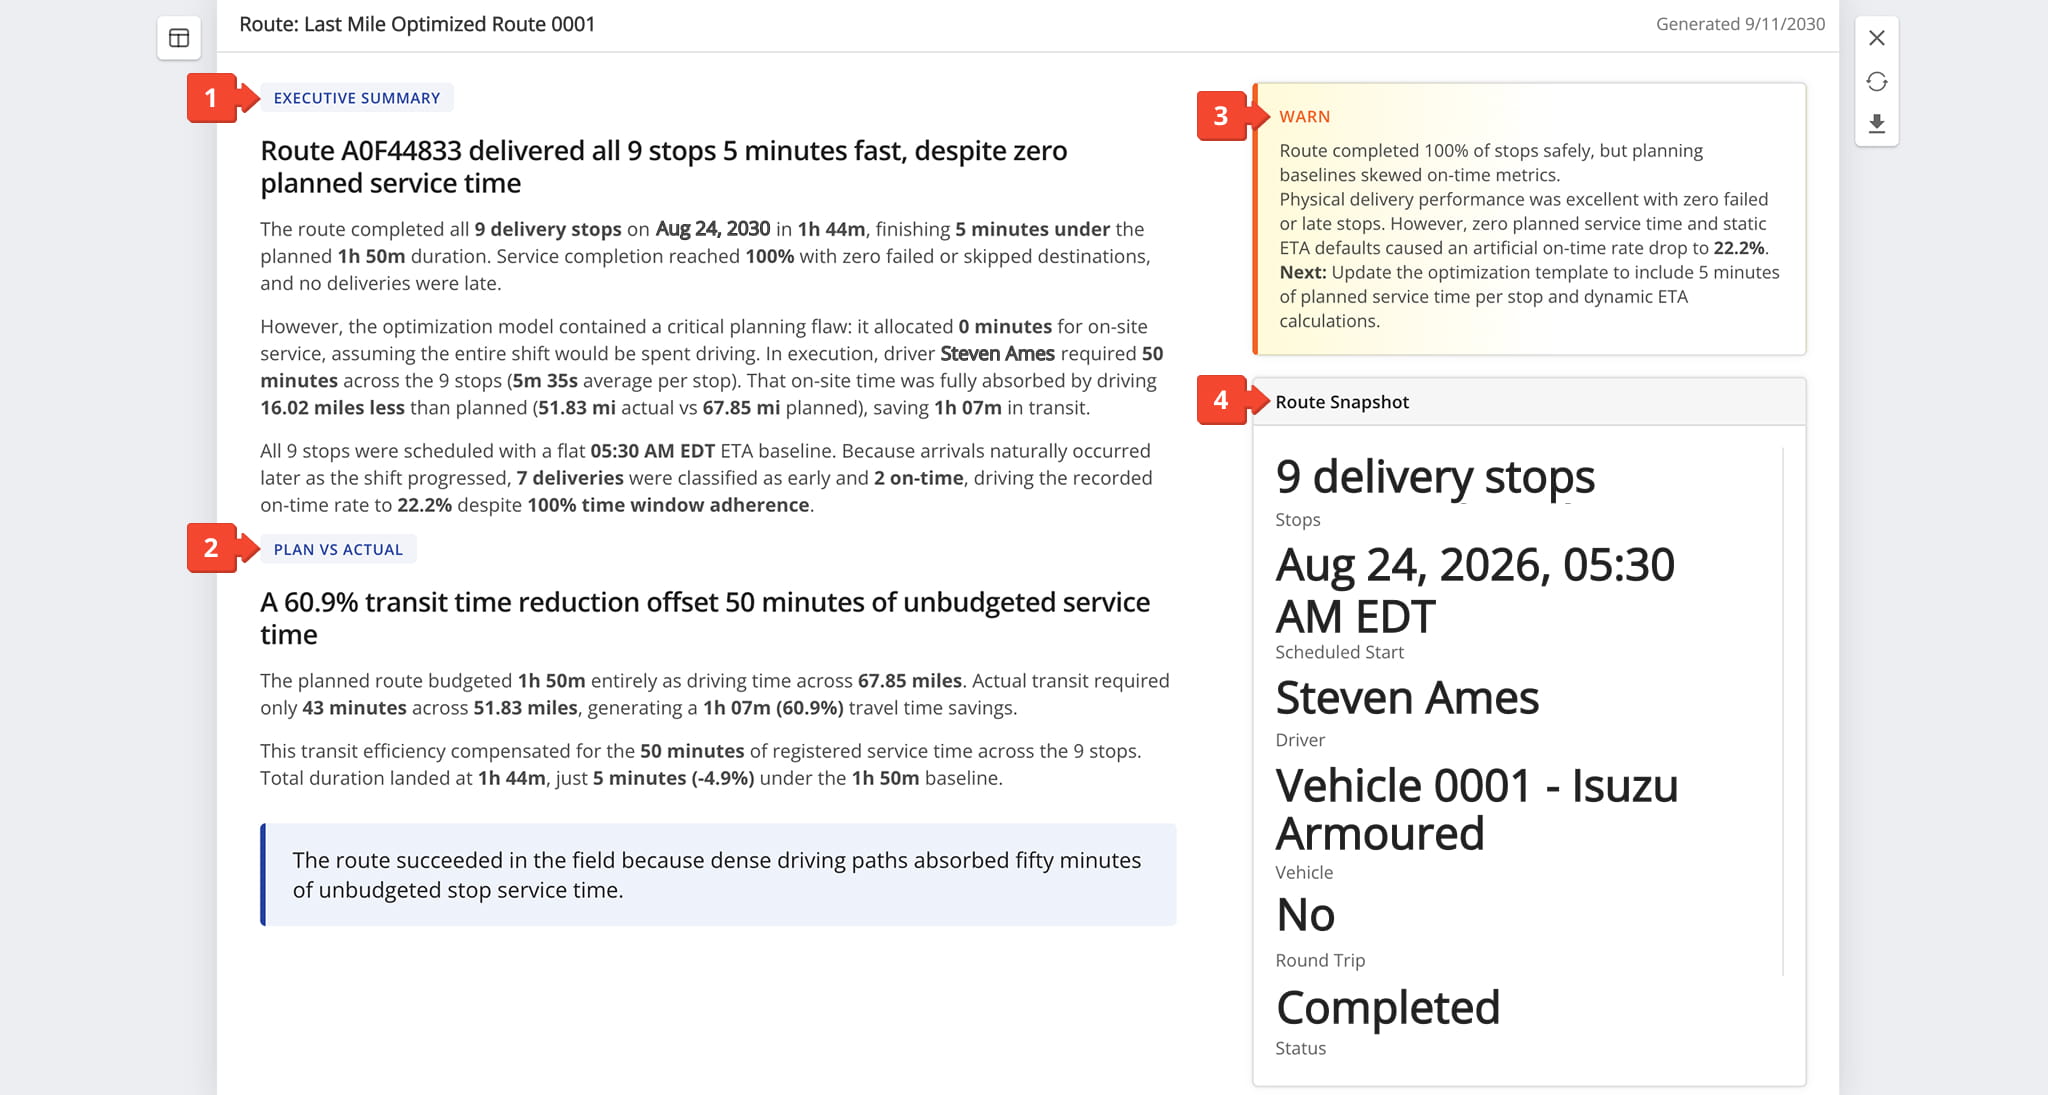
Just below the metrics row, the report shifts into a written comparison of what was planned against what actually happened.
- Executive Summary: Condenses the route’s overall outcome, including completion rate, timing, and any notable discrepancies.
- Plan vs Actual Analysis: Explains why actual performance diverged from the plan, closing with a one-sentence takeaway.
- Warning Callout: Flags metrics that appear to be negative, along with recommended next steps.
- Route Snapshot: Summary of the route’s stop count, start time, driver, vehicle, round-trip status, and completion status.
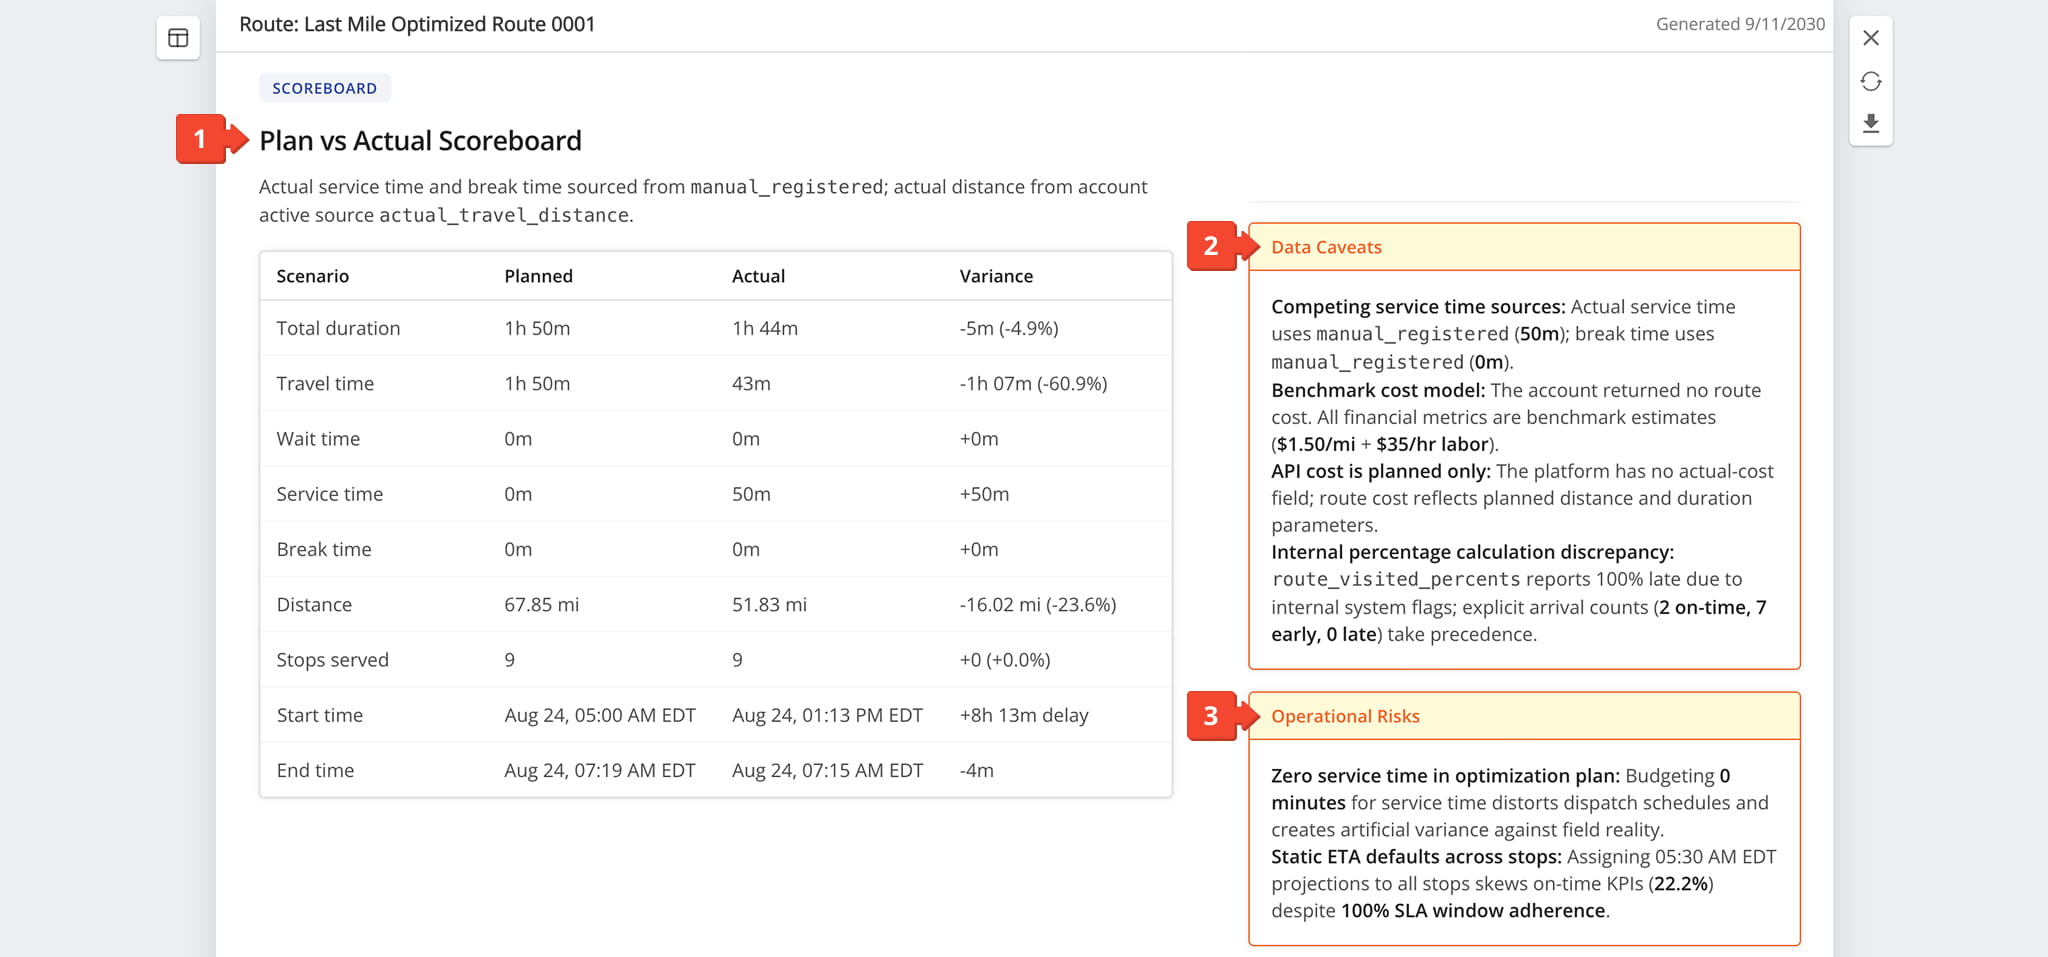
Plan Vs Actual Route Metrics – Scoreboard, Caveats, Operational Risks
This section of the AI Summary compares planned and actual values across core route metrics, alongside callouts that highlight risks and data limitations.
- Plan vs Actual Scoreboard Table: Side-by-side comparison of key planned and actual route metrics, with variance for each.
- Data Caveats: Callout noting limitations or inconsistencies in the underlying data that affect how the figures should be interpreted.
- Operational Risks: Callout highlighting planning flaws or systemic issues that distorted performance metrics.
Shift Distribution And Service Quality – Route Time Allocation
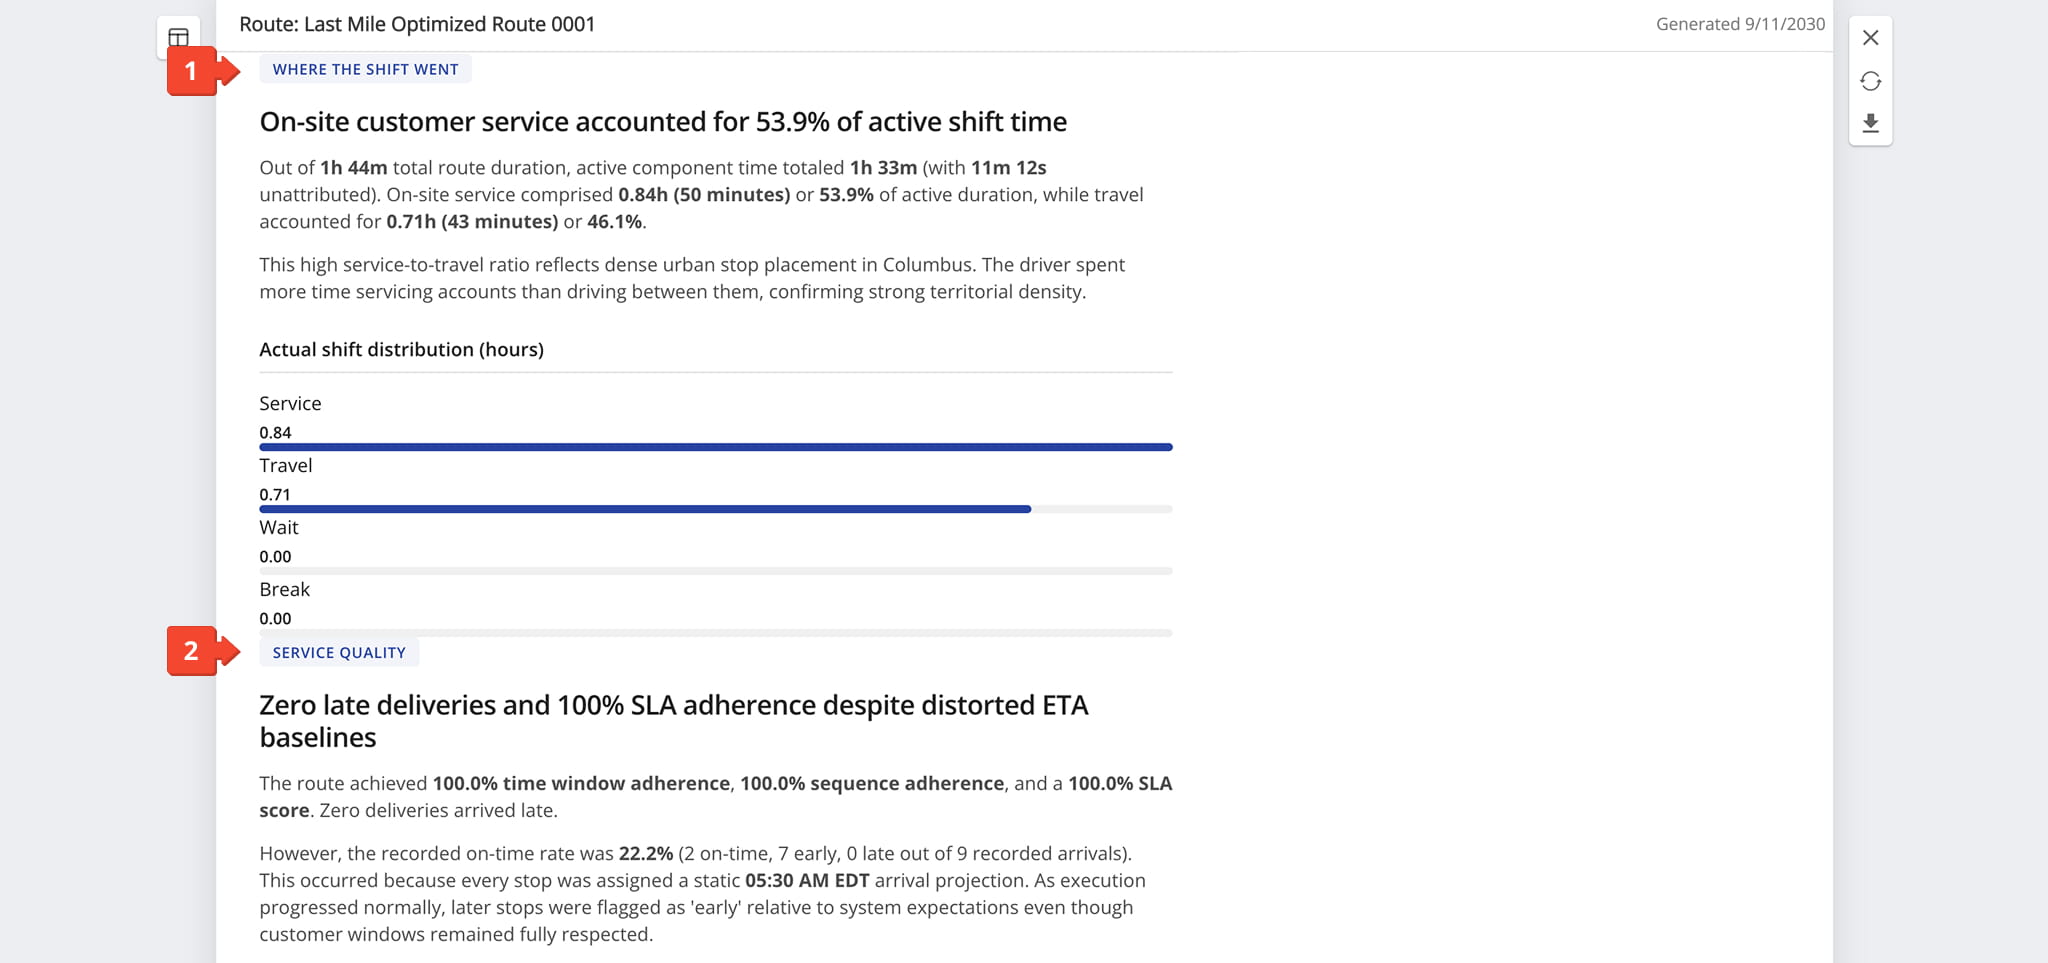
This section of the AI Summary breaks down how the driver’s actual time was spent and evaluates how well customer service commitments were met.
- Shift Distribution Analysis: Breakdown of how actual shift time was split, visualized in a chart.
- Service Quality Analysis: Assessment of adherence and SLA performance, including any discrepancies in reported timing.
Schedule Deviations And Exceptions – Route Schedule Variance
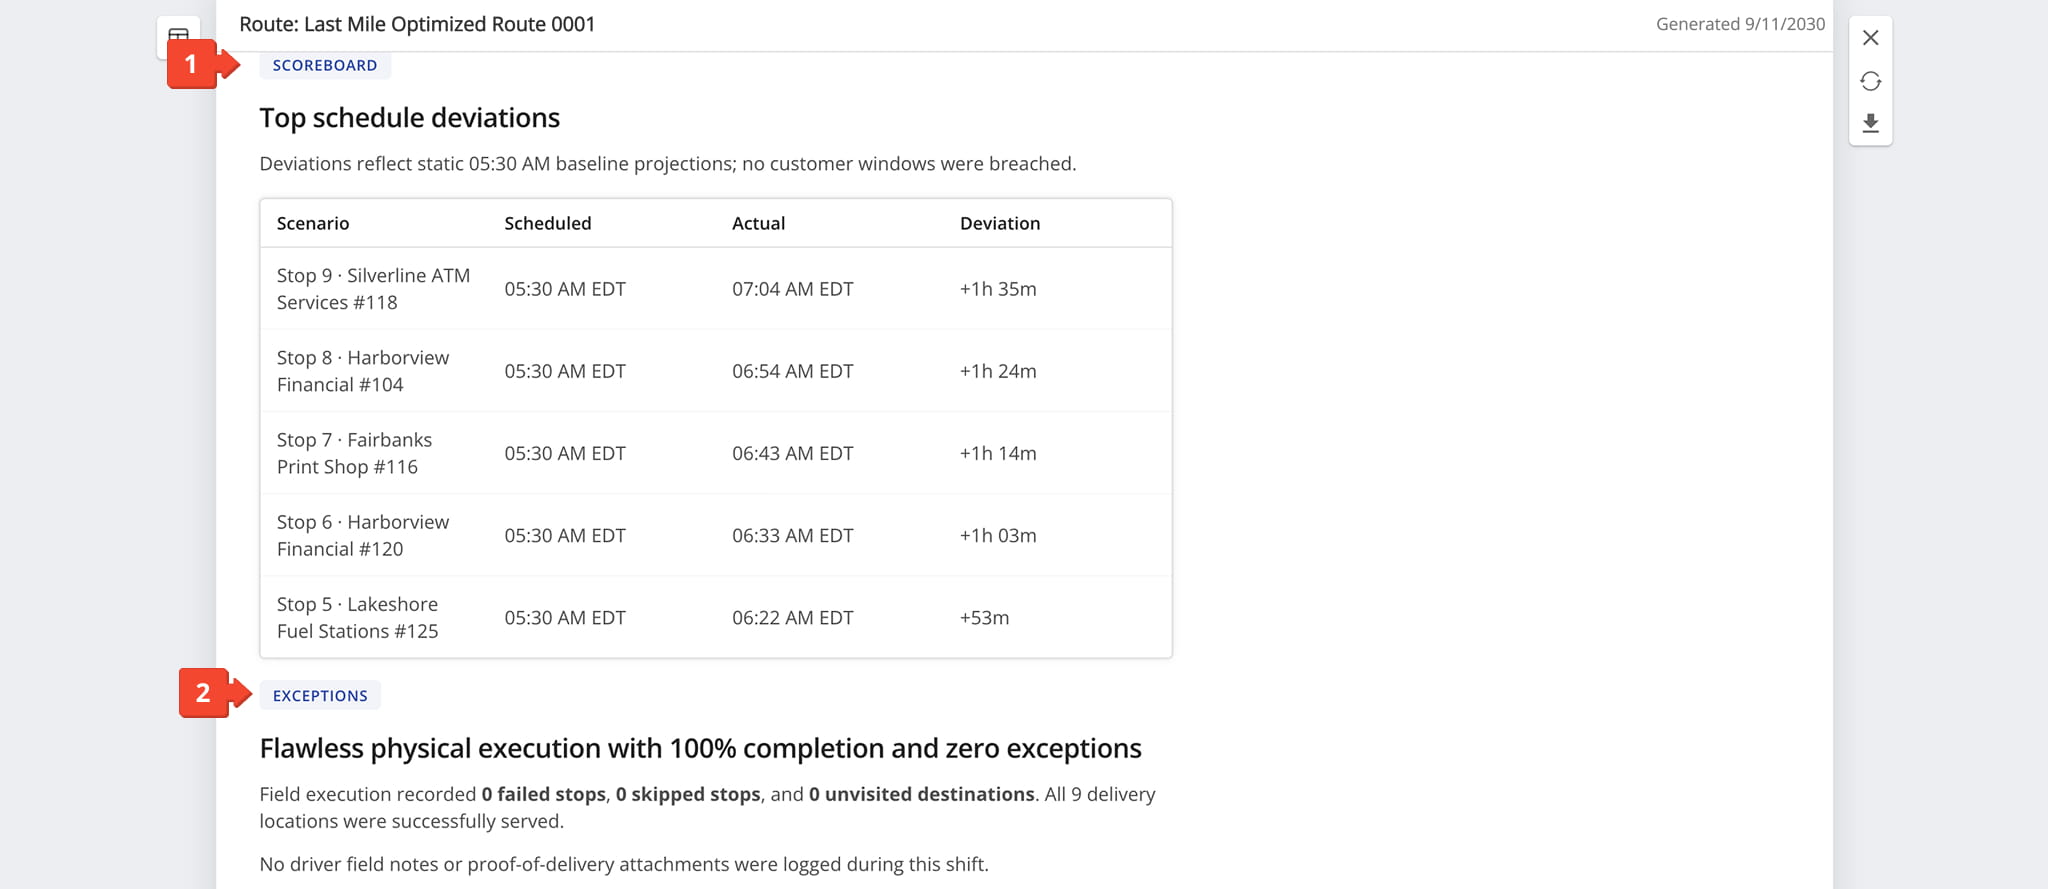
The next section of the report highlights stops with the largest timing deviations and confirms whether any delivery issues occurred.
- Top Schedule Deviations Table: Ranked list of the stops with the greatest difference between scheduled and actual arrival time.
- Exceptions Summary: Confirmation of failed, skipped, or unvisited stops, along with notes on missing field documentation.
Unit Economics And Recommended Actions – Cost Breakdown And Next Steps
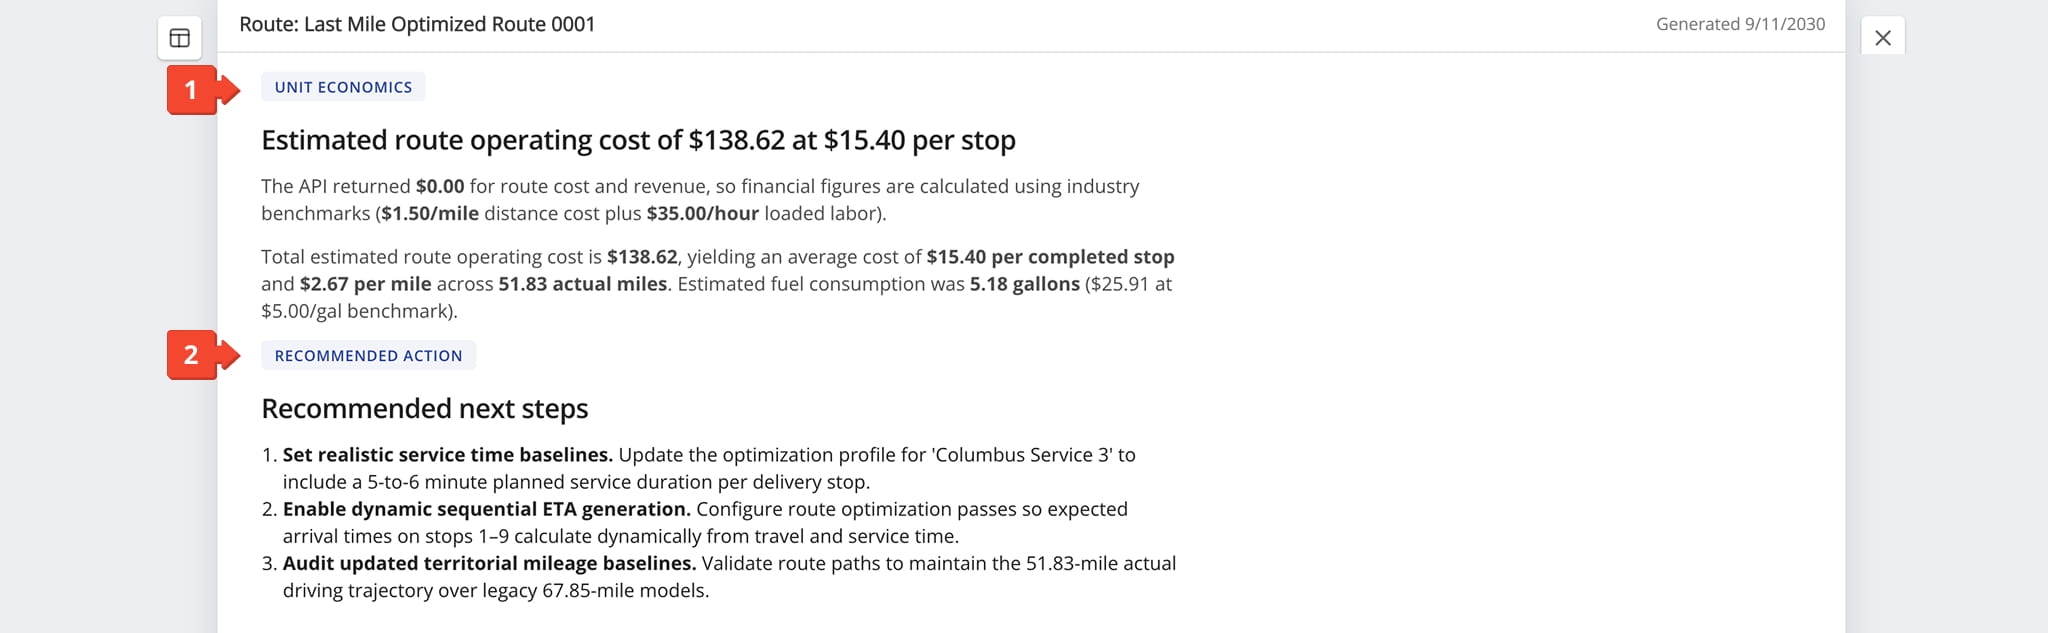
This section of the AI Summary explains the route’s actual cost and provides prioritized next steps.
- Unit Economics: Explains how the route’s actual operating cost is calculated, including rates and assumptions used.
- Recommended Next Steps: Prioritized, actionable tasks for improving future route planning.
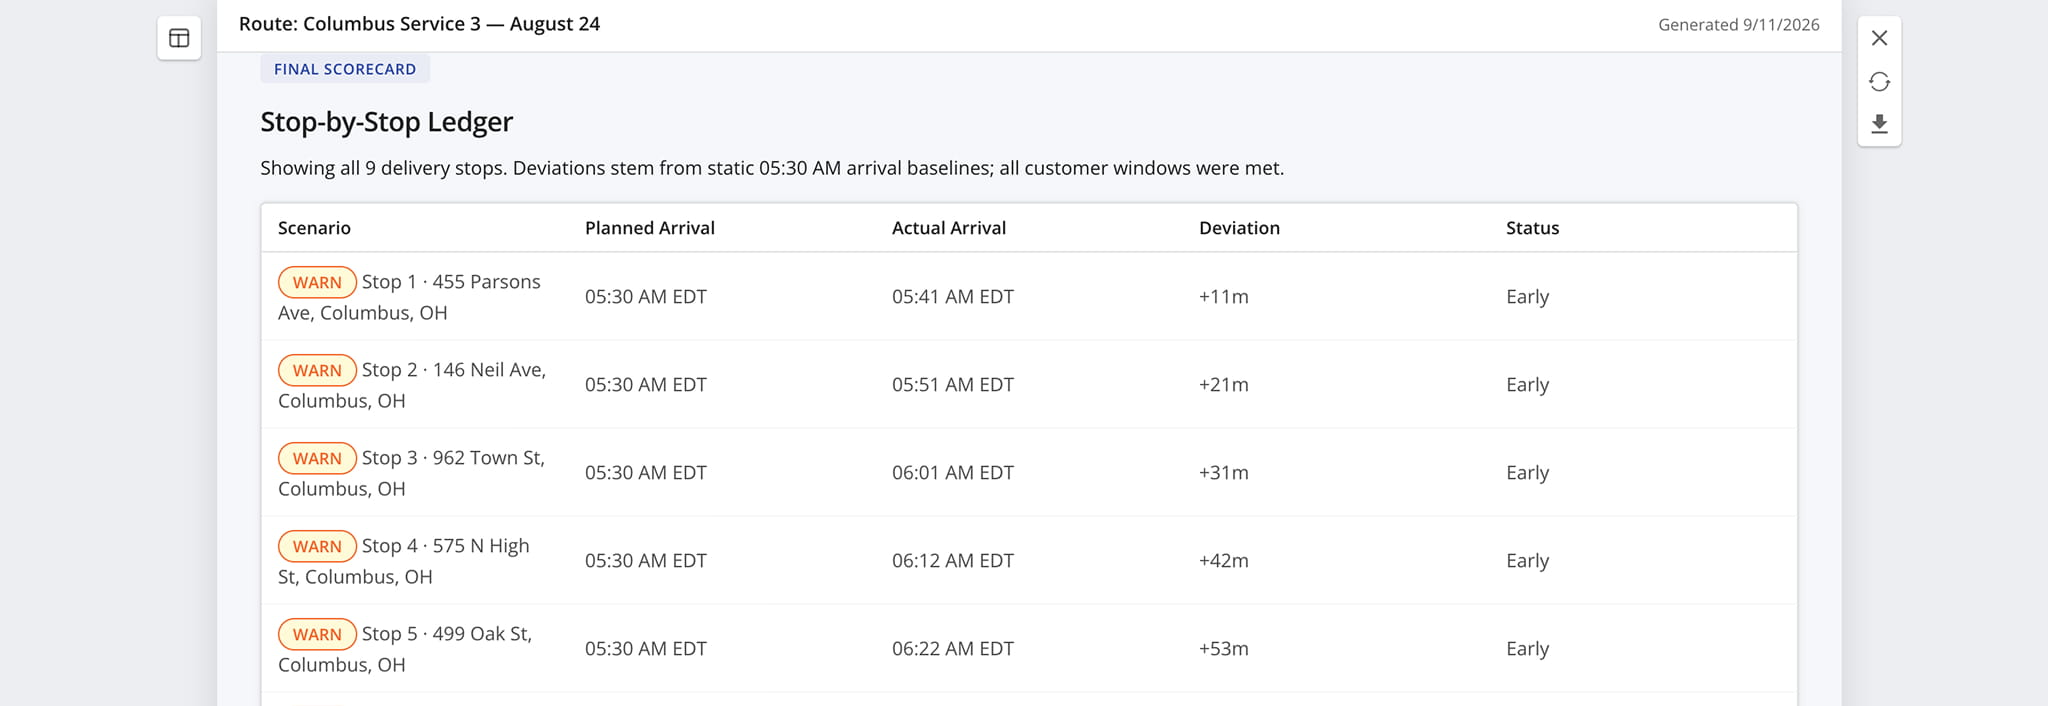
Final Scorecard – Complete Route Audit Table
The final section of the AI Summary provides a complete, stop-by-stop record of route performance. It includes a table listing each stop’s planned arrival, actual arrival, deviation, and status.
AI Summary Appearance – Customizable Layout Templates
Click the “Report Design” button to adjust the visual style of the AI summary. Options range from Newspaper, Magazine, and Classic Broadsheet to Modern Editorial Magazine Cover and Infographic Dashboard.
Choosing a different layout can make the report easier to scan, present, or share depending on the audience. A few examples are shown below.
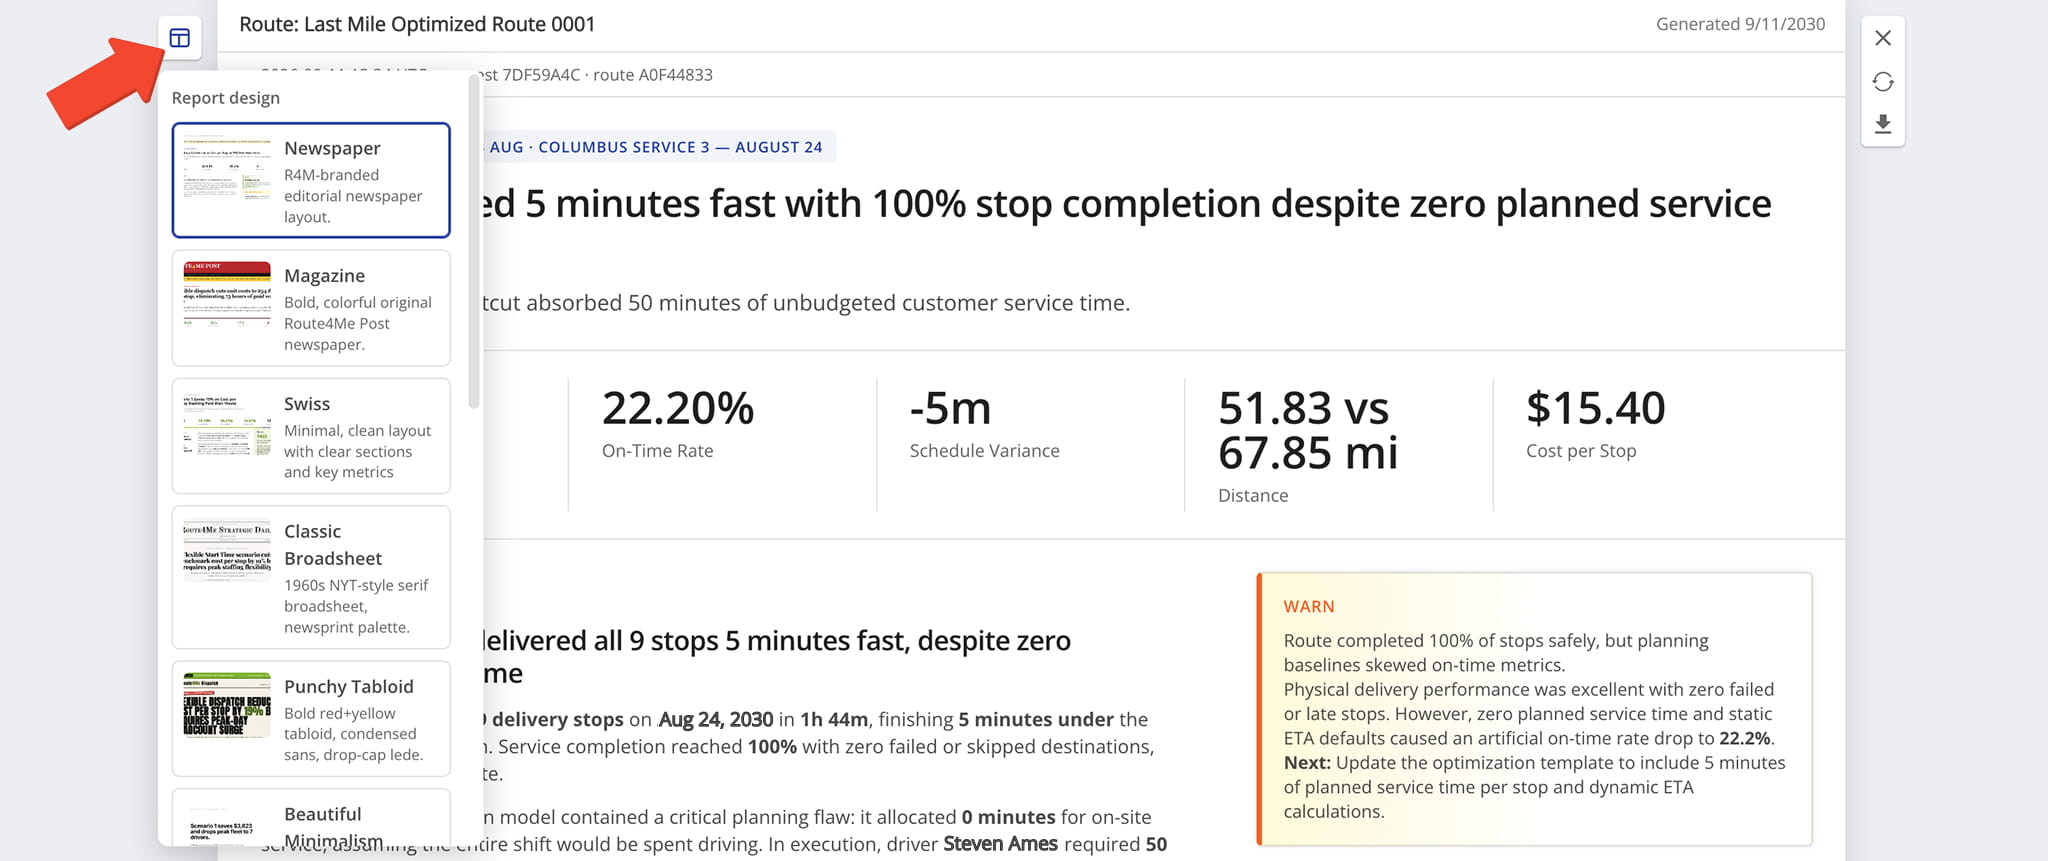
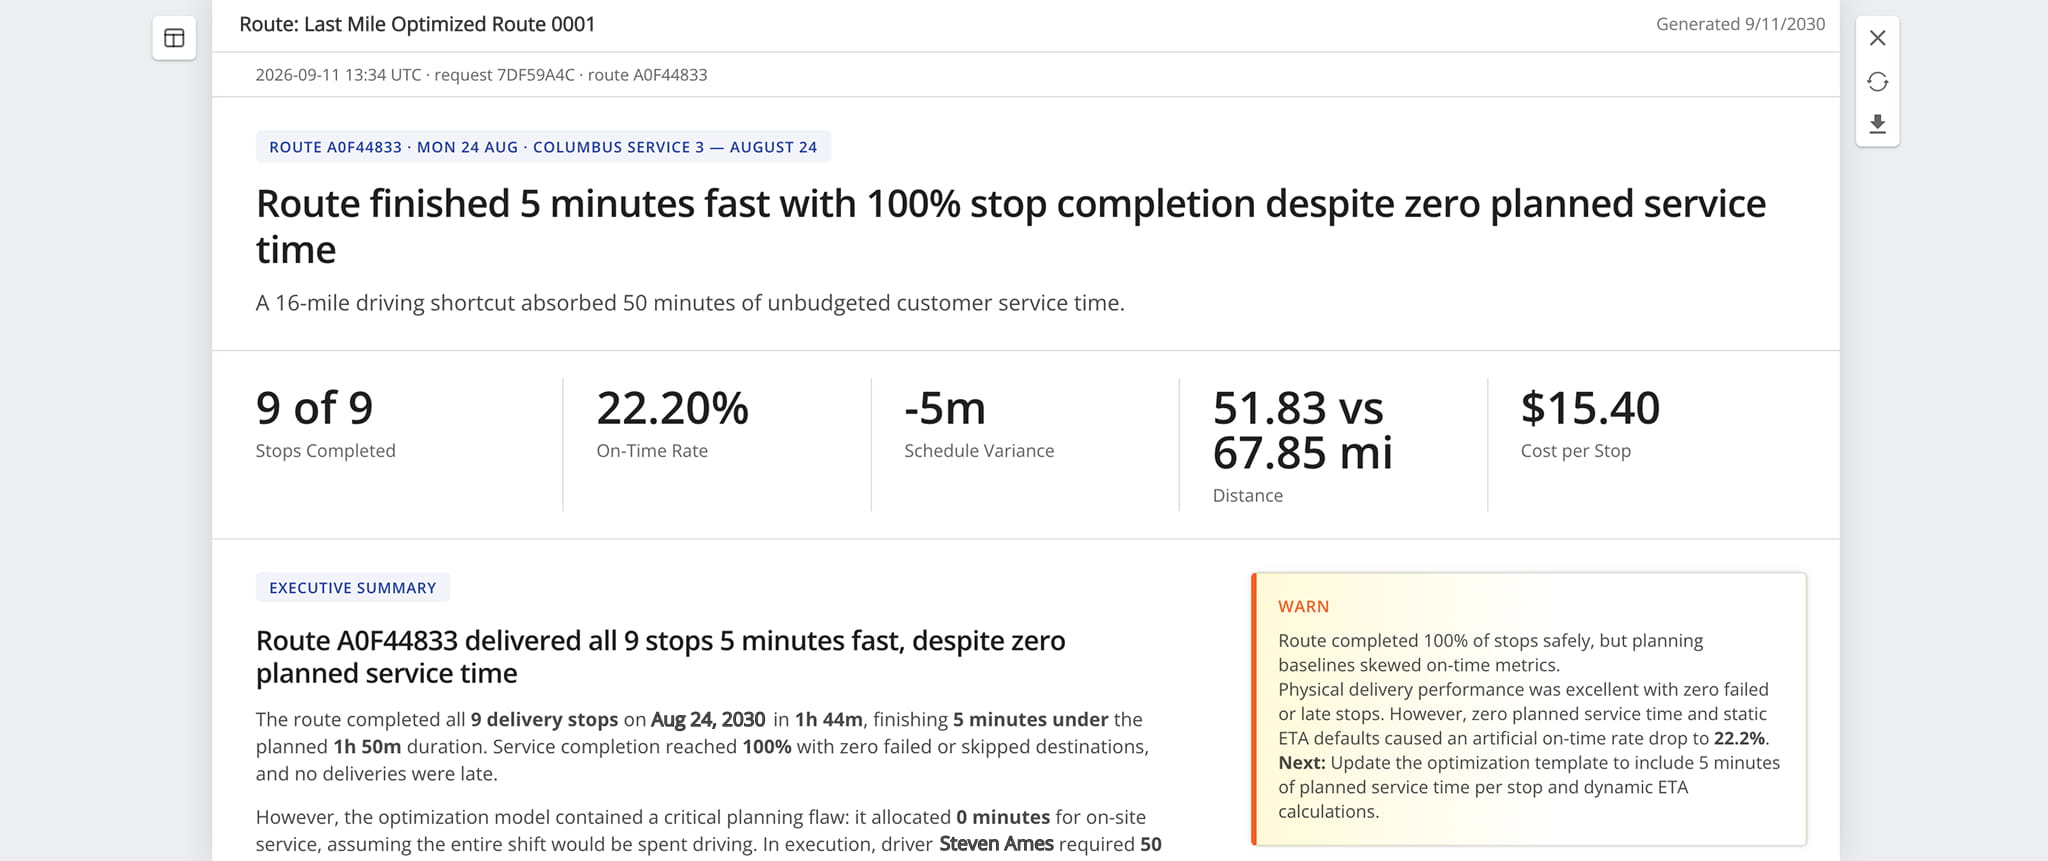
Newspaper
A clean editorial layout styled after a traditional print newspaper, ideal for a structured, text-forward presentation.
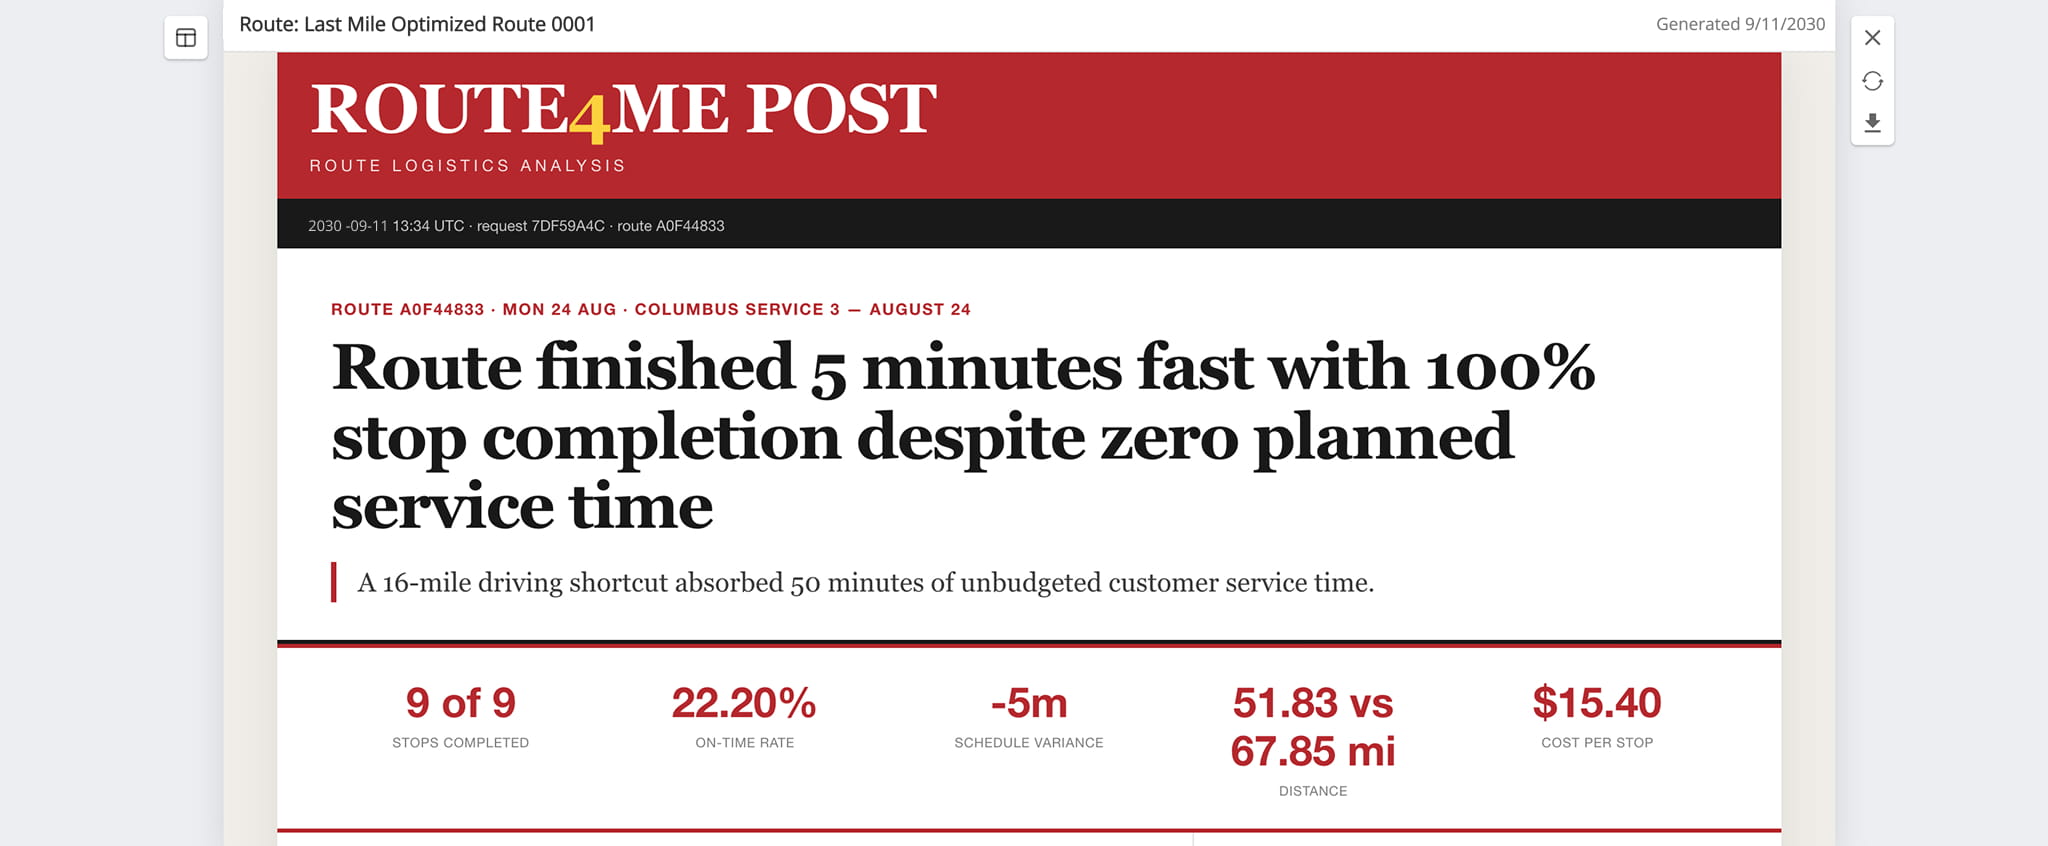
Magazine
A bold, colorful design with a modern editorial feel, suited for executive briefings and high-visibility presentations.
Classic Broadsheet
A serif-heavy, newsprint-palette layout inspired by legacy publications like the New York Times, lending a formal tone.
Visit Route4Me's Marketplace to Check out Associated Modules:
- Operations
Audit Logging and Activity Stream
- Operations
Custom Data Add-On
- Operations
Advanced Team Management Add-On
About author: Daniel Archer