Route Editor Guide – Open and Manage Planned Routes
The Route Editor is your primary tool for managing individual planned routes in Route4Me’s business routing software. From a single interface, you can track route progress, review route metrics and KPIs, update optimization settings, and manage last mile operations in real time. Any changes made in the Route Editor automatically sync with the Mobile Driver App, while User activity across the Web Platform and app can be monitored through the Activity Feed.
Table of Contents
Route Editor Overview – Open And Manage Routes In The Route Editor
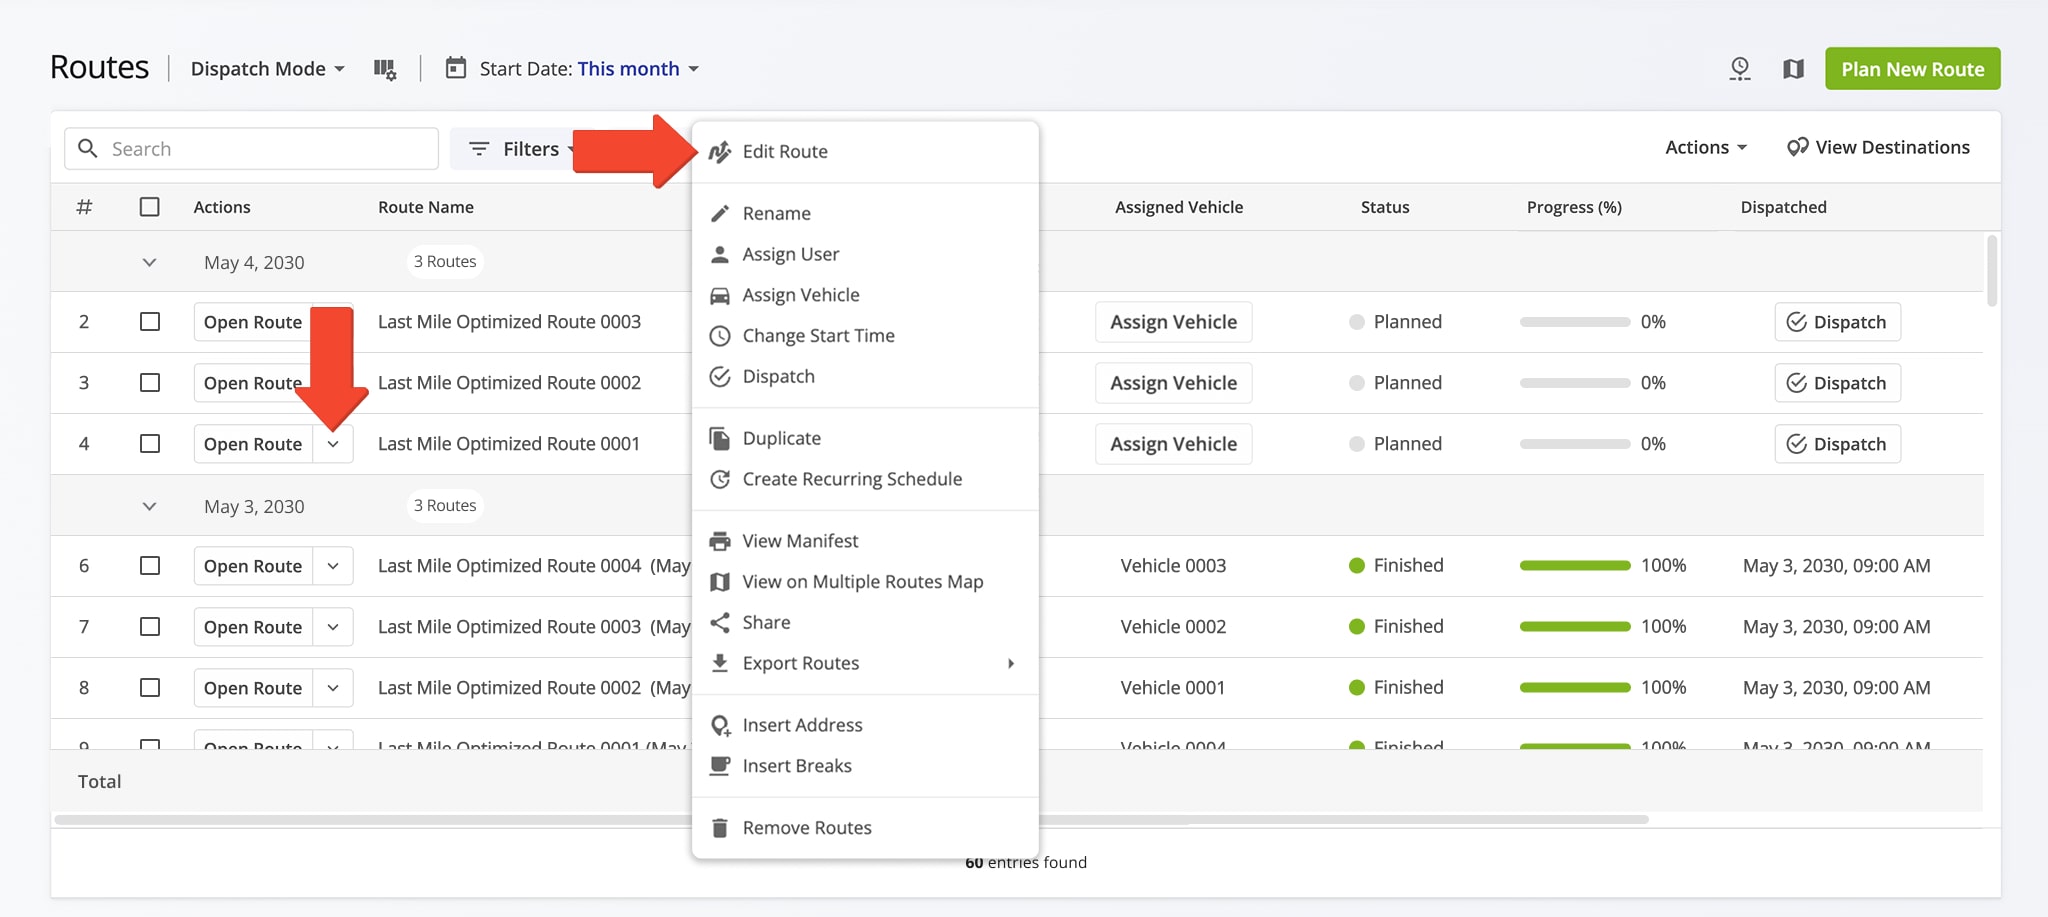
To open a planned route in the Route Editor, go to your Routes Page from the Navigation Menu. Then, right-click a route or click the Arrow Icon next to “Open Route” and select “Edit Route” from the menu.
Open Your Route4Me Routes Page
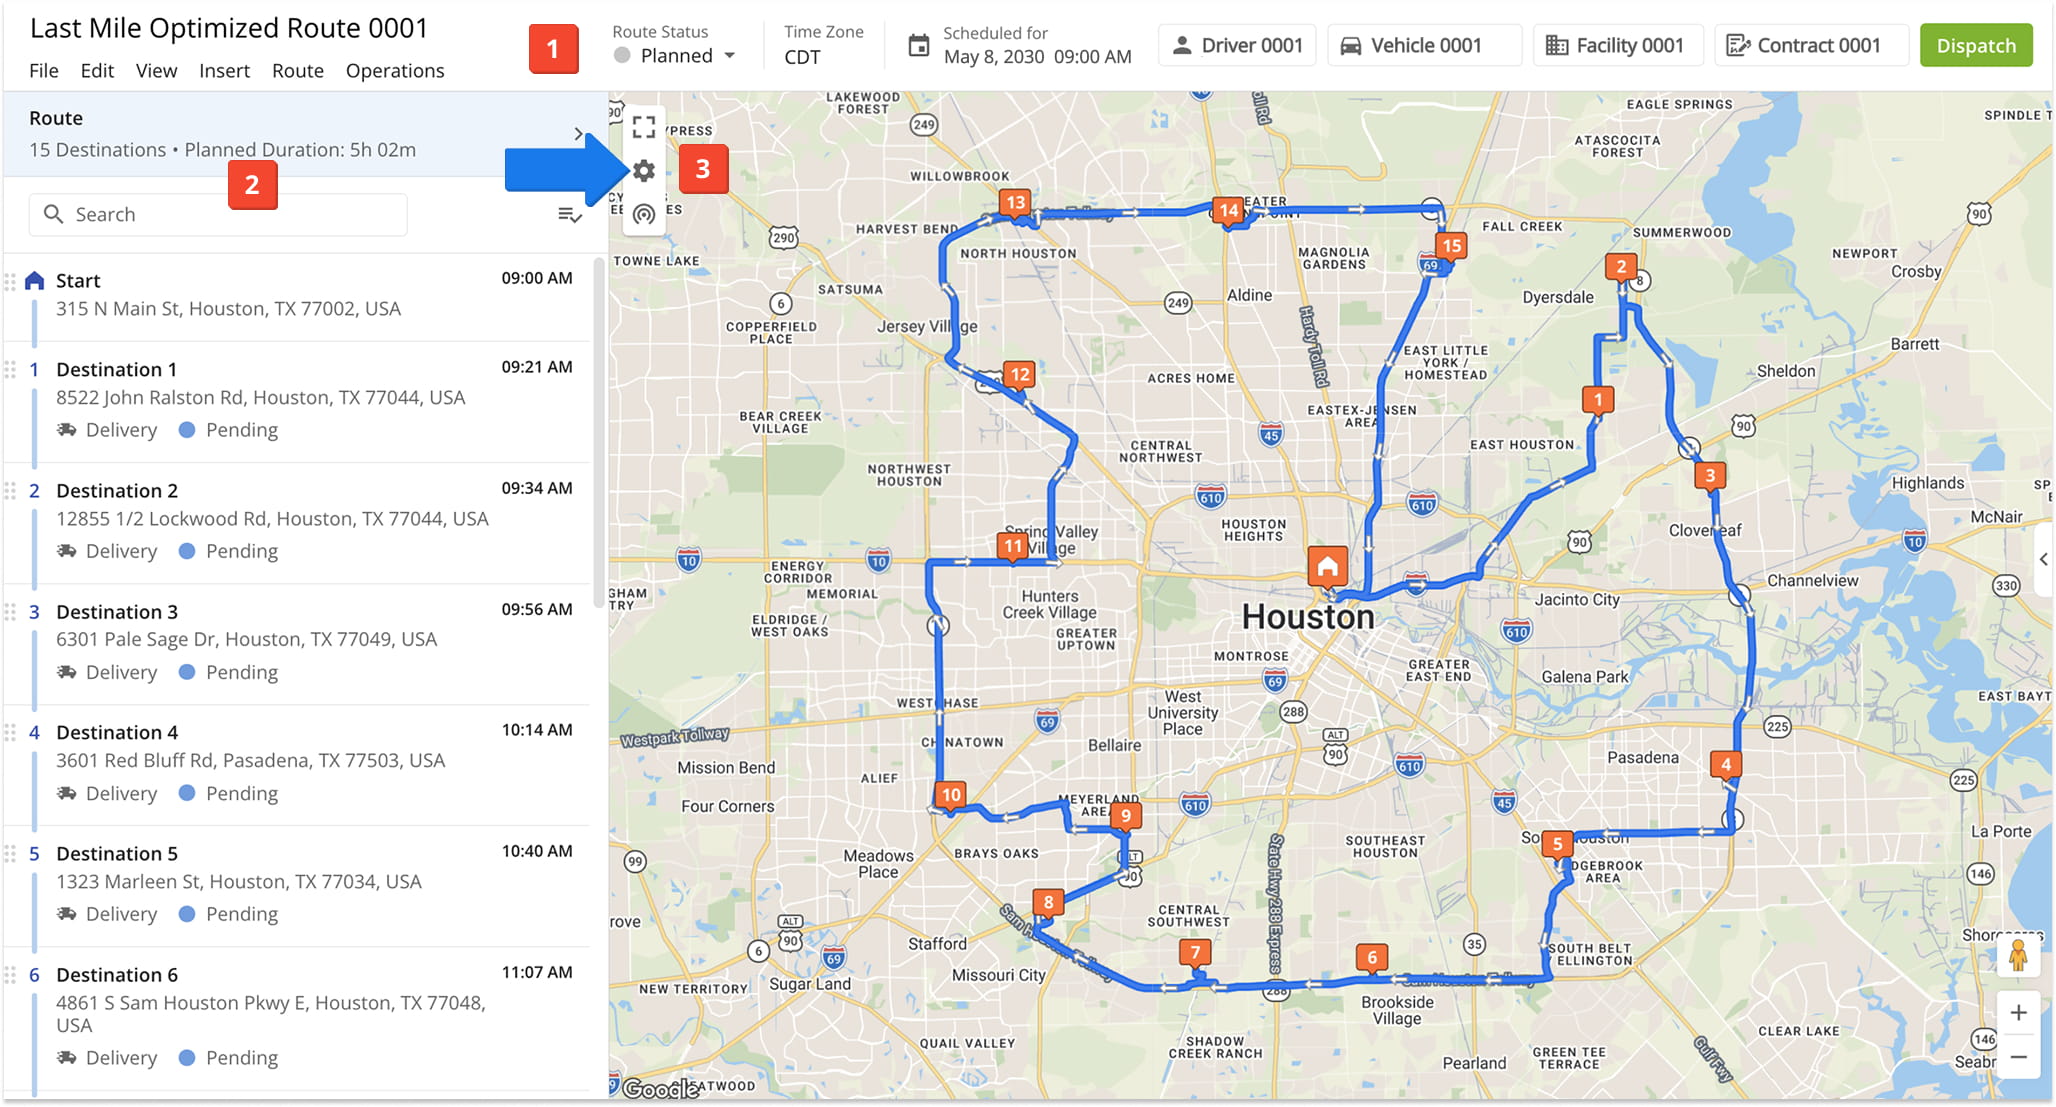
This will open Route4Me’s Route Editor which includes the following main sections:
- Route Settings Toolbar, located at the top of the screen, where you can change route and optimization settings, assign drivers, assign vehicles, dispatch route notifications, and perform other route management actions.
- Destinations List, located on the left, from which you can open and manage all Destinations on the route and access the Route Properties panel to view and edit key route settings.
- Interactive Map with which you can view and track a route, enable additional map overlays, access summarized route data from the Route Information Panel, and more.NOTE: Click the Gear Icon to open map settings. From there, you can select Road or Satellite Views and enable “Map Layers” such as live traffic, Avoidance Zones, and Territories and other map overlays, detailed in the table below.
Route Editor – Map Layers
Standard
Displays the map using a traditional street-level view.
Satellite
Displays the map using satellite imagery, showing an aerial view of the terrain.
Driving Lines
Displays the route path on the map, shown as either the actual driving path or a straight-line path between stops.
Displays geofences on the map.
ETA
Displays an ETA pop-up on the map showing estimated arrival times.
Displays a note icon on the map at each location where a note was added to the route.
Search for and filter by specific Facilities. Enable labels to show the facility name, and select a metric to display, such as SLA Score, Time, Destinations, Distance, or Continuous Sequence Adherence.
Enable clusters to group nearby Locations, or enable a heat map to visualize location density.
Enable clusters to group nearby Orders on the map.
Search for and filter by specific Vehicles. Enable labels, a fuel/battery level icon, and an Active Vehicles icon. For Active Vehicles, set the last update period anywhere from 5 minutes up to 24 hours, or define a custom time.
Search for and filter by specific Users. Enable labels to show each user's name next to their icon on the map.
Search for and filter by specific Assets. Enable labels to show each asset's name next to its icon on the map.
Search for and filter by specific Territories to display on the map.
Search for and filter by specific Avoidance Zones to display on the map.
Traffic
Displays traffic density on the map.
Enable weather overlays on the map, including radar, satellite, wind, storm, snow, and temperature.
Displays safety incidents on the map at the locations where they occurred.
Route Settings – Edit, Re-Optimize, Reschedule Routes And More
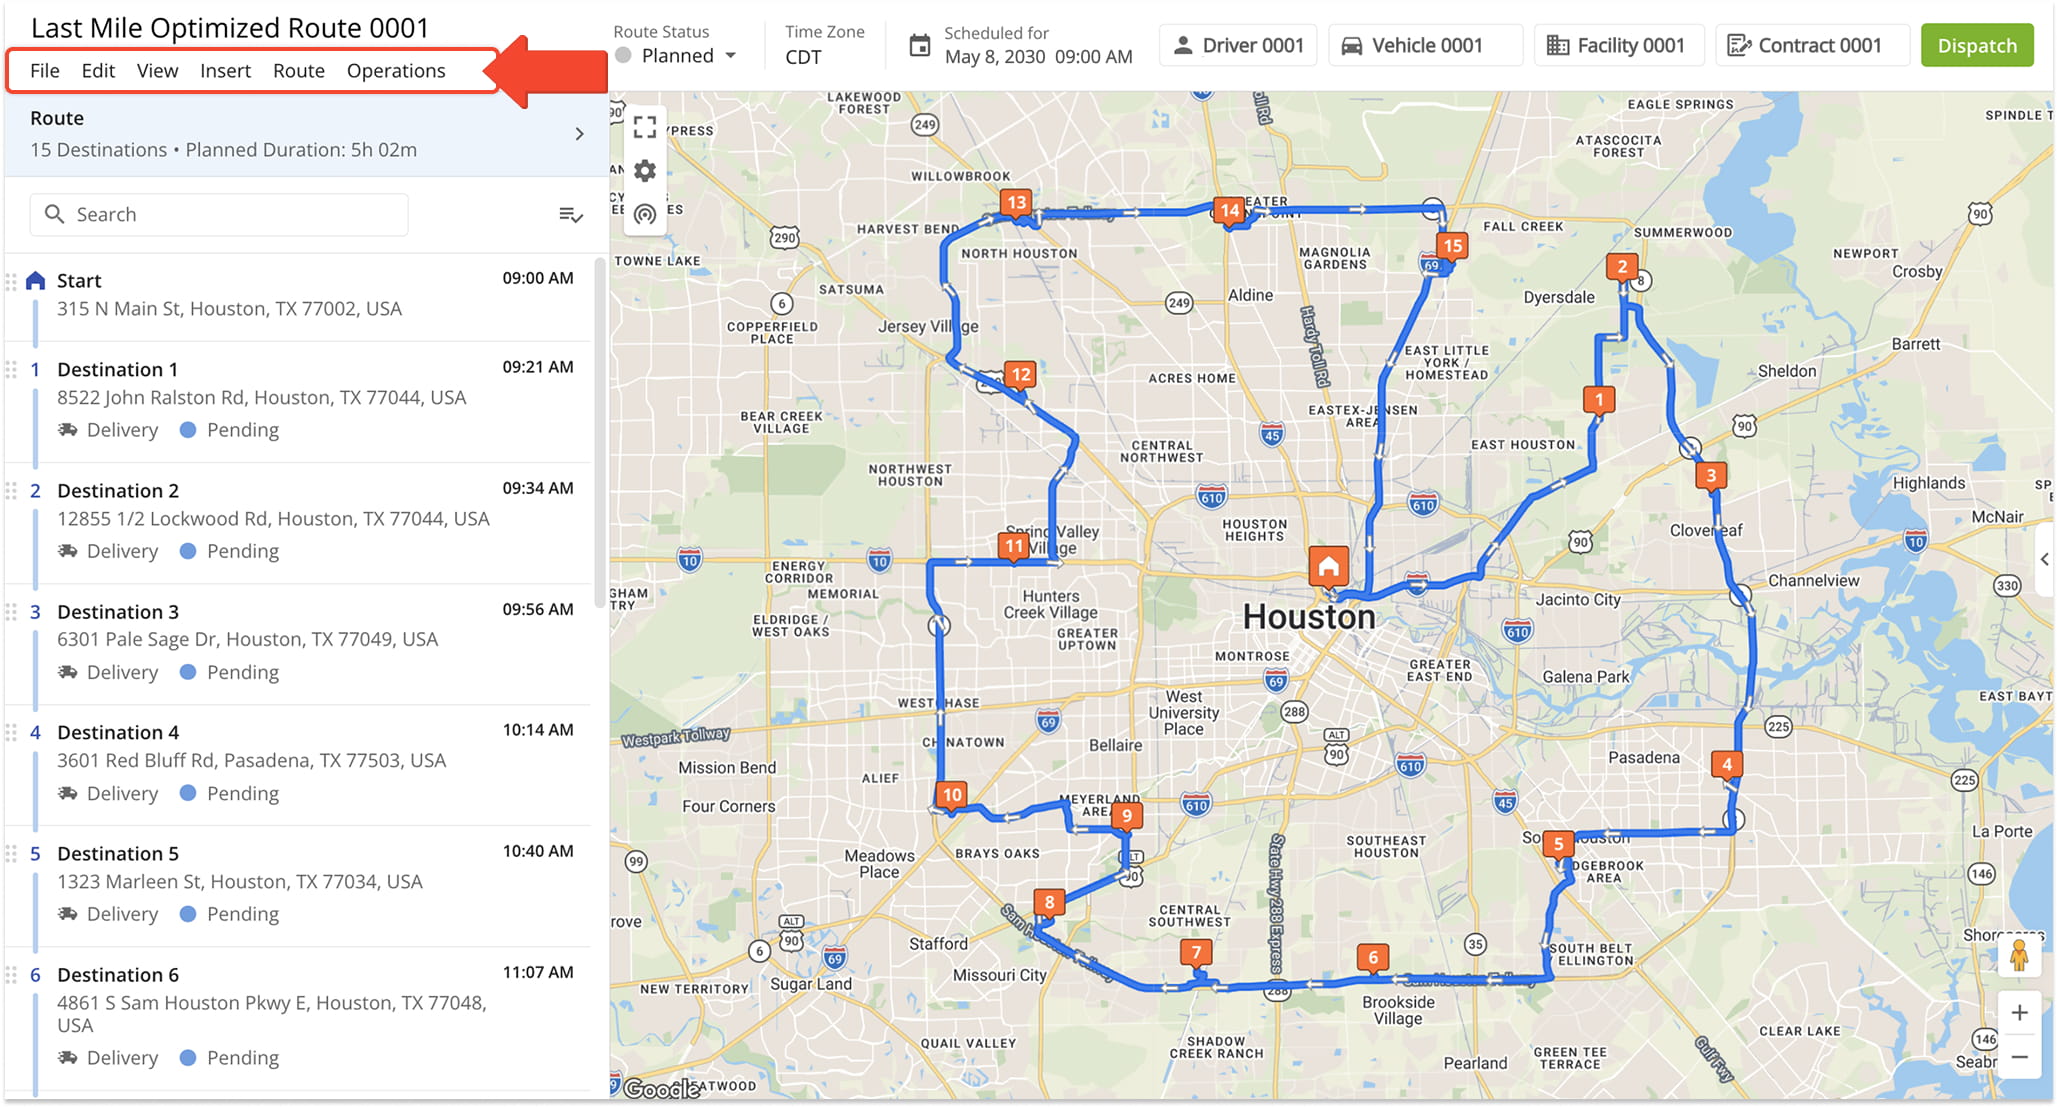
Route Editor Toolbar
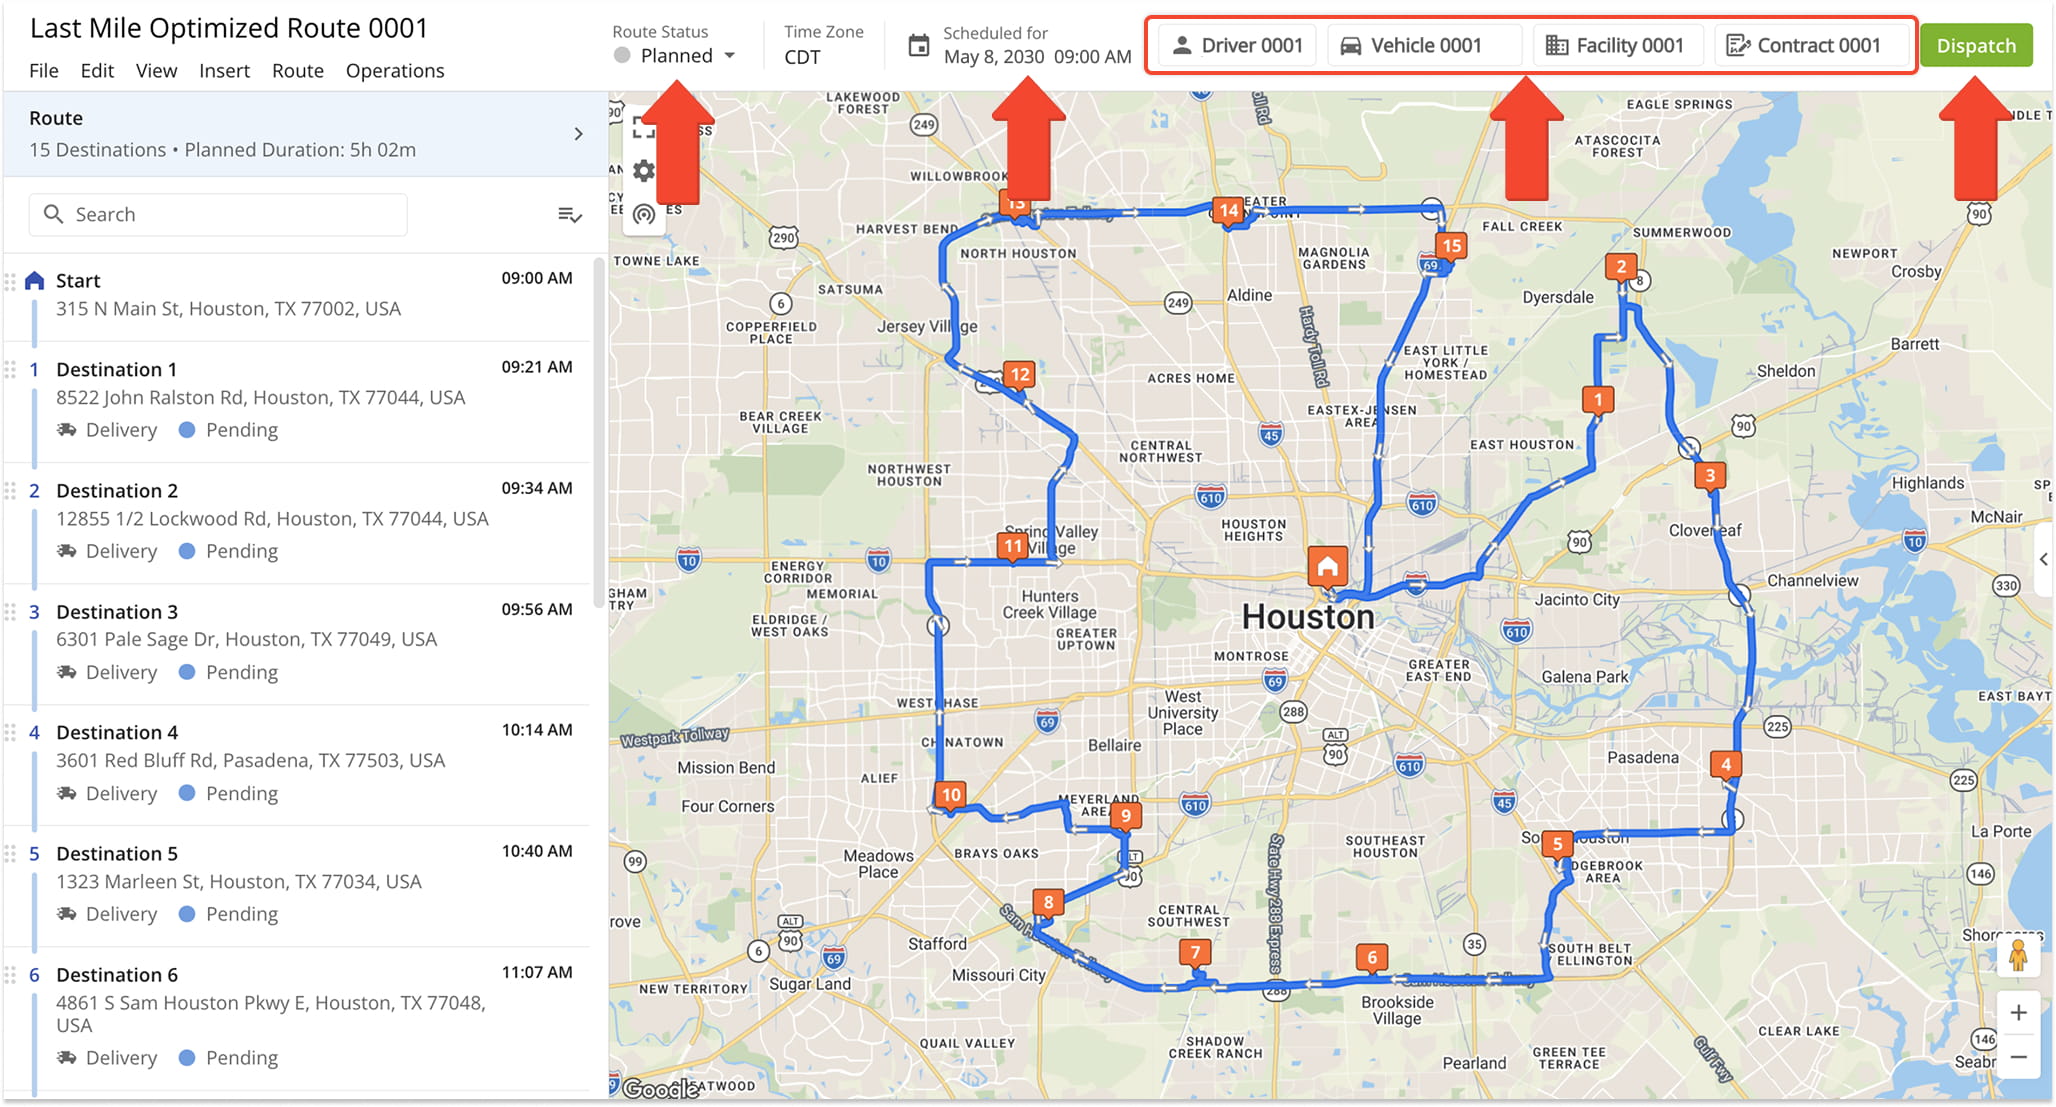
The Route Editor Toolbar enables you to view the route’s current status and make quickly route updates, such as rescheduling a route, assigning vehicles and users, and dispatching route notifications. Click the corresponding button to make adjustments.
Top Menu Bar
You can also insert addresses and driver breaks, export route data, and perform other route management actions via the Top Menu Bar. See the table below for details.
| Option | Description | |
|---|---|---|
| File | ||
| Share This Route | Send a route link via email to users or sub-users on your account, or copy a direct link to share through other channels. | |
| New Route | Plan a new route. | |
| Duplicate Route | Create a copy of the current route in the Route Editor, adding “(Duplicate)” to the route name. Selecting this option closes the original route and opens the new duplicate. | |
| Export Route | Download route data in various formats, including customizable CSV spreadsheet, GPS navigation files, custom-sized route images, or Route Notes. | |
| Edit | ||
| Open Route Settings | Open the “Route Settings” panel to customize route and optimization options. | |
| Assign User | Assigns a team member to the route. The assigned User is responsible for completing the route and can open, start, and finish it using the Route4Me Mobile App. This option is accessible via a button in the Route Editor Toolbar. | |
| Assign Vehicle | Assigns a Vehicle from your fleet to the route. This option is also available as a button in the Route Editor Toolbar. | |
| Change Start Time | Reschedule the route by updating its Start Date and Start Time. | |
| Delete This Route | Removes the route from your account. You can restore a deleted route using the corresponding Account Optimization. | |
| View | ||
| View Manifest | Opens the customizable Route Manifest, offering a detailed overview of route metrics, order details, capacity status, directions, visitation progress, logistics KPIs, and more. | |
| View On Multiple Routes Map | Open the route in the Routes Map, where you can view and manage multiple routes simultaneously. | |
| Simulation Tool | Open the Automated Route Simulation tool, which offers a preview of a planned route, including turns, travel speeds, and more. | |
| Route Summary | Reveal or conceal the Summary Table at the bottom of the Route Editor Map, displaying customizable planned and actual route data. | |
| Insert | ||
| Insert Breaks | Adds a customizable Hours of Service Driver Breaks to the route. Breaks can be set automatically with a custom duration based on conditions like travel time, service time, or number of stops visited. | |
| Insert Address | Add an additional customer address to the route as a Destination. You can also insert addresses directly from the map by right-clicking on the desired location. | |
| Insert Multiple Addresses | Adds multiple customer addresses to the route as Destinations by entering them manually or selecting them on the map. Route4Me automatically geocodes addresses that you insert. | |
| Upload Addresses | Add customer addresses to the route as Destinations by uploading a spreadsheet. Route4Me will automatically geocode addresses that you upload. Learn more about Route4Me Spreadsheet Formatting. | |
| Route | ||
| Re-Optimize This Route | Recalculates the most efficient Destination sequence and directions after you change route or optimization settings. Without re-optimizing, Route4Me only updates directions based on Destinations or sequence changes. | |
| Re-Optimize Remaining Destinations | Recalculates the most efficient Destination sequence and directions for unvisited Destinations after the route has started. | |
| Refresh Directions | Recalculates the most optimal travel directions without changing the Destination sequence, maintaining the current Destination order. | |
| Reverse Route | Reverse the Destination sequence on the route. “Reverse Entire Route” swaps both the start and end addresses along with Destination order. “Reverse Destinations Only” reverses the Destination order while keeping the original start address. NOTE: For round-trip Routes, the start and end Destination are always the same. | |
| Split Into A New Route | Move selected Destinations from the current route into a newly created route. | |
| Unlink Route From Optimization | Disconnects the current route from its associated Optimization. Each planned route is automatically linked to a unique Optimization. Learn more about Optimizations. | |
| Operations | ||
| Dispatch | Send automatic customer notifications to all contacts on the route, informing them when, where, their orders will be completed. | |
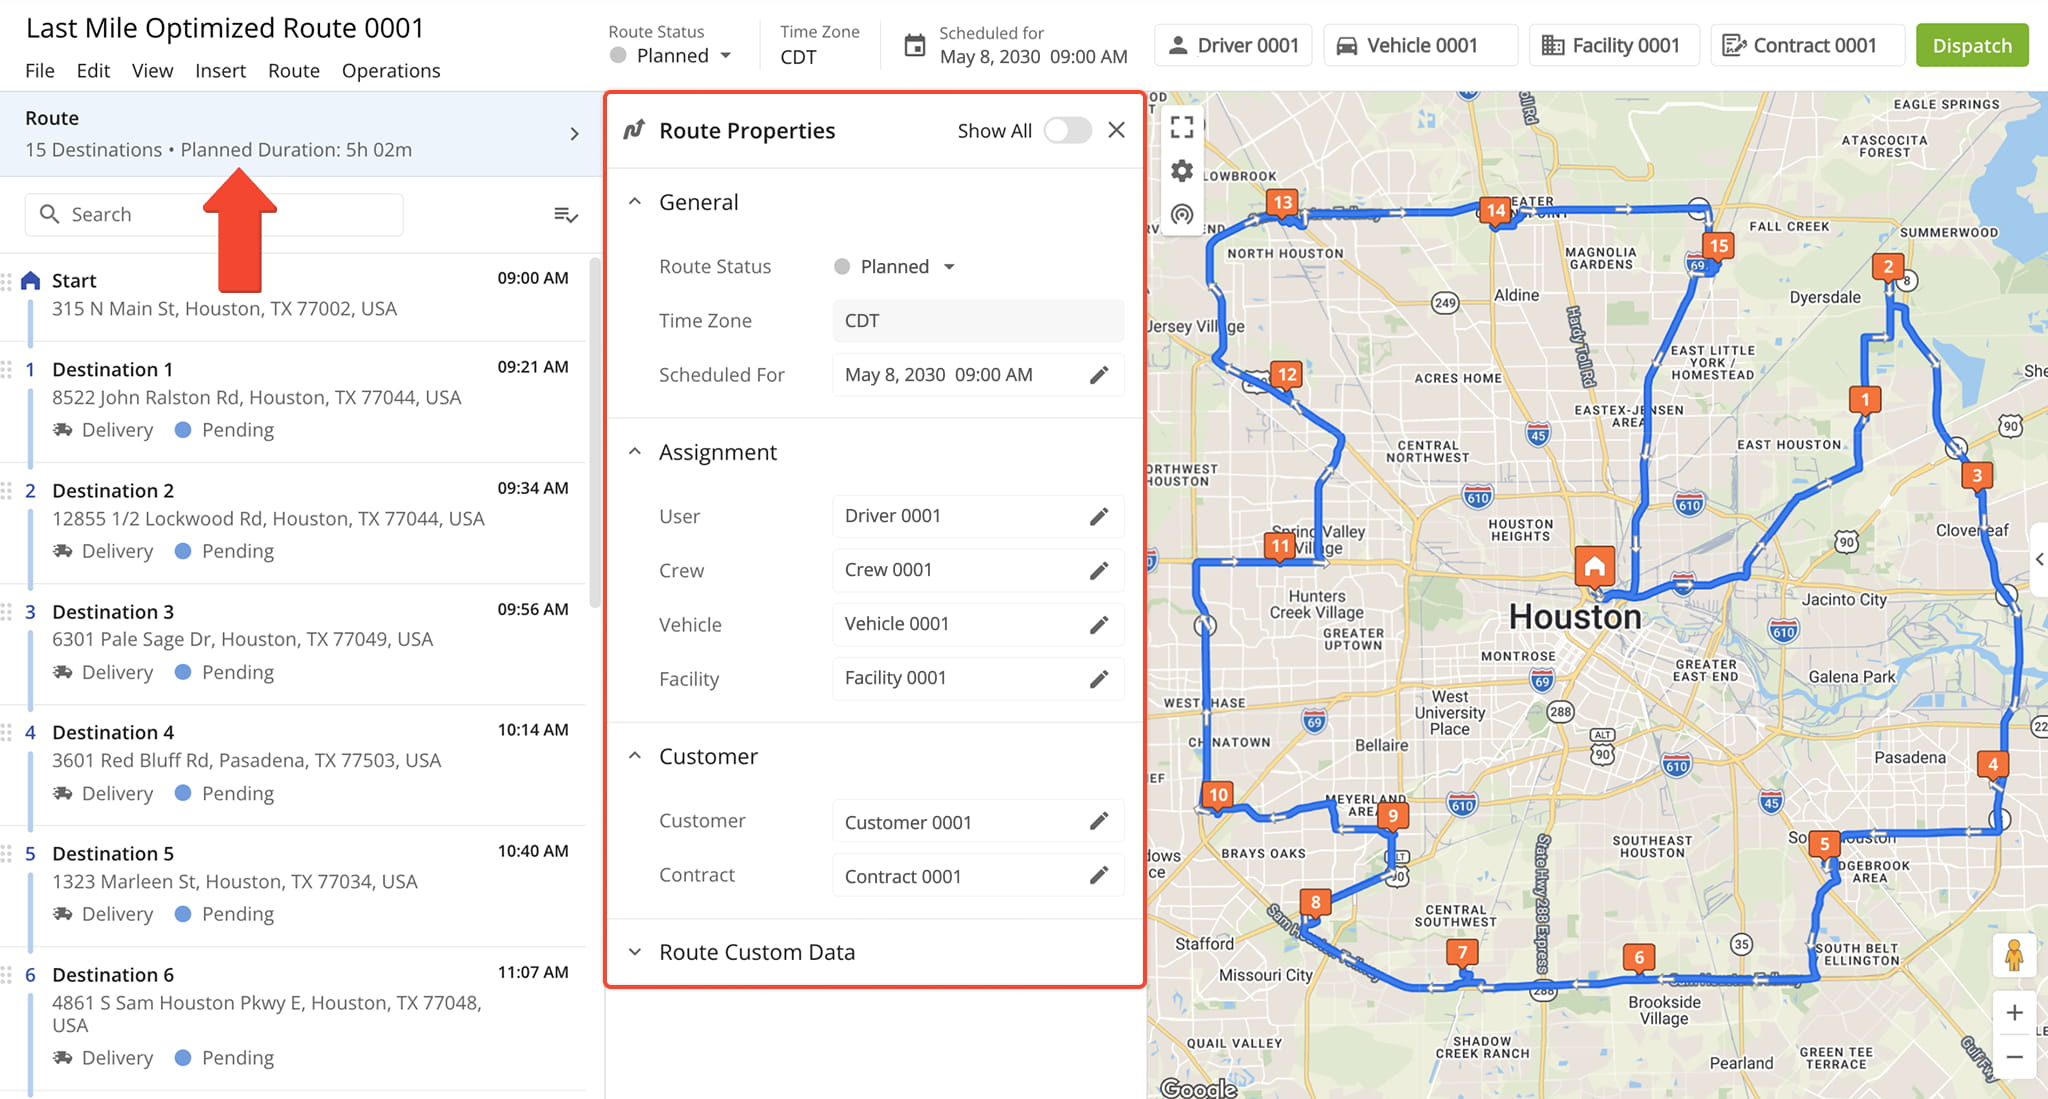
Route Properties Panel
The Route Properties panel provides a centralized view of the route’s key details and configuration settings, enabling you to review and update information such as route parameters, assigned resources, scheduling, and optimization preferences.
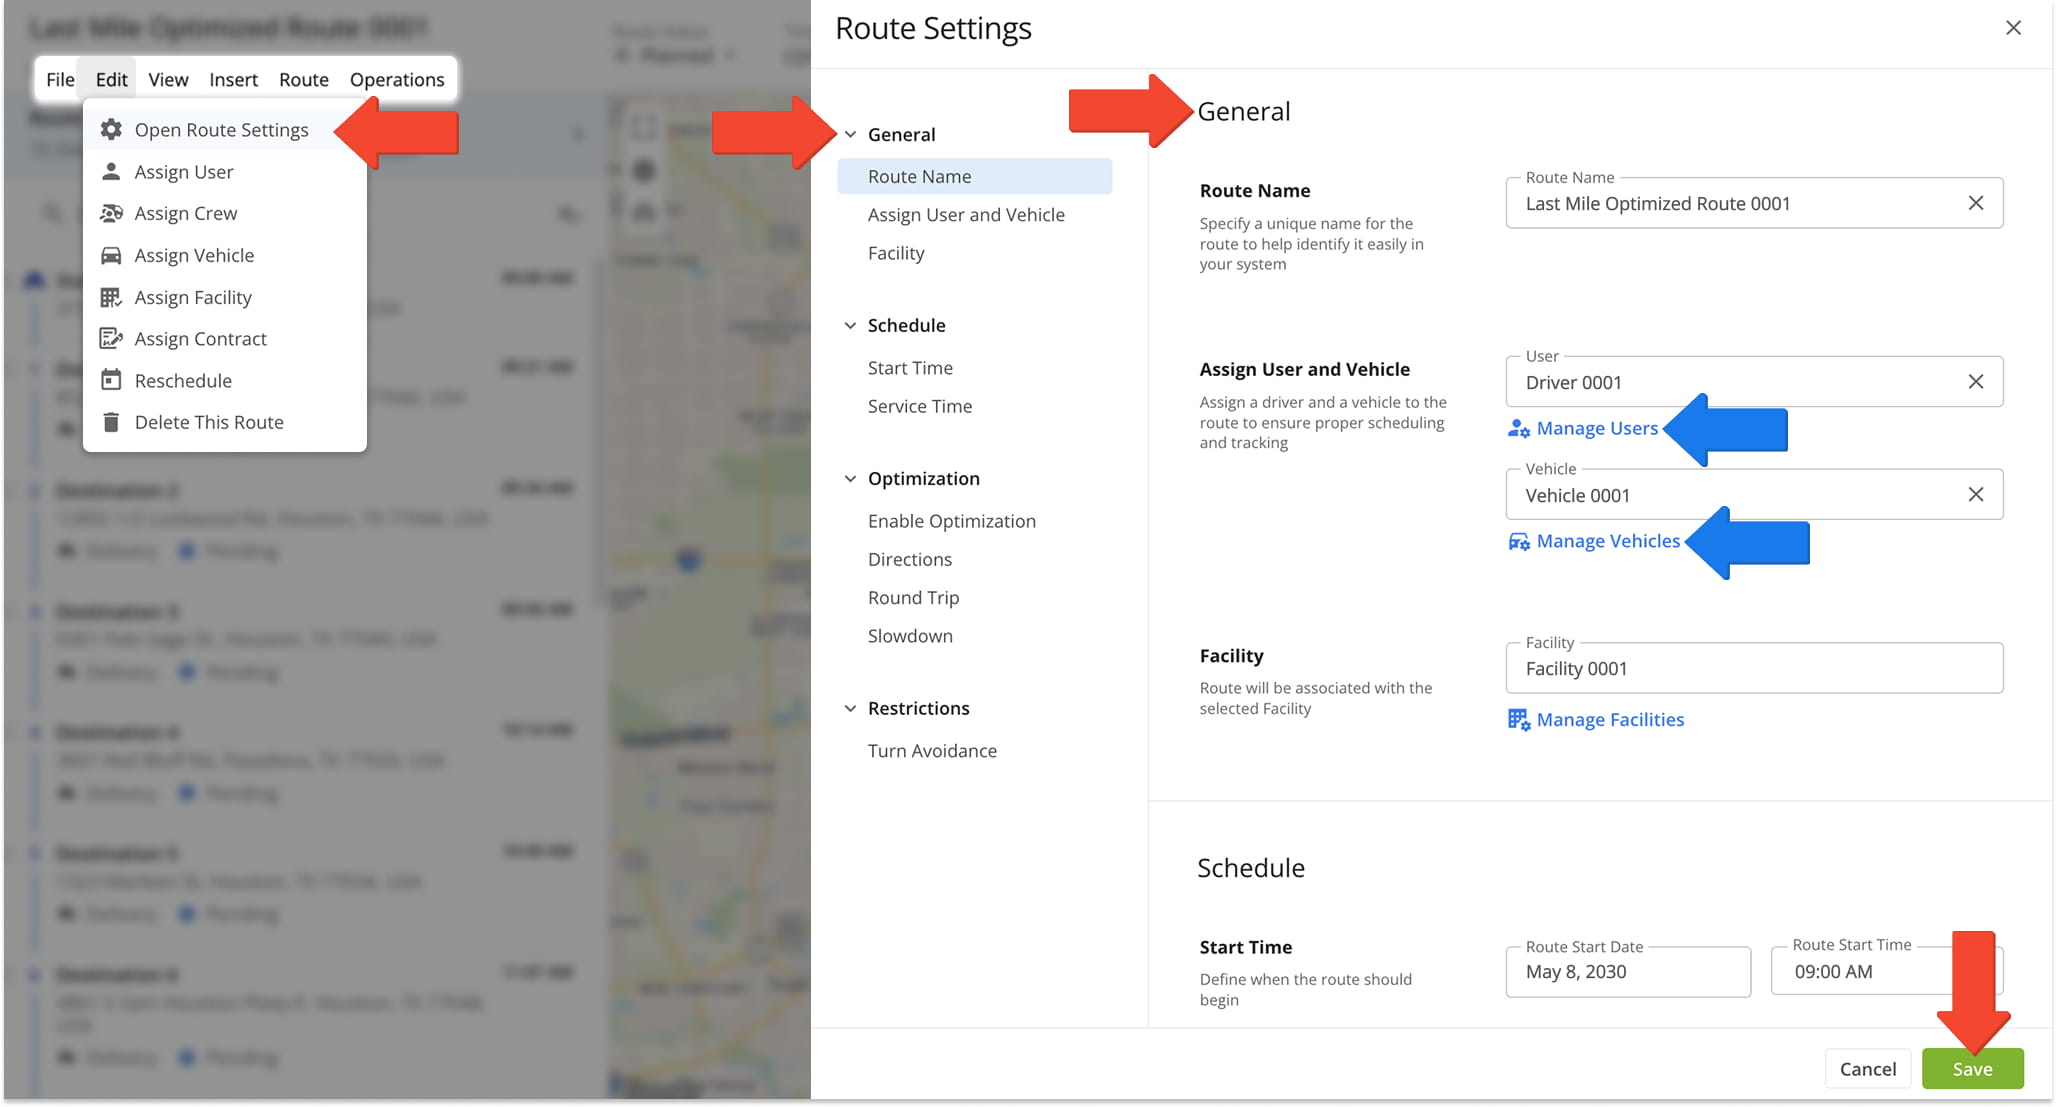
Route Settings Panel
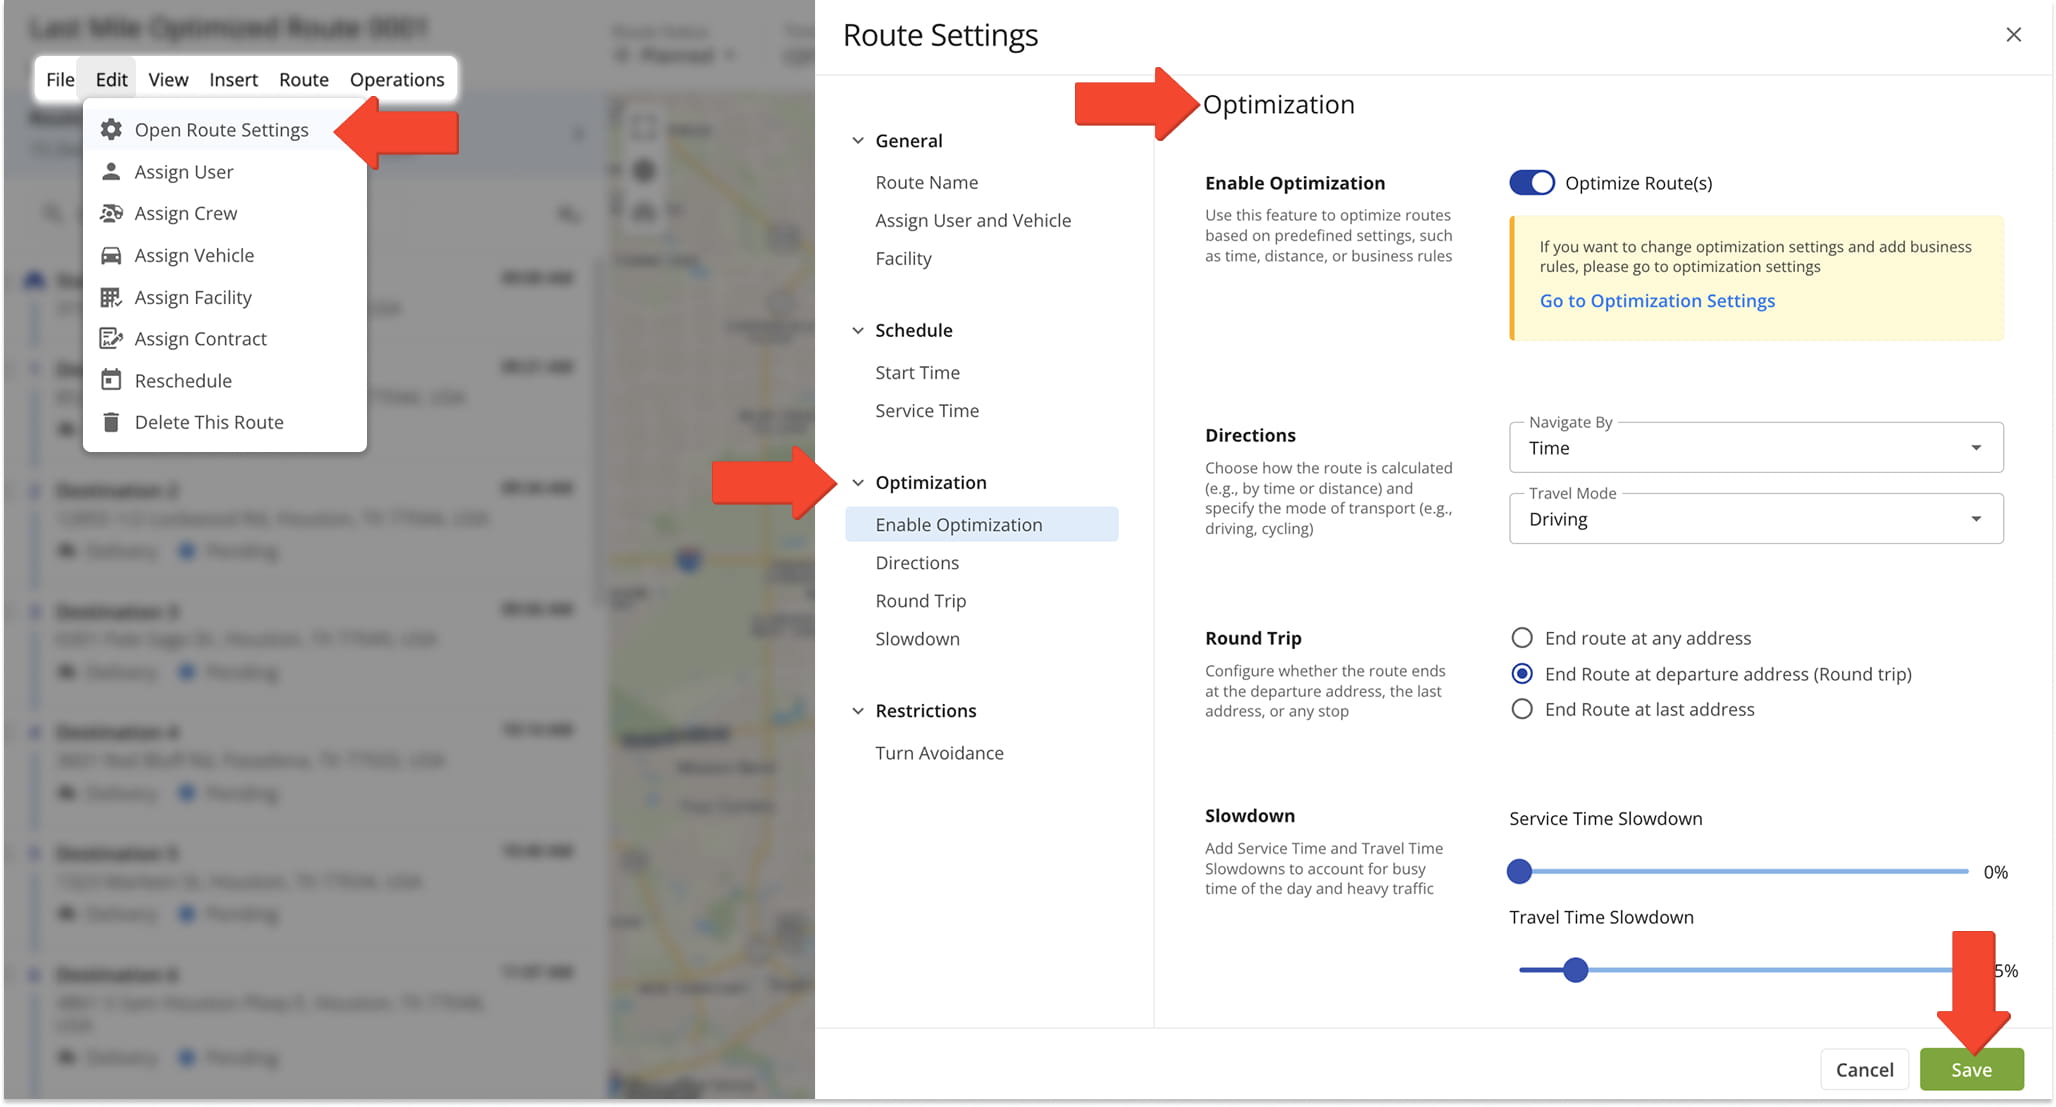
You can access the Route Settings panel from the Top Menu Bar by clicking “Edit” and selecting “Open Route Settings“. Adjust settings as needed, then click “Save” to apply the changes. From the “General” section, you can access the following settings:
| Option | Description |
|---|---|
| Route Name | The name, or alias, of the planned route. You can use the Route Name to easily find and identify the planned route. |
| Assign User And Vehicle | Assign a driver and assign a Vehicle to the route. You can click the “Manage Users” and “Manage Vehicles” buttons to access your Users and Vehicles pages respectively. |
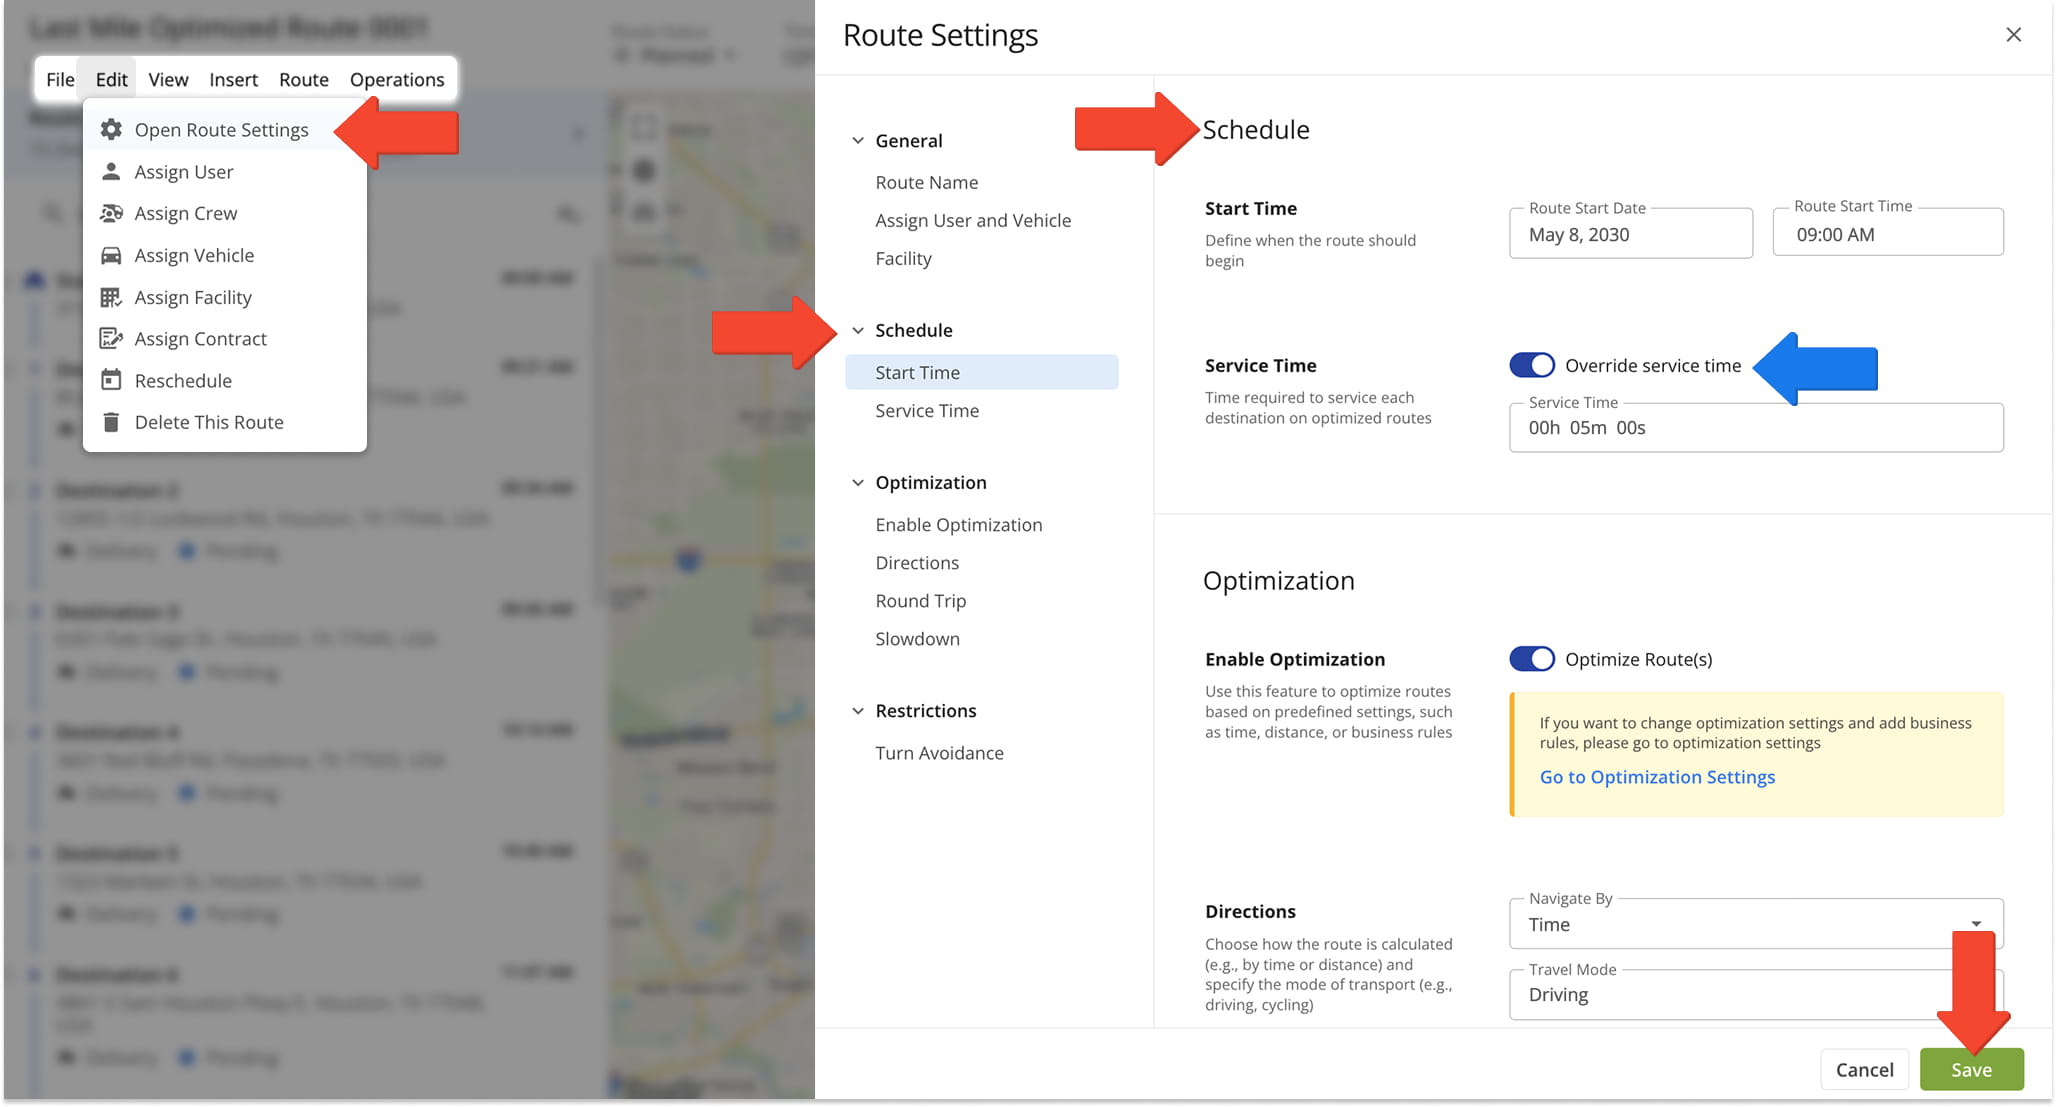
The “Schedule” section enables you to adjust a route’s scheduled start date, start time, and Service Time. You can use the “Override service time” toggle to apply a new Service Time to all Destinations on the route. See the table below for details:
| Option | Description | |
|---|---|---|
| Start Time | ||
| Route Start Date | Define the date on which the route will start. | |
| Route Start Time | Define at what time on the Route Start Date the route will start. | |
| Service Time | ||
| Override service time | Set a time in the “Service Time” field which will be applied to all route Destinations, replacing any existing Service Time durations with the one you enter. | |
| Service Time | The time needed to complete a Destination or Customer Order. | |
In the “Optimization” section, you can adjust settings like travel mode, final Destination type, Traffic Slowdown, and Service Time Slowdown. Learn more in the table below:
| Setting | Description |
|---|---|
| Enable Optimization | Automatically arranges Destinations in the most efficient order and generates travel directions based on your selected settings. NOTE: Optimization is enabled by default. If disabled, the system will generate directions without reordering Destinations. |
| Directions | Choose whether the route is calculated by time or distance and select the travel mode. |
| End route at any address | Allows Route4Me to optimize the Destination sequence and automatically select the most efficient address as the final Destination. |
| End route at departure address (Round Trip) | Optimizes the Destination sequence to create the most efficient route that both starts and ends at the departure address. |
| End route at last address | Optimizes the Destination sequence to create the most efficient route that ends at the final address in your list. |
| Service Time Slowdown | Adds extra time at each Destination to account for potential service delays or unforeseen issues during deliveries and visits. |
| Travel Time Slowdown | Adds a buffer to travel time to account for traffic congestion, delays, or other unexpected travel conditions. |
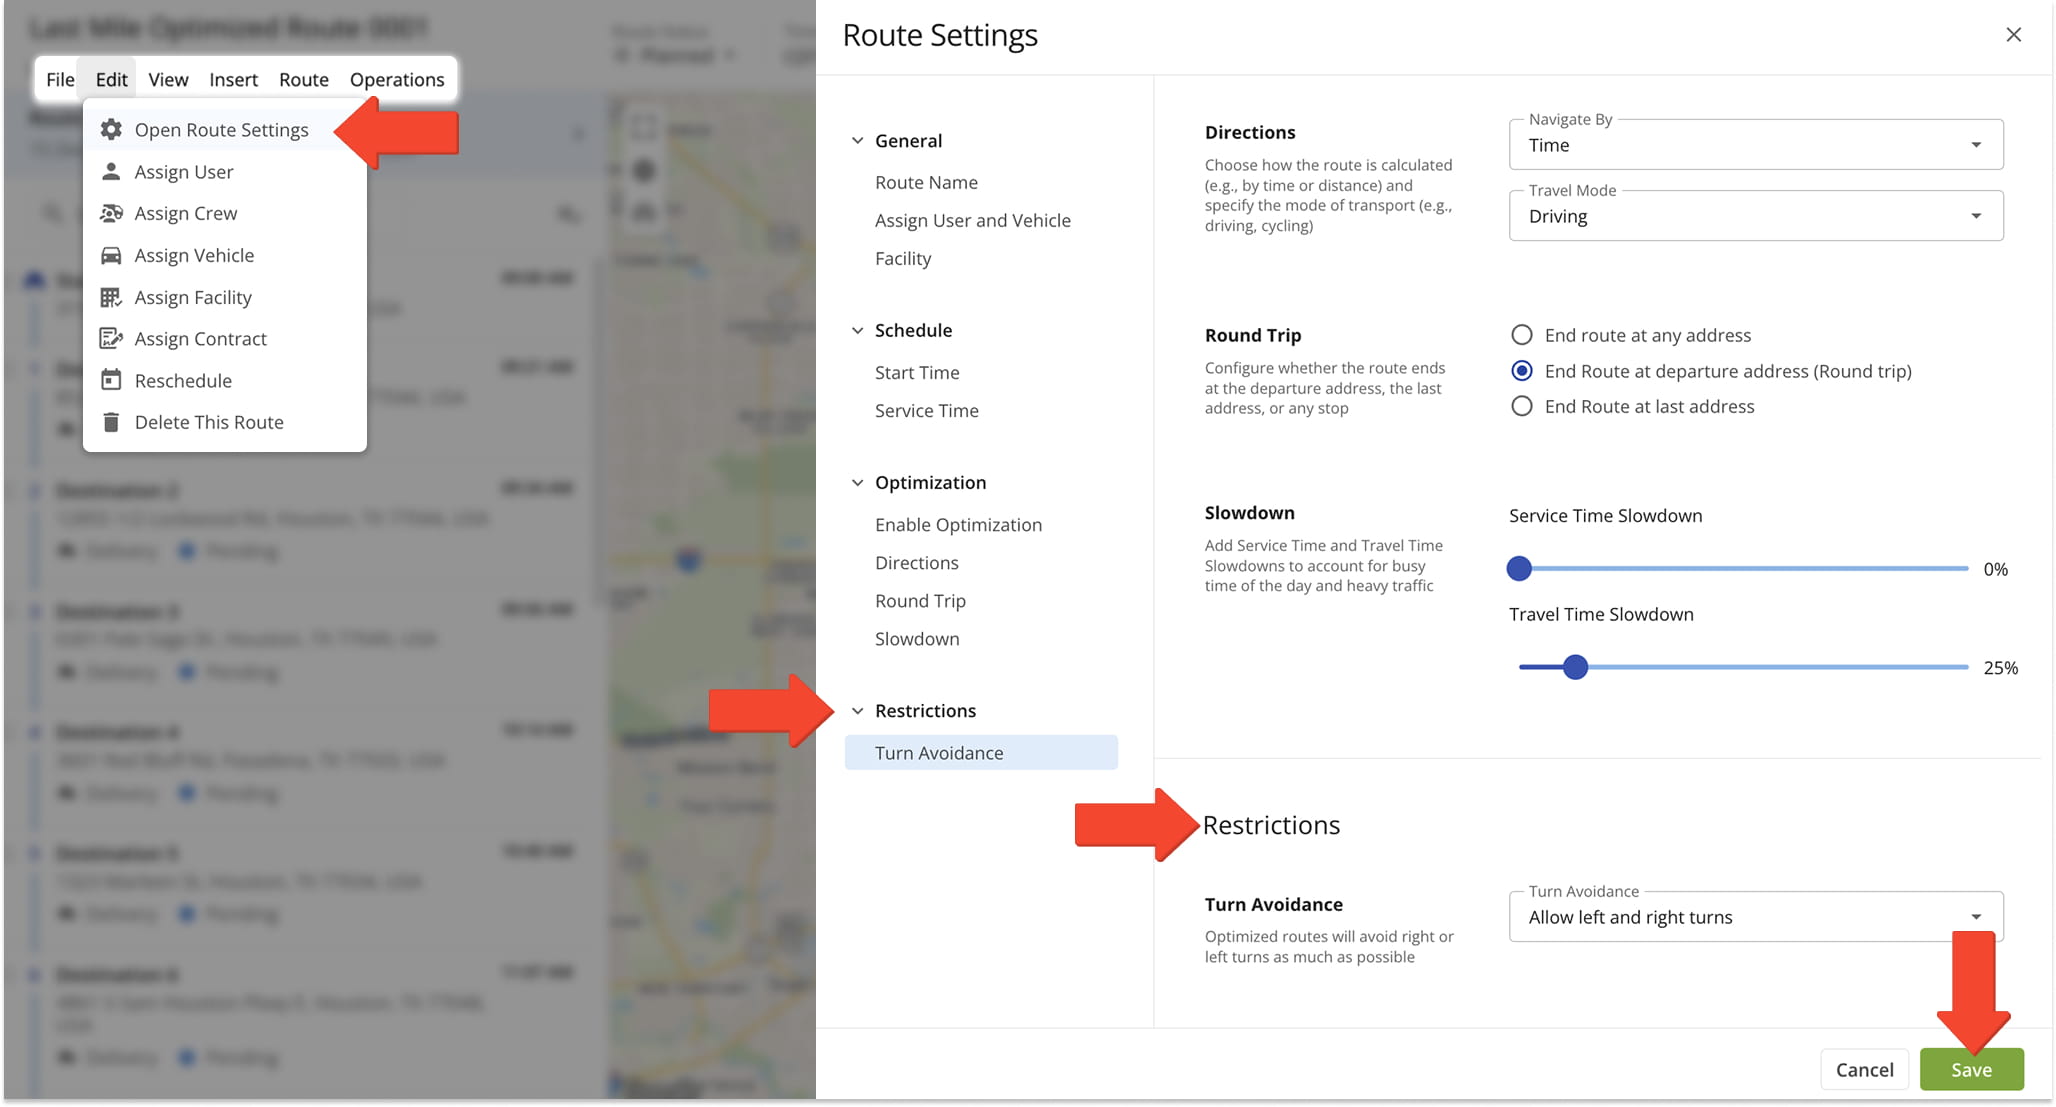
The “Restrictions” section helps you set route path limitations, such as avoiding left or right turns. See the below table for details on the restrictions:
| Option | Description | |
|---|---|---|
| Turn Avoidance | ||
| Allow left and right turns | Default setting. Both left and right turns are allowed, and the route is optimized without turn restrictions. | |
| Allow left turns | Optimizes the route to avoid right turns. NOTE: The route will include only left turns where possible. | |
| Allow right turns | Optimize the route to avoid left turns. NOTE: The route will include only right turns where possible. | |
Manage Destinations – Edit Destinations And View Destination Info
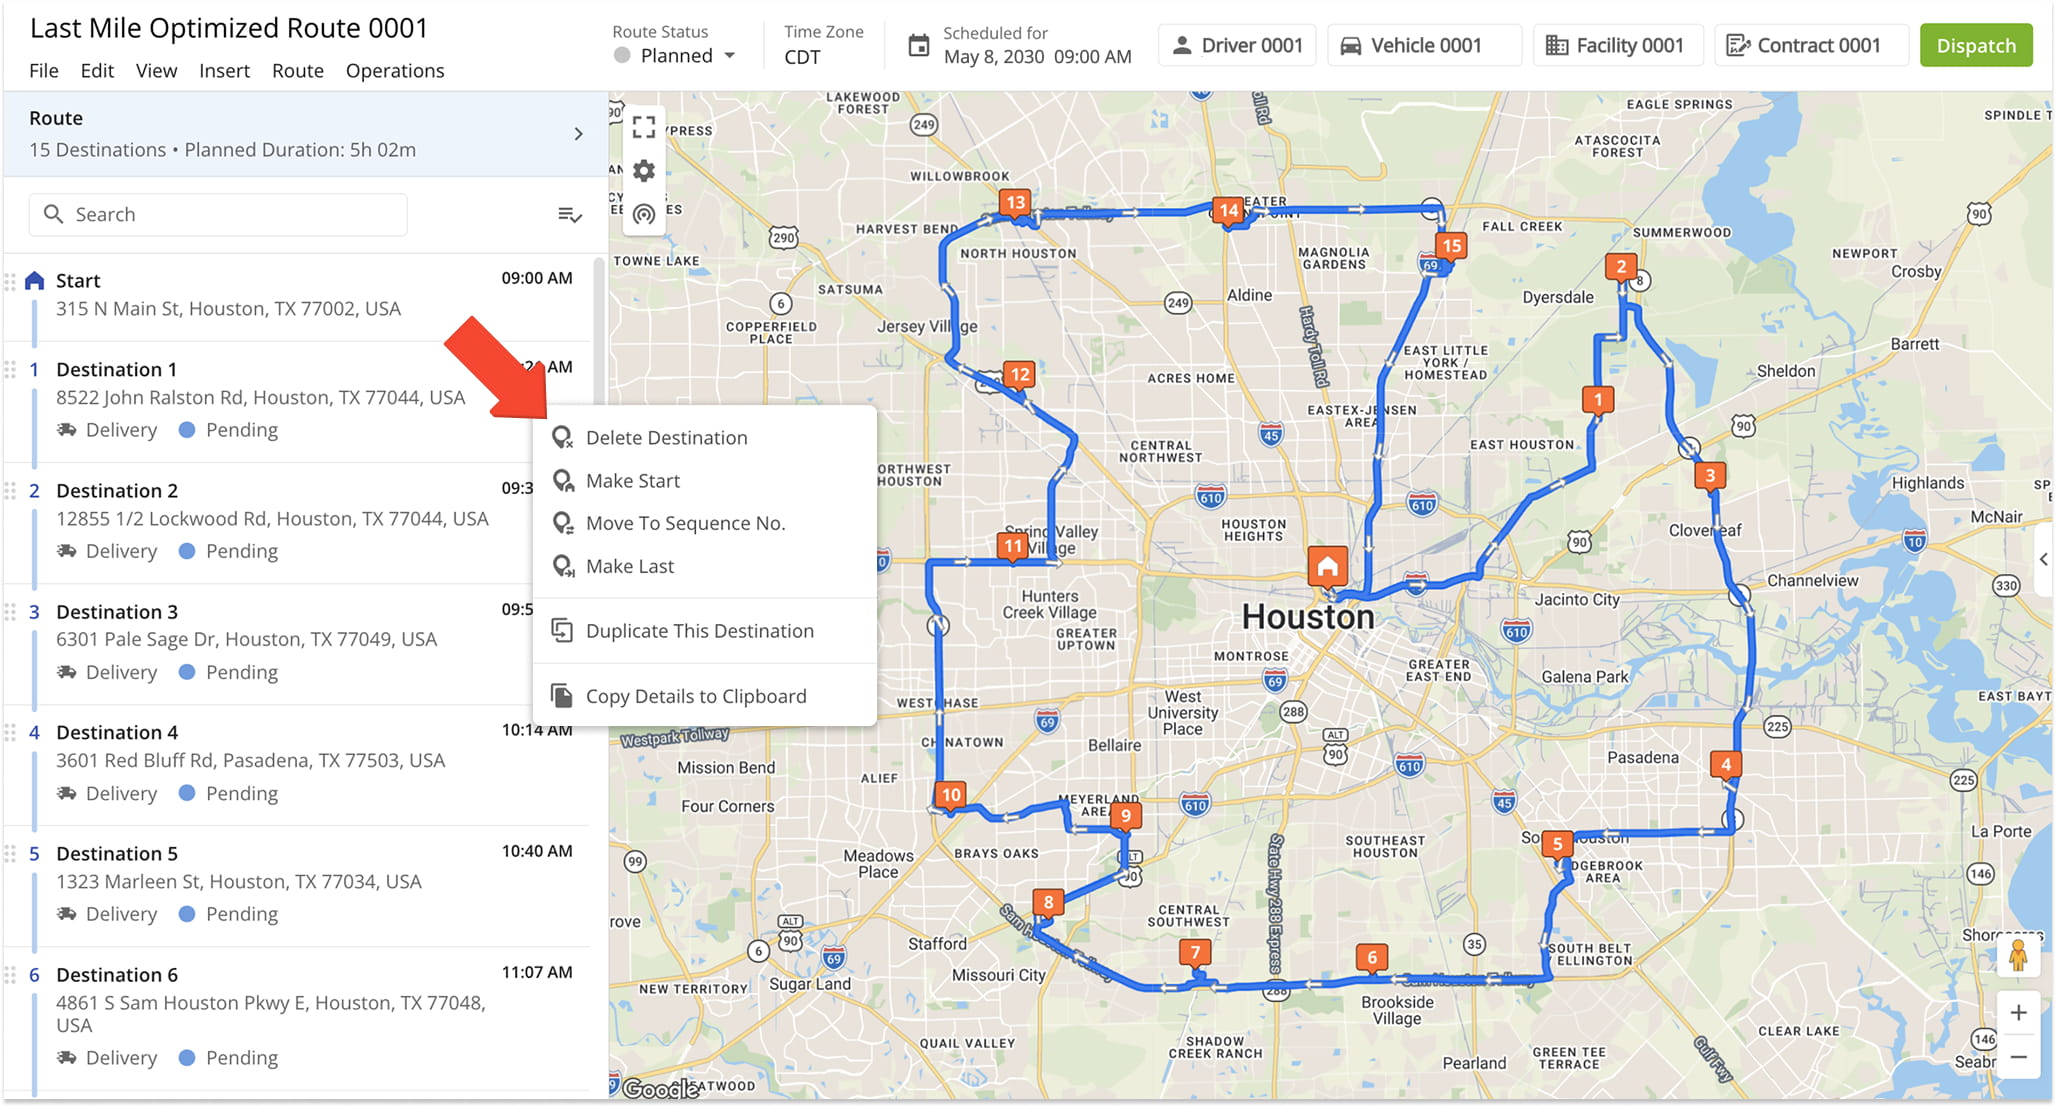
From the Route Editor, you can move, copy, delete, and edit Destinations. To edit a Destination from the Destinations List, right-click on it and select an option from the menu. See the table below for a breakdown of available edit options.
From the Destinations List, you can also click on and drag Destinations to reorder them. The route will automatically update. NOTE: After making changes to Destinations or route settings, re-optimize the route to ensure the most efficient directions.
| Option | Description |
|---|---|
| Delete Destination | Deletes the Destination from the route, shifting the following Destination up in the sequence. |
| Make Start | Sets the selected Destination as a new route start, updating the sequence accordingly. |
| Move To Sequence No. | Moves the Destination to a specified position in the route, updating the sequence. |
| Make Last | Sets the selected Destination as a new final destination, updating the sequence accordingly. |
| Duplicate This Destination | Creates a copy of the Destination at the same address, including all original information and attributes. |
| Copy Details To Clipboard | Copies all Destination information and attributes, matching the data available when you export route data. |
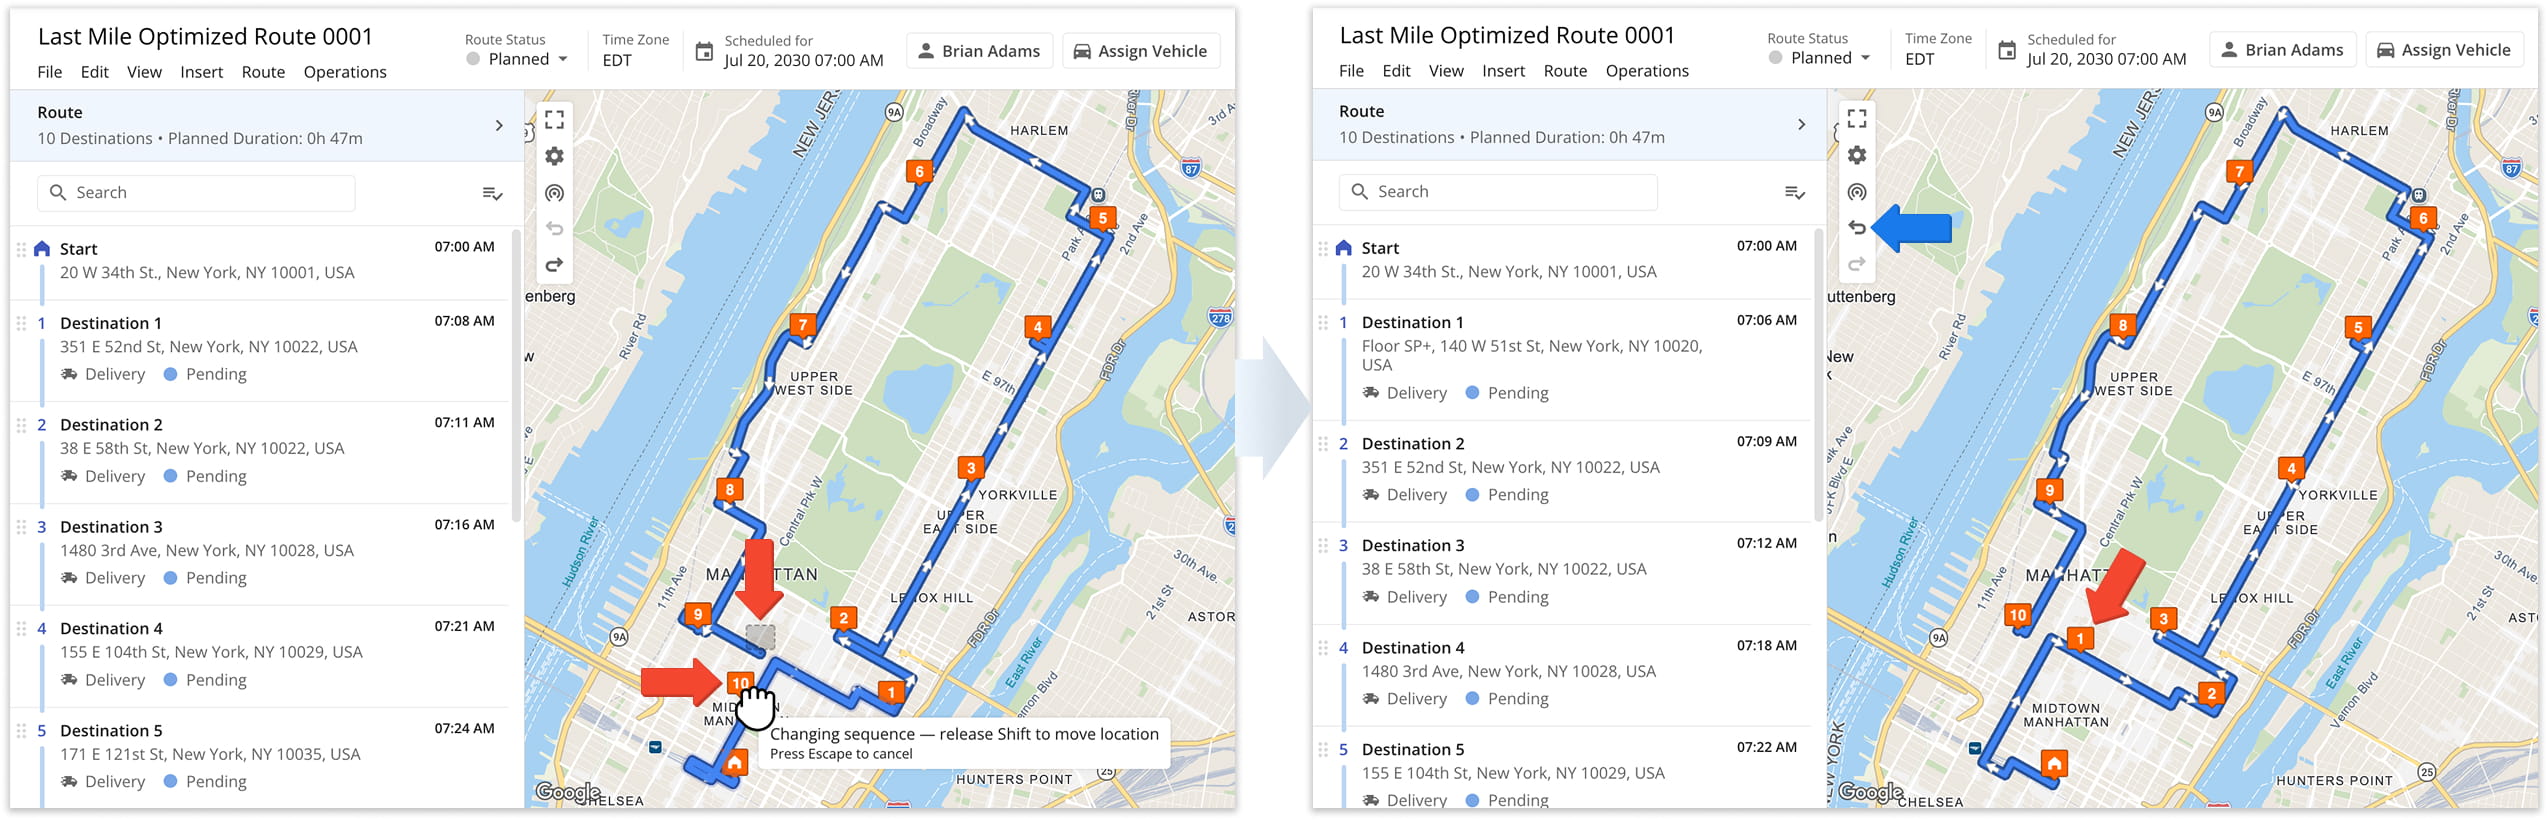
You can also re-sequence destinations directly from the Route Map. To do this, hold the Shift key and drag the destination to the position on the route where you want it to appear. Be sure to re-optimize the route afterward to ensure the most efficient directions.
If you drag and drop a destination without holding the Shift key, the system will move the destination to a different address instead of re-sequencing it. If this happens, click the Undo Icon in the Actions Menu at the upper-left of the map to reverse the change immediately.
NOTE: Undo history is cleared when the tab is closed or refreshed, so once you leave the page, the change can no longer be undone. For this reason, we recommend copying the route before editing.
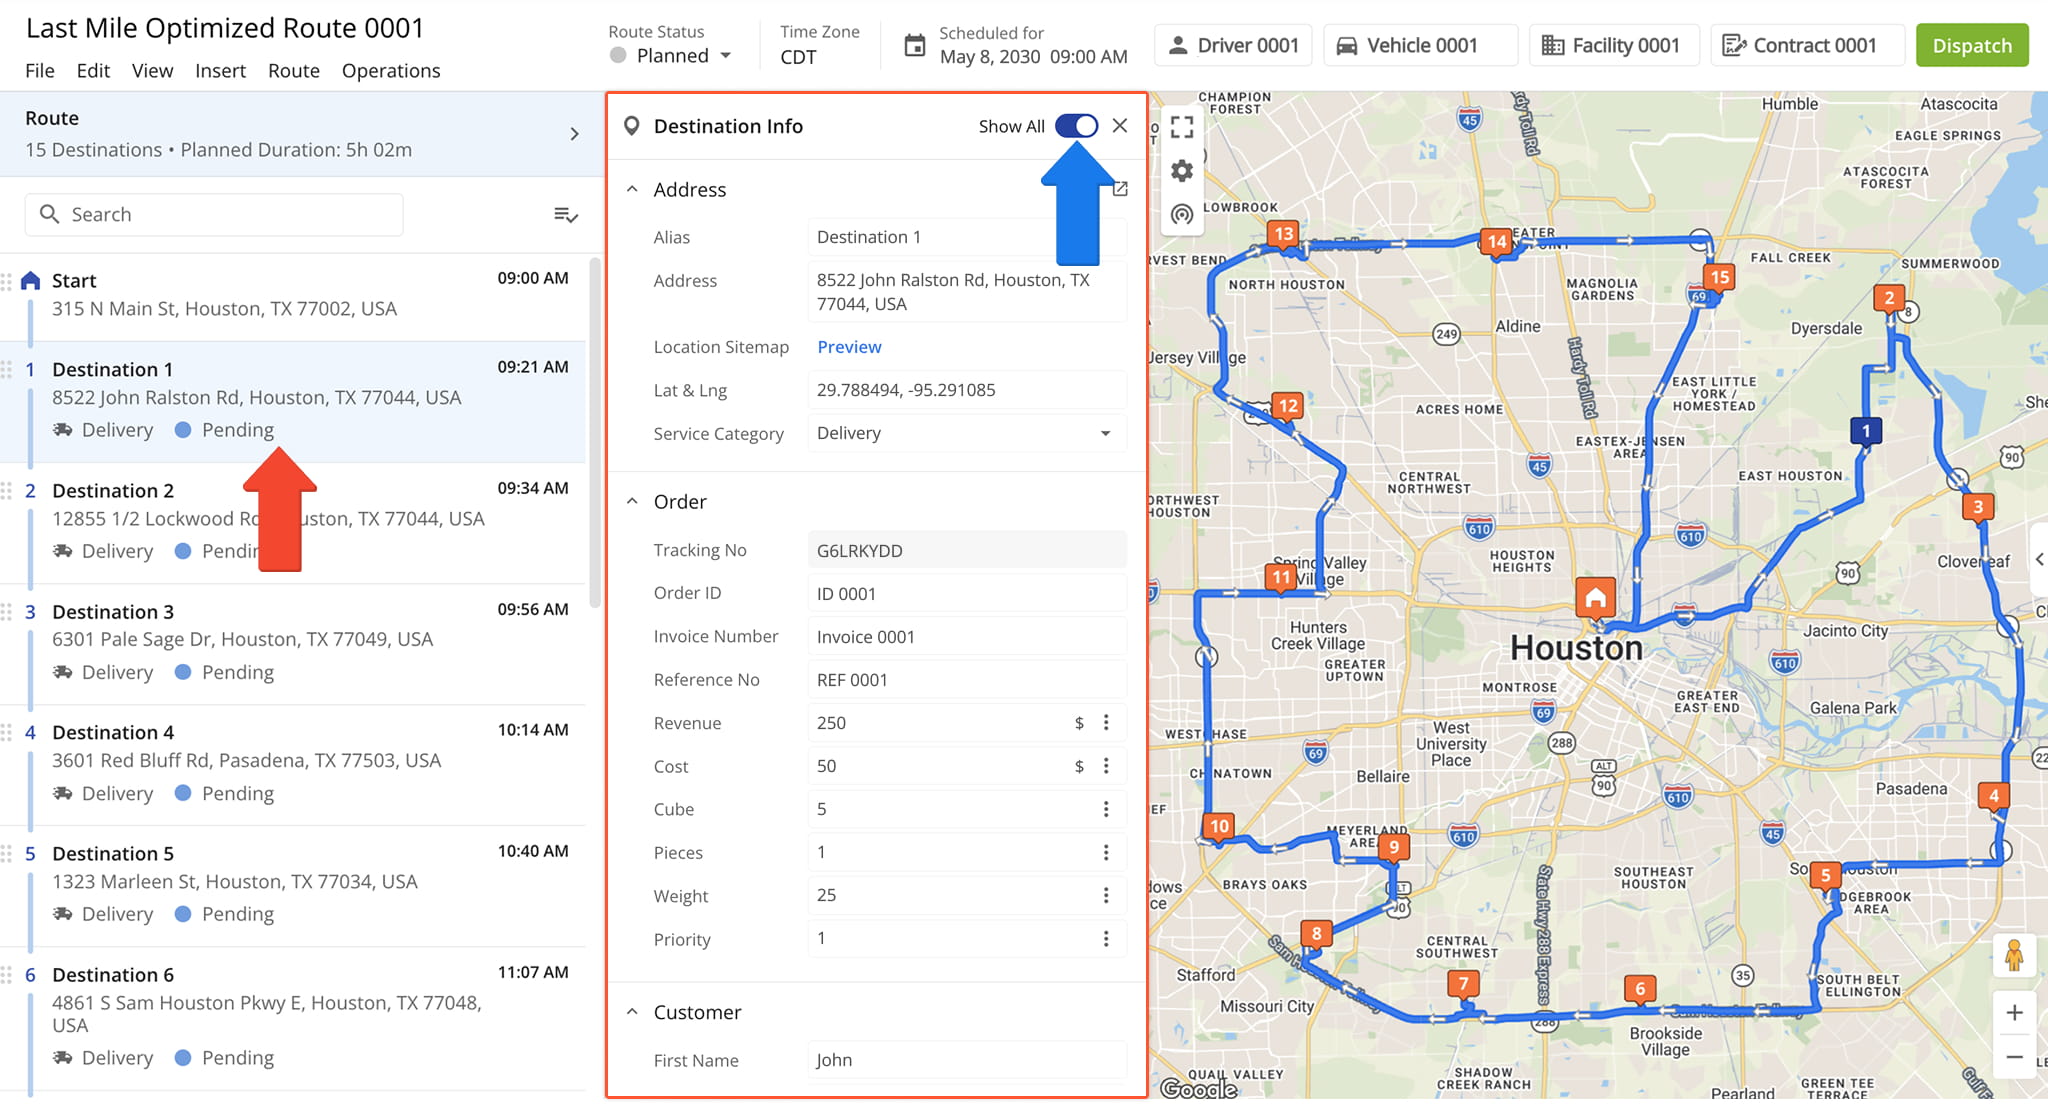
To view and edit in-depth Destination information, left-click a Destination in the list or on the map to open its “Destination Info” panel. Fields with no associated information are hidden by default. To see all available fields, toggle “Show All“.
To edit or add information for the Destination, simply click a field and input the information you want to add. Learn more about the “Destination Info” fields in the table below:
| Destination Information | Description | |
|---|---|---|
| Address | ||
| Alias | Custom name or Alias of the Destination. You can use a Destination Alias to easily find the Destination using the search function in different Route4Me interfaces. | |
| Address | Street address of the Destination. Learn more about Route4Me Geocoding and Address Verification. | |
| Location Sitemap | View the sitemap associated with the Destination’s linked Location. | |
| Lat & Lng | Rooftop latitude and longitude coordinates of the Destination address. | |
| Service Category | Action or activity required to complete the Destination visit. Available Service Category Types: Delivery, Pickup, Break, Meetup, Service, Visit, Drive By | |
| Order | ||
| Tracking No | Automatically assigned unique Order Tracking Number. Customers can use their Order Tracking Number to track the status of their Order in real-time using Route4Me’s Customer Order Tracking Portal. | |
| Order No | Custom Order Number of the Order at the Destination. | |
| Invoice No | Custom Invoice Number of the Order at the Destination. | |
| Reference No | Custom Reference Number of the Order at the Destination. | |
| Revenue | Revenue planned to be generated from completing the Order at the Destination. | |
| Order Cost | Cost of completing the Order at the Destination. | |
| Cube | Total cubic volume amount expected to be delivered at or picked up from the Destination. | |
| Pieces | Total number of units or Pieces expected to be delivered at or picked up from the Destination. | |
| Weight | Total Weight expected to be delivered at or picked up from the Destination. | |
| Priority | Visitation priority of the Destination. The highest stop priority is 1 and the lowest stop priority is 65,535. Accordingly, Destinations with higher priority are visited earlier on the route. | |
| Customer | ||
| Customer Name | Full name of the contact person or customer associated with the address or Order. NOTE: This is a read-only field and cannot be edited. | |
| First Name | First name of the contact person or customer associated with the address or Order. | |
| Last Name | Last name of the contact person or customer associated with the address or Order. | |
| Email address of the contact person or customer associated with the address or Order. | ||
| Phone | Phone number of the contact person or customer associated with the address or Order. | |
| Customer PO | Purchase order (PO) of the contact or customer associated with the address or Order. | |
| Group | Custom Address Book Group ID of the Destination address. | |
| Time Windows | ||
| Time Window | Time interval when the Destination can be visited and completed. For example, Time Windows can allign with business hours. | |
| Visit Details | ||
| Destination Status | Current status of the Destination. Available statuses: Pending, Arrived, Done | |
| Planned Visit Time | The time the Destination is planned to be visited. | |
| Service Time | Time needed to complete a Destination or Customer Order. | |
| Custom Data | ||
| Custom Data | Additional custom details and data attached to your Destinations or Orders. | |
| Notes | ||
| Add Destination Notes | Click the Plus Icon (+) to manually add a Note to the Destination directly from the Route Editor. | |
| Destination Notes | Click the Arrow Icon (>) to open the Activity Feed where you can view Destination Note updates. | |
Route Progress – Real-Time Statuses, ETAs And Progress Monitoring
When the assigned User starts the route and completes Destination visits, the route’s progress is automatically updated in the system. You can use the following tools to track route progress in the Route Editor:
- Destinations List: You can easily see which destinations are marked as “Completed“, “Arrived“, or “Pending“.
- Interactive Map: Completed Destinations are marked a different color from pending ones, making it easy to quickly view route progress.
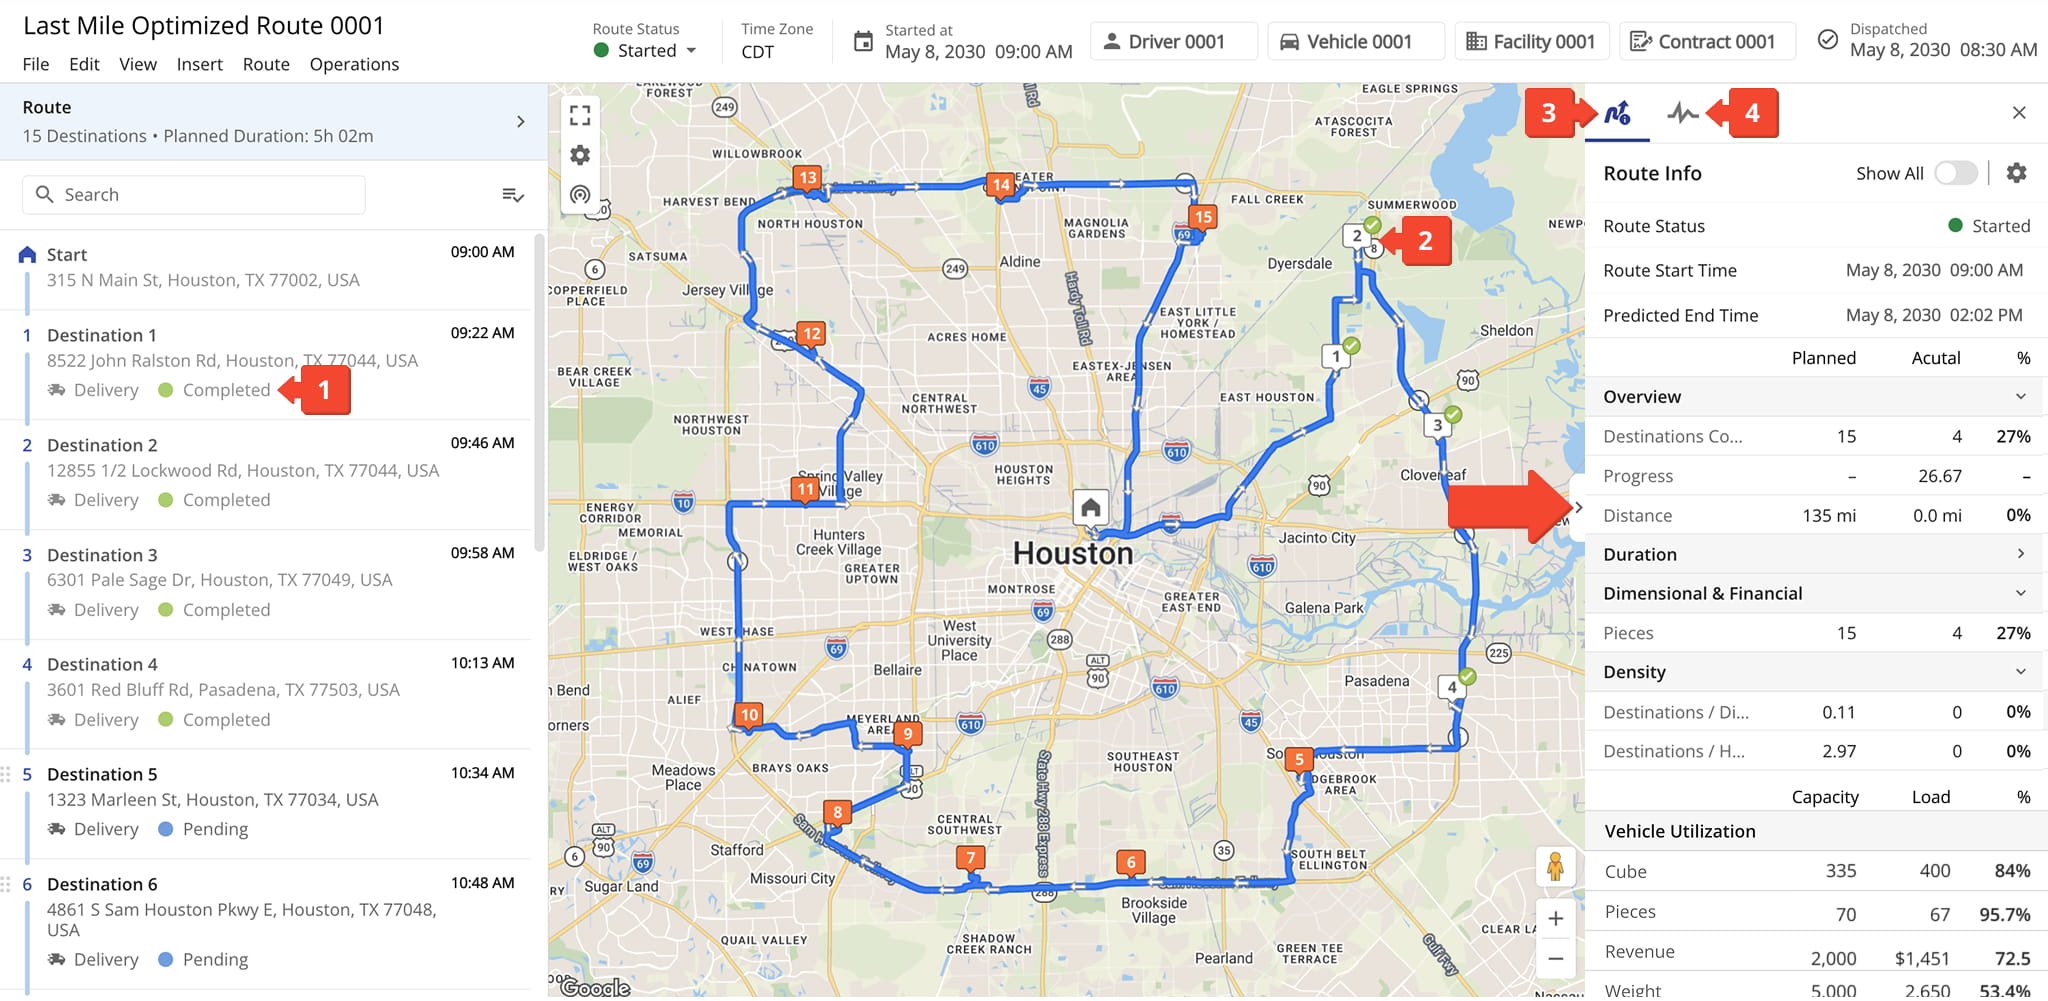
- Route Information Panel: Provides a detailed breakdown of planned and actual route data and percentages.
- Activity Feed: Provides a detailed breakdown of all route activity, including progress updates.
GPS Tracking – Real-Time Driver And Telematics Vehicle Tracking
The Route Editor offers advanced GPS tracking for drivers, vehicles, and assets. To enable tracking, click the Tracking button in the top-left corner of the map and check the “Tracking Path” and “Breadcrumbs” boxes.
Once enabled, the map will display a tracking path and Breadcrumbs (blue dots) for each location update. Hover over a Breadcrumb to view the tracking data for that point. See the table below for more on available tracking options:
![]()
| Option | Description |
|---|---|
| Tracking Path | The actual path the user or vehicle travels on the route with travel direction arrows. The Tracking Path corresponds to the tracked GPS route activity of the user or vehicle reported by the Route4Me Mobile App or installed telematics device from a Telematics Vendor. |
| Breadcrumbs | GPS tracking Breadcrumbs are shown at every location where the vehicle or field employee’s coordinates were updated by the Route4Me GPS App or telematics device on a GPS vehicle. |
| Playback | Enable the Route Playback player, which you can use to view the recorded route navigation data as a video playback with playback speed controls. Additionally, the Playback player shows the dynamic speed of the vehicle on the route. |
| Compliance | Track a driver’s Route Compliance. This option will display the tracking paths and distance for portions of the planned route that were traveled, detours and deviations, and the portions of the planned route that weren’t traveled. |
| Tracking Source | The Route4Me Mobile App uses location services to seamlessly synchronize the user’s location data on the route with your Route4Me account. The Mobile App tracking data source is shown as “Route4Me“. Alternatively, you can use a Telematics Integration with a Telematics Provider to track GPS vehicles on the route via installed telematics devices. Tracking data is synchronized with your Route4Me account according to the Vehicle Position Refresh Rate in your telematics settings, and the tracking data source is shown as the name of your Telematics Vendor. |
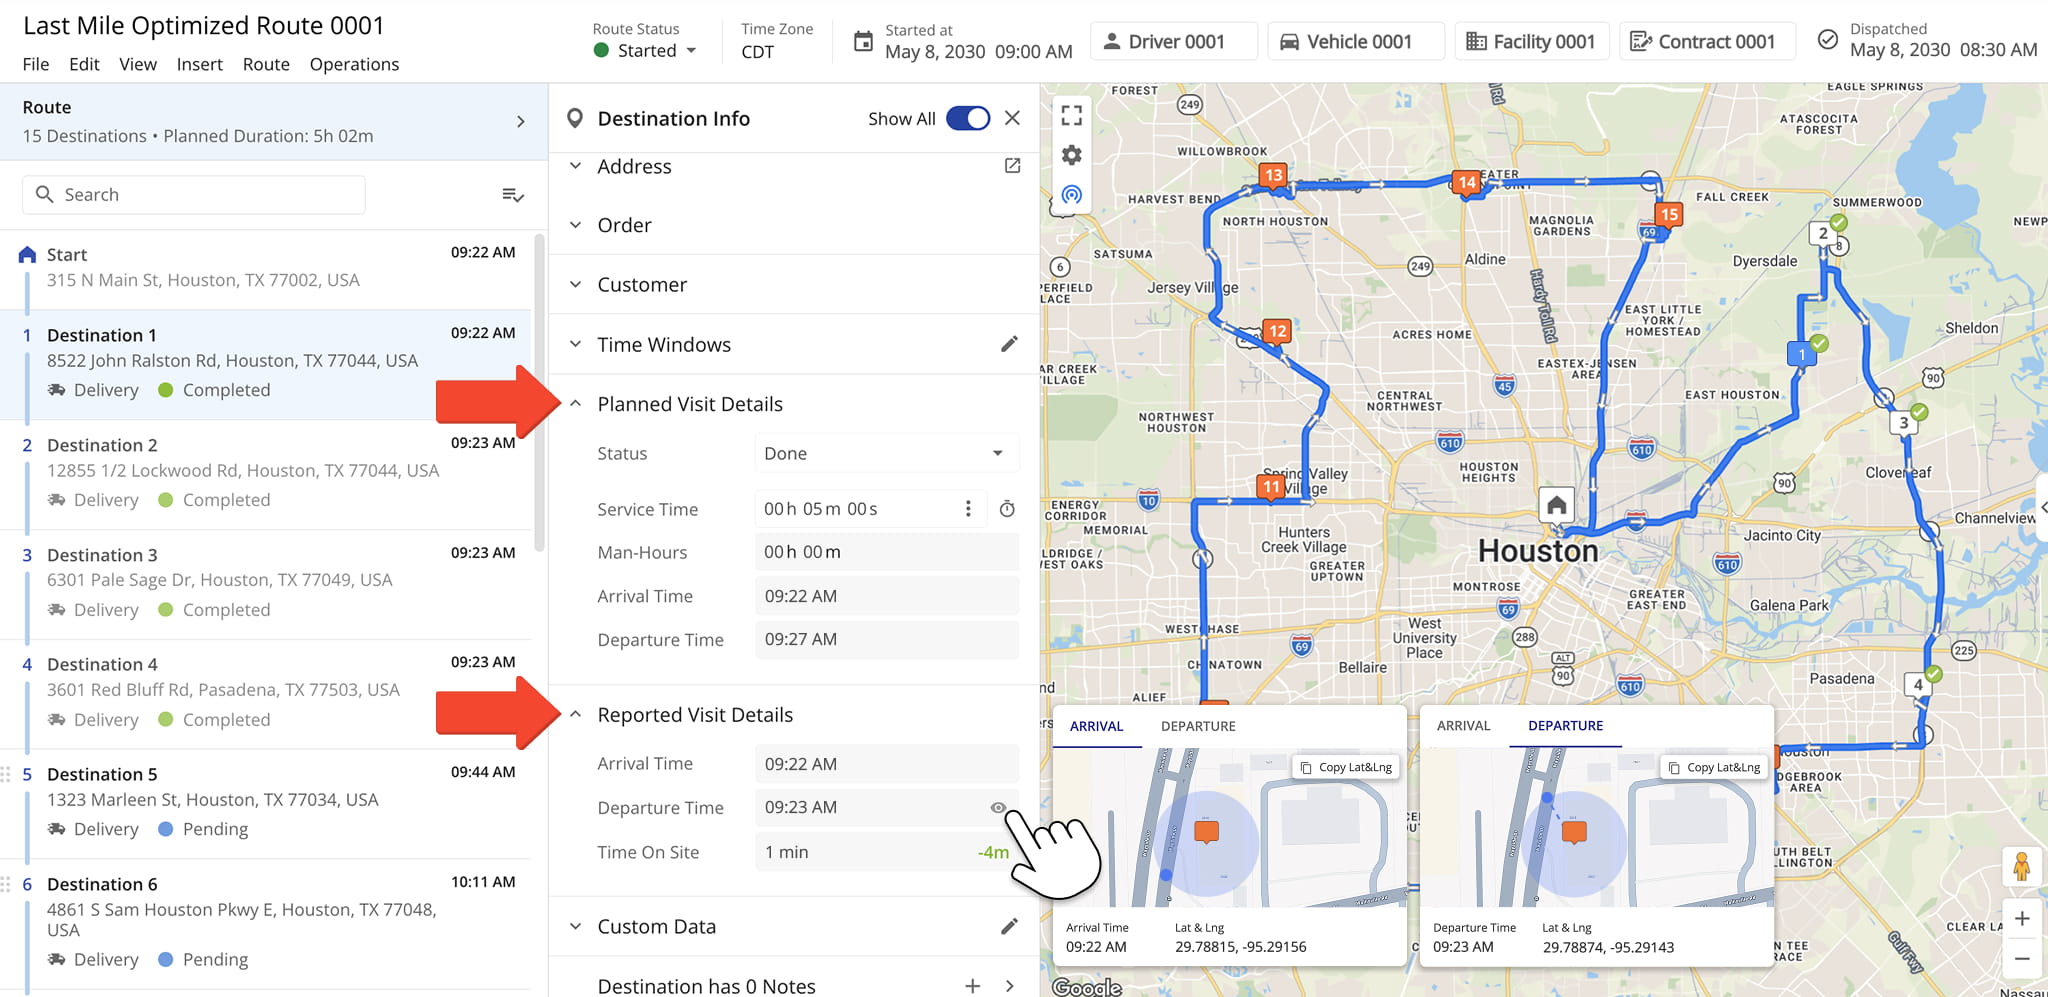
In addition to live tracking, you can view detailed visit data for each destination. Just click a Destination to open it’s “Destination Info” panel, then select the “Planned Visit Details” and “Reported Visit Details” sections.
Here, you ‘ll find both the initially planned visit and departure times and the actual automatically detected visit and departure times (based on geofence-triggered arrival and departure).
Hover over a timestamp to reveal the Eye Icon, then click it to view exact “Arrival” and “Departure” tracking data, including time and GPS coordinates.
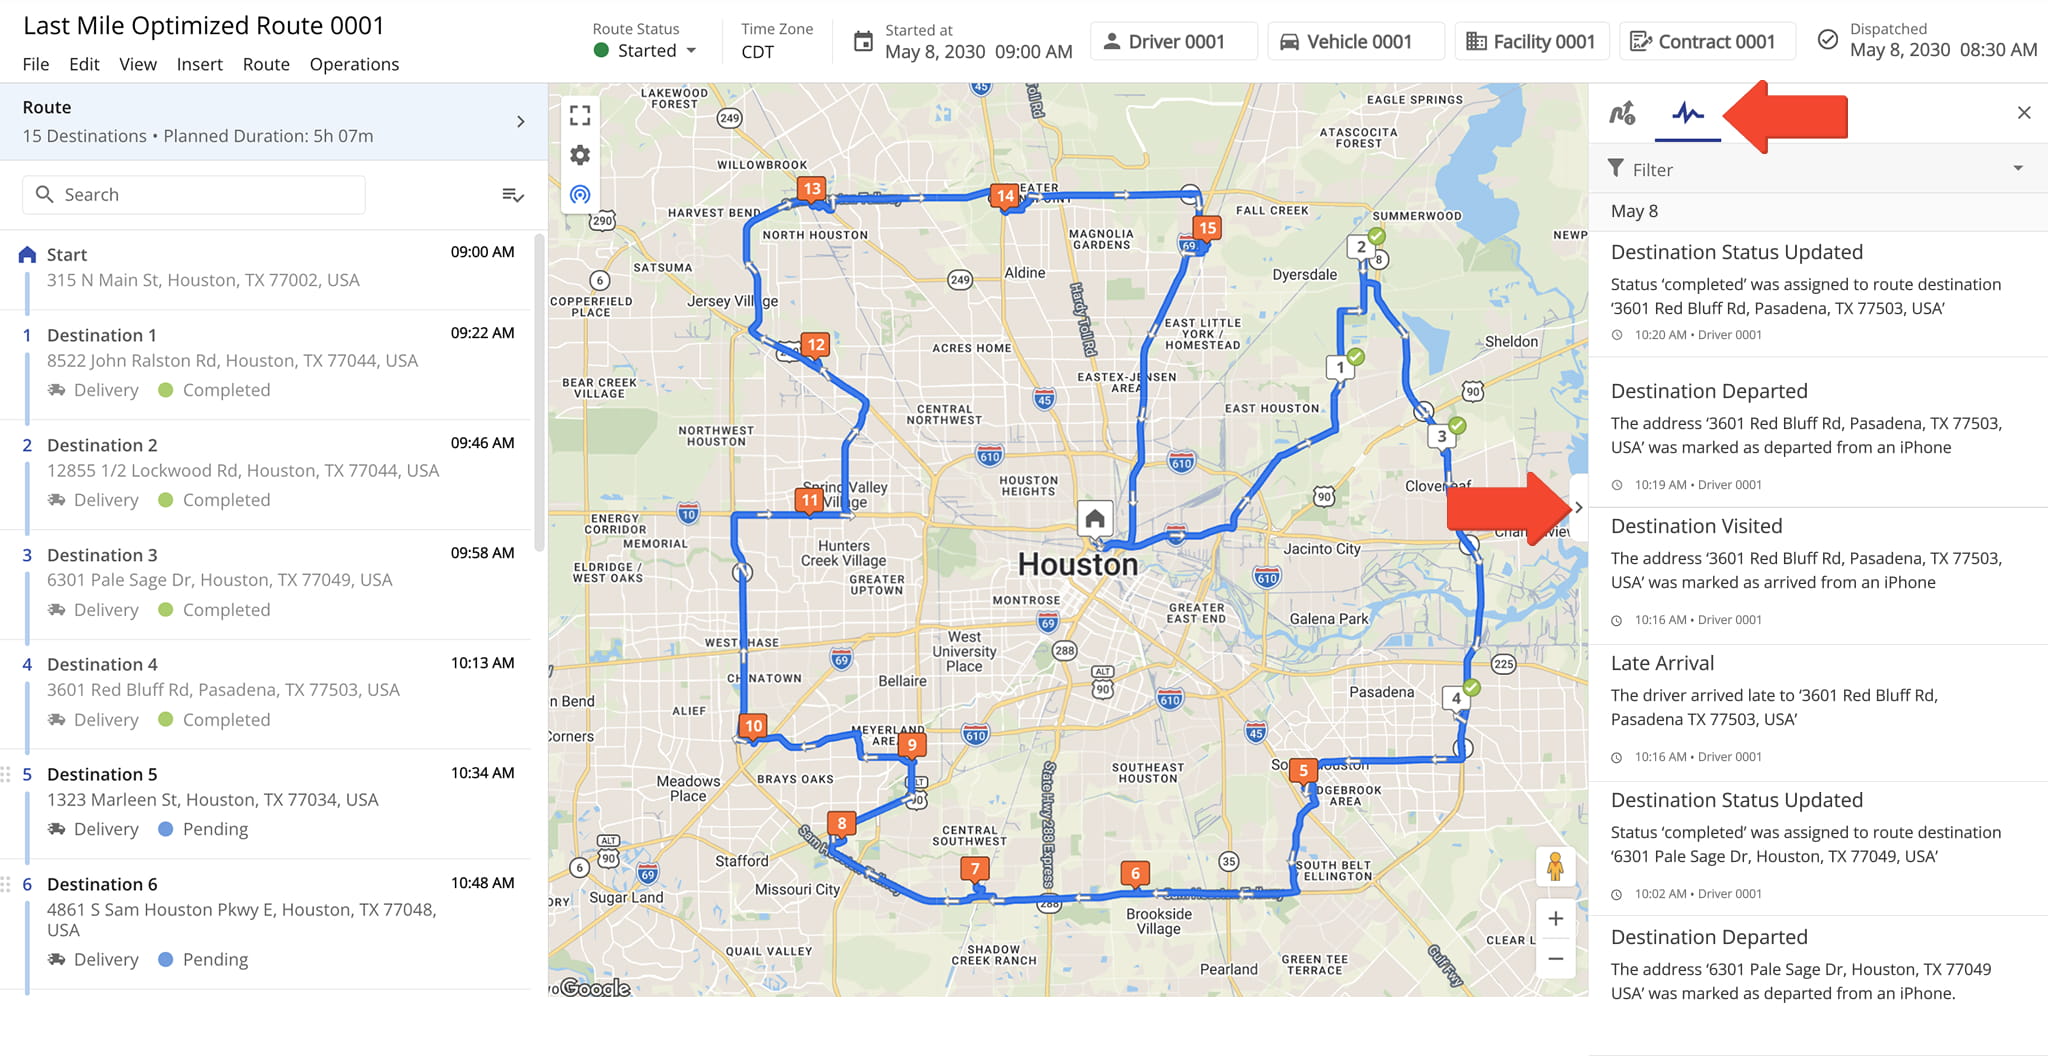
Activity Feed – Real-Time Route Events, Activities, Completed Tasks
The Route Editor Activity Feed displays a chronological log of completed activities, tasks, and events on the route. To open it, click the Divider button on the right side of the map, then click the Activity Feed Tab.
The Feed shows when the assigned driver or User arrived at and left each Destination, added notes or proof of visit, and when route updates were made from either the Mobile app or your route planner software.
Route Information Panel – Customizable Route Data Display
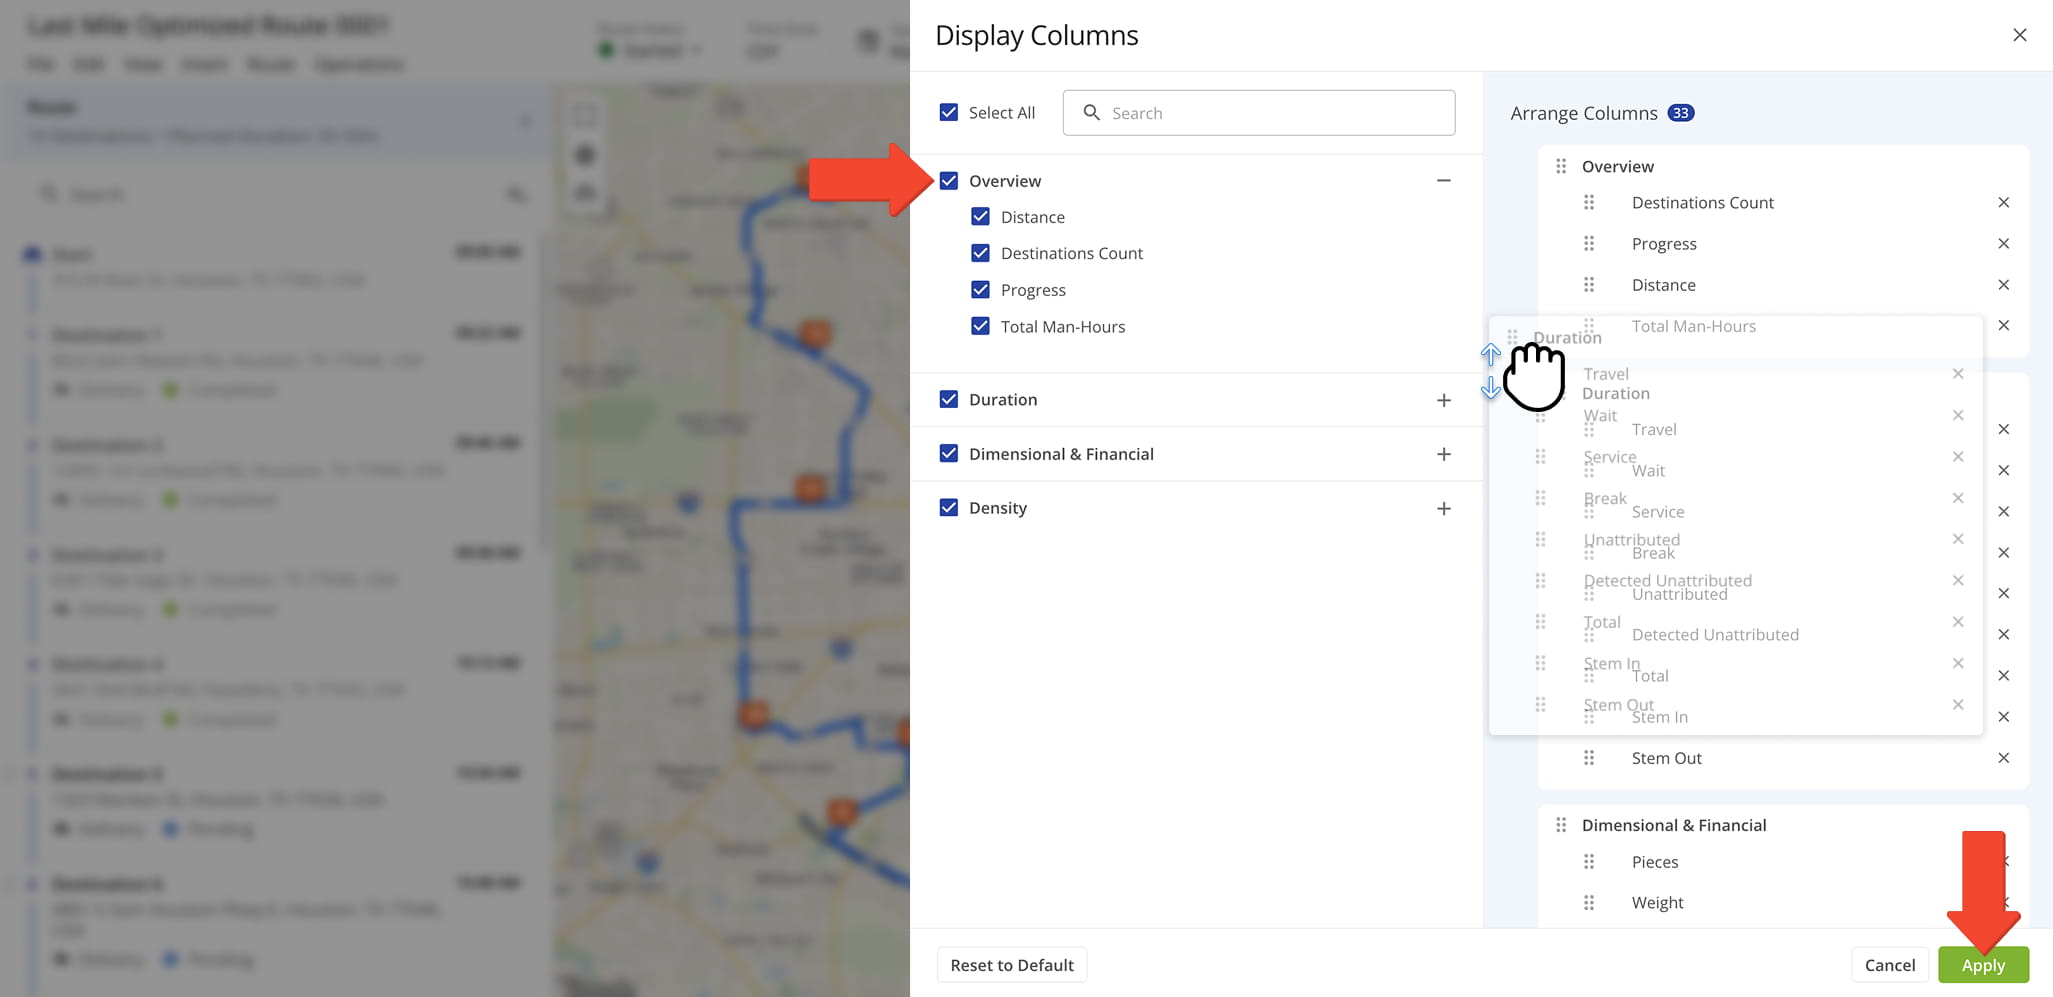
The Route Panel displays customizable, aggregated route data, helping you quickly view the metrics most relevant to your needs. To customize the Table, click the Gear Icon to open the “Display Columns” panel where you can select the data you wish to see.
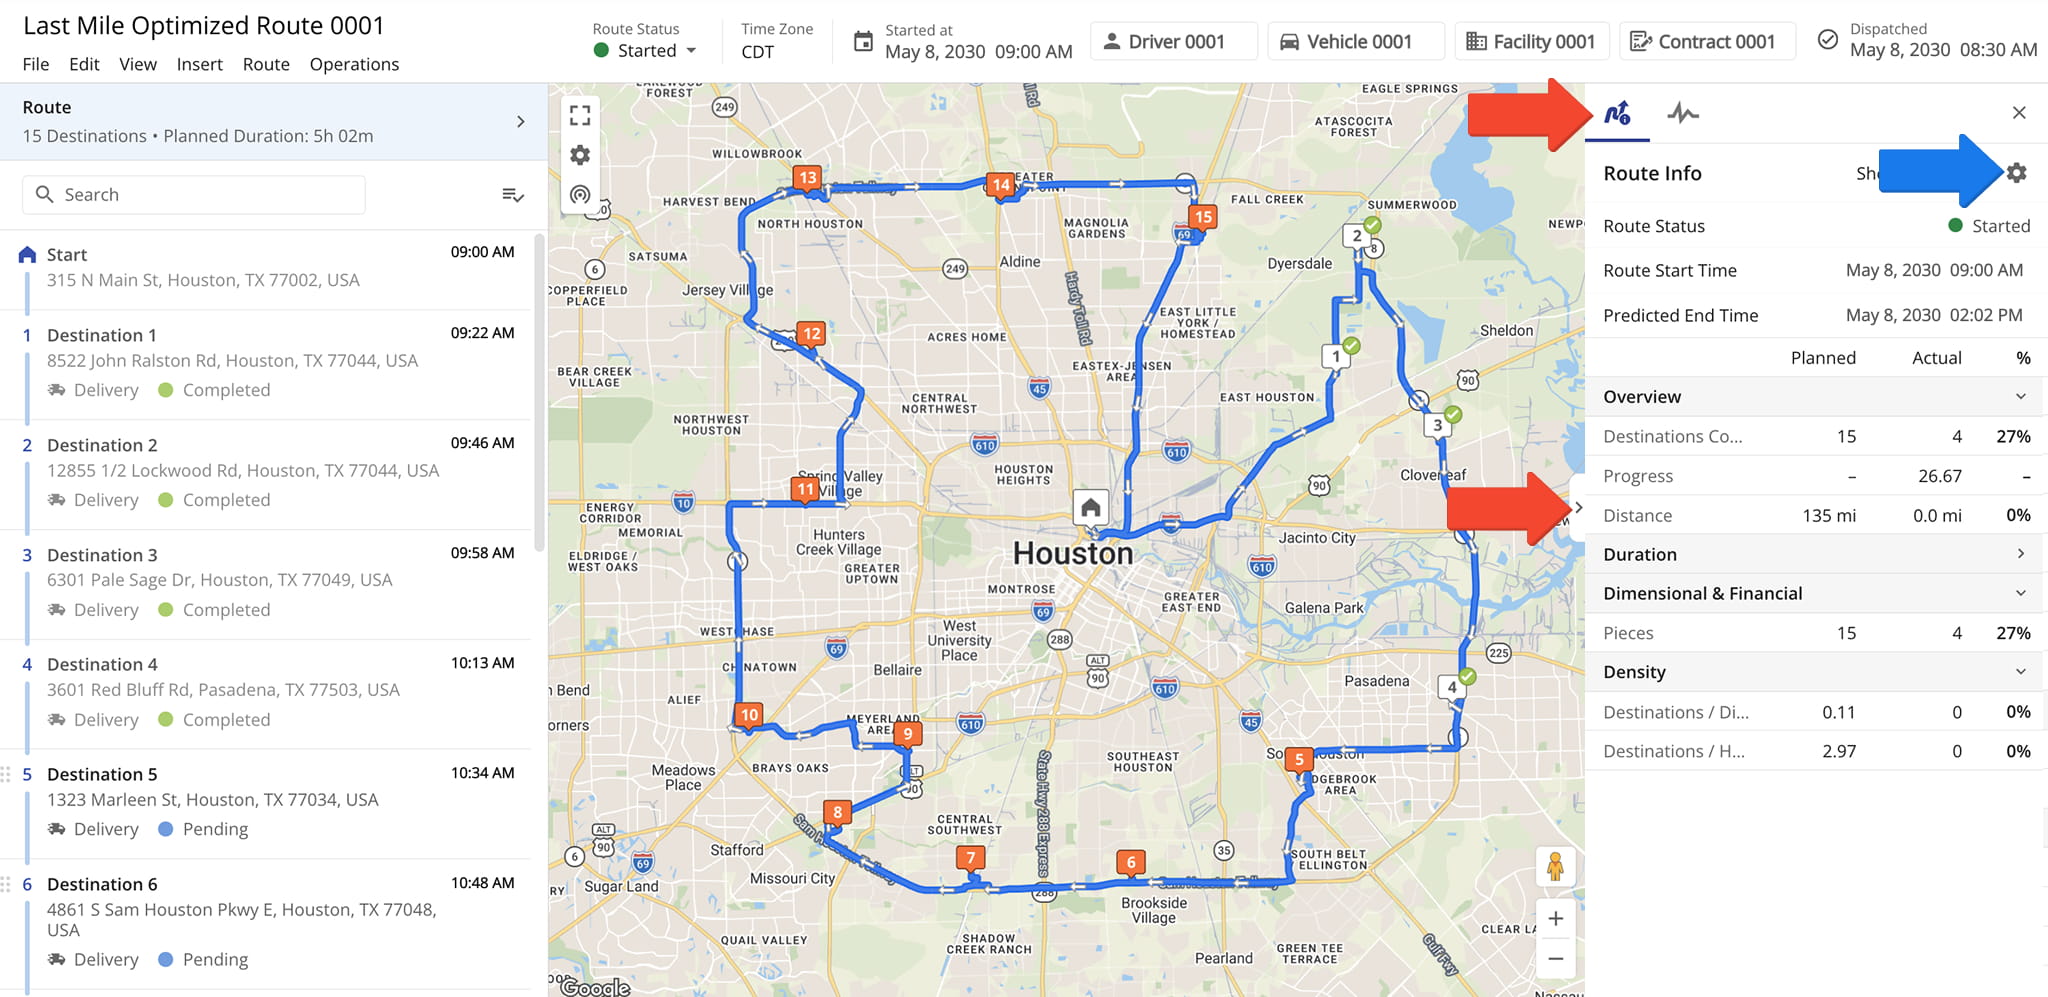
Check the boxes next to the data columns you want to display. You can reorder entire data sections by dragging them into place, and rearrange individual data columns within each section via drag-and-drop.
When done, click “Apply” to save your changes. For descriptions of each data column, refer to the table below:
| Column | Description | |
|---|---|---|
| Overview | ||
| Distance | Total planned travel distance of the route. | |
| Destinations Count | Total number of Destinations included on the route. | |
| Progress | Percentage of completed Destinations compared to the total planned Destinations on the route. | |
| Total Man-Hours | Total labor time required to complete all route Destinations, measured in person-hours. | |
| Duration | ||
| Travel | Total travel duration spent driving between Destinations. | |
| Service | Total service duration spent completing work at Destinations. | |
| Wait | Total duration spent waiting due to scheduling gaps, Time Windows, or other delays. | |
| Break | Total duration spent on planned or completed Driver Breaks. | |
| Unattributed | Total route duration that could not be associated with another tracked duration category. | |
| Detected Unattributed | Duration automatically identified as unattributed based on GPS and route activity data. | |
| Total | Total route duration, including travel, service, wait, break, and unattributed time. | |
| Stem In | Travel duration from the route origin to the first Destination on the route. | |
| Stem Out | Travel duration from the final Destination back to the route origin. | |
| Dimensional and Financial | ||
| Pieces | Total planned Pieces (units) amount assigned to the route. | |
| Weight | Total planned Weight amount assigned to the route. | |
| Cube | Total planned Cube (volume) amount assigned to the route. | |
| Revenue | Total planned revenue associated with servicing the route. | |
| Cost | Total planned operational cost associated with completing the route. | |
| Cost per Distance | Average operational cost per unit of route distance traveled. | |
| Revenue per Distance | Average revenue generated per unit of route distance traveled. | |
| Density | ||
| SPORH | Stops Per On-Road Hour – average number of Destinations completed per driving hour. | |
| TPORH | Transactions Per On-Road Hour – average number of transactions completed per driving hour. | |
| Destinations / Distance | Average number of Destinations completed per unit of route distance. | |
| Destinations / Hour | Average number of Destinations completed per hour of route duration. | |
| Transactions / Hour | Average number of transactions completed per hour of route duration. | |
| Cubic / Destinations | Average cubic volume assigned per Destination on the route. | |
| Cubic / Distance | Average cubic volume assigned per unit of route distance. | |
| Cubic / Hour | Average cubic volume serviced per hour of route duration. | |
| Pieces / Distance | Average number of Pieces assigned per unit of route distance. | |
| Pieces / Hour | Average number of Pieces serviced per hour of route duration. | |
| Weight / Distance | Average Weight assigned per unit of route distance. | |
| Weight / Destinations | Average Weight assigned per Destination on the route. | |
| Weight / Hour | Average Weight serviced per hour of route duration. | |
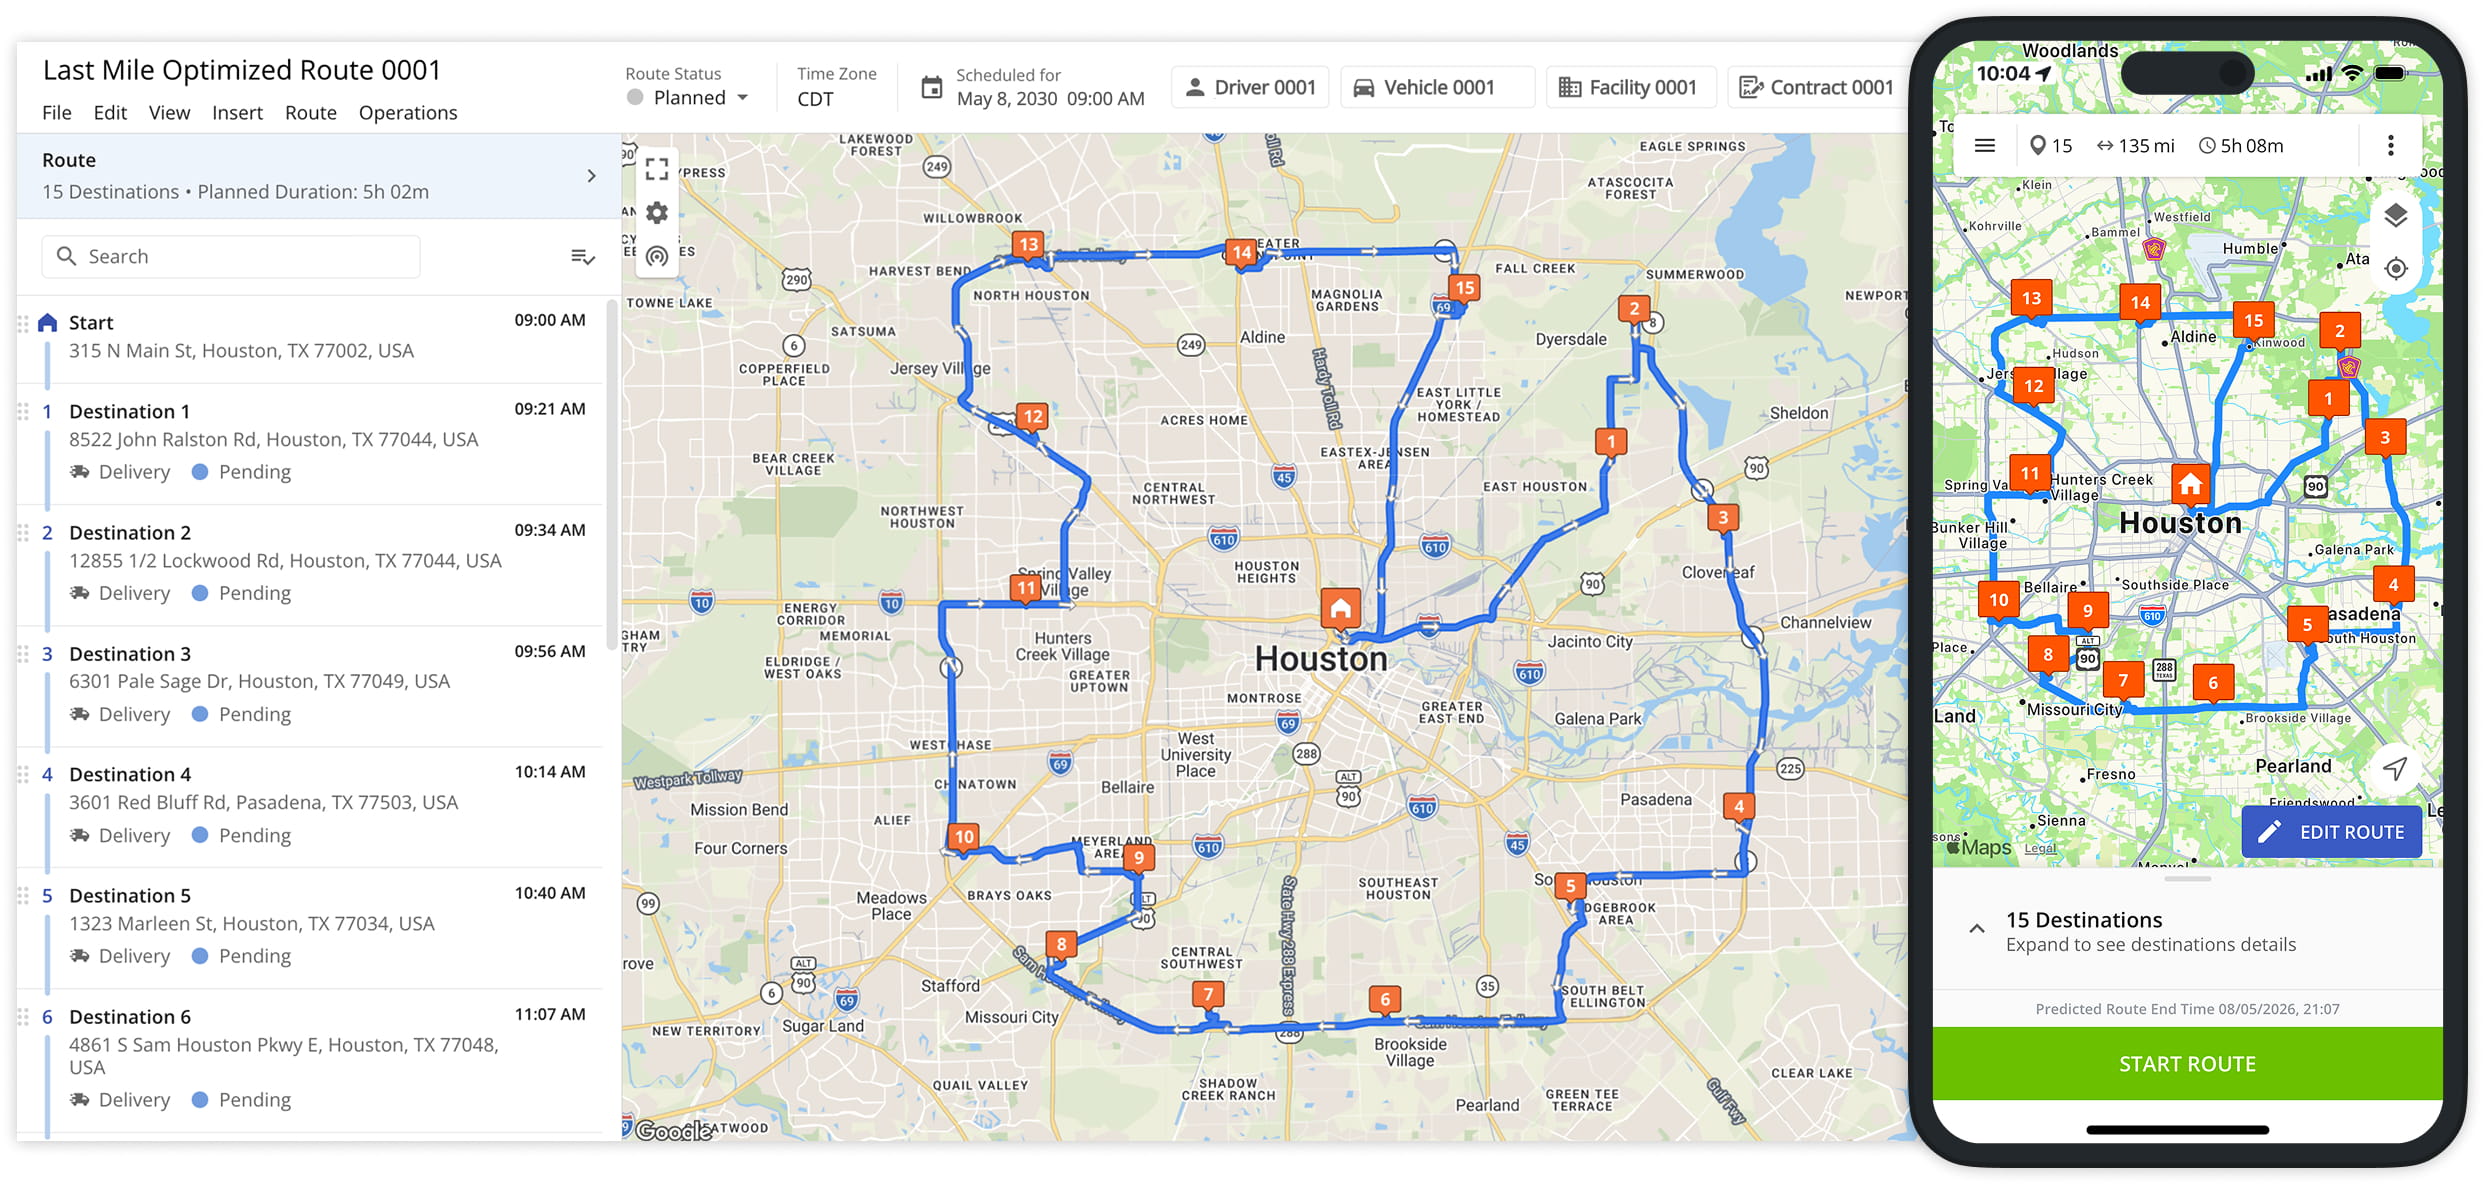
Mobile App Sync – Real-Time Route Editor Mobile App Synchronization
Route4Me delivers seamless, real-time synchronization between the Mobile Driver App and the Business Route Optimizer.
Drivers and field team members can use the iOS and Android Mobile Driver App to navigate routes, update destination statuses, attach proof of visit or delivery, and more. Any updates made in the mobile app are automatically synced with – and visible in – the Route Editor.
Likewise, managers, route planners, or dispatchers can use the Web Platform Route Editor to add or remove stops, re-sequence addresses, reschedule routes, and make other modifications. Updates are instantly reflected in the mobile apps, ensuring Drivers always have the latest route information.
Visit Route4Me's Marketplace to Check out Associated Modules:
- Operations
Custom Data Add-On
- Operations
Advanced Team Management Add-On
- Route Optimization
Time Windows
About author: Kristian Andreev
Kristian is a Technical Writer at Route4Me. With over a decade of experience in writing and localization, he's an expert at communicating complex technical data in a clear, concise, and user-friendly way. Passionate about bridging the gap between engineers and users, he specializes in creating documentation to streamline onboarding, enhance product usability, and support global teams on the path to success.