Optimization Snapshot – Customizable Optimization Data And Analytics Overview
Route4Me’s Optimization Snapshot is an easy-to-use analytics tool that consolidates key metrics and insights from your Optimizations in one place. It gives you quick access to detailed route analytics, destination data, proof of visit information, and other critical details. With each Optimization Snapshot, you can track route performance, review essential data more efficiently, and make informed decisions that boost operational accuracy and customer satisfaction. Use this guide to get started.
NOTE: Optimization Snapshots are currently available only by request. To enable this feature, contact Customer Support.
Table of Contents
Access Optimization Snapshots – View Optimization Data And Analytics
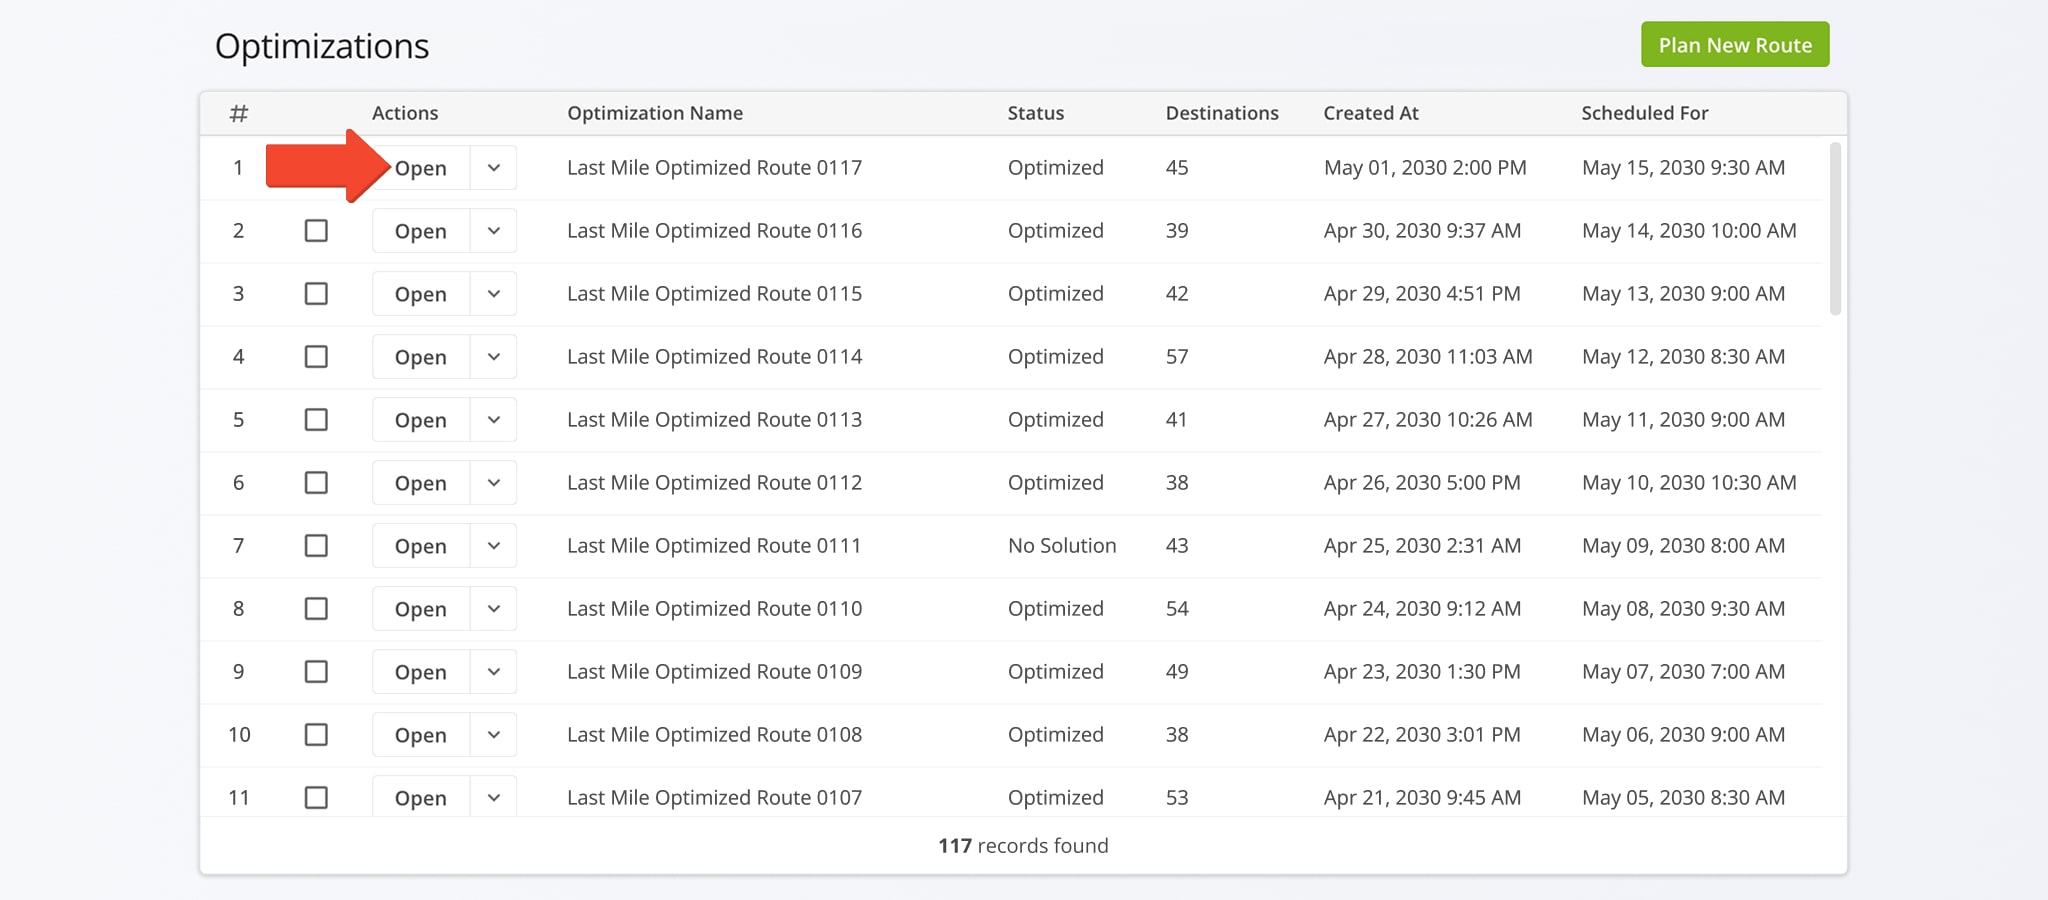
To open the Optimization Snapshot for any optimization, select “Dynamic Routing” > “Optimizations” from the Navigation Menu. Then, from the Optimizations Page, click “Open” next to the desired optimization.
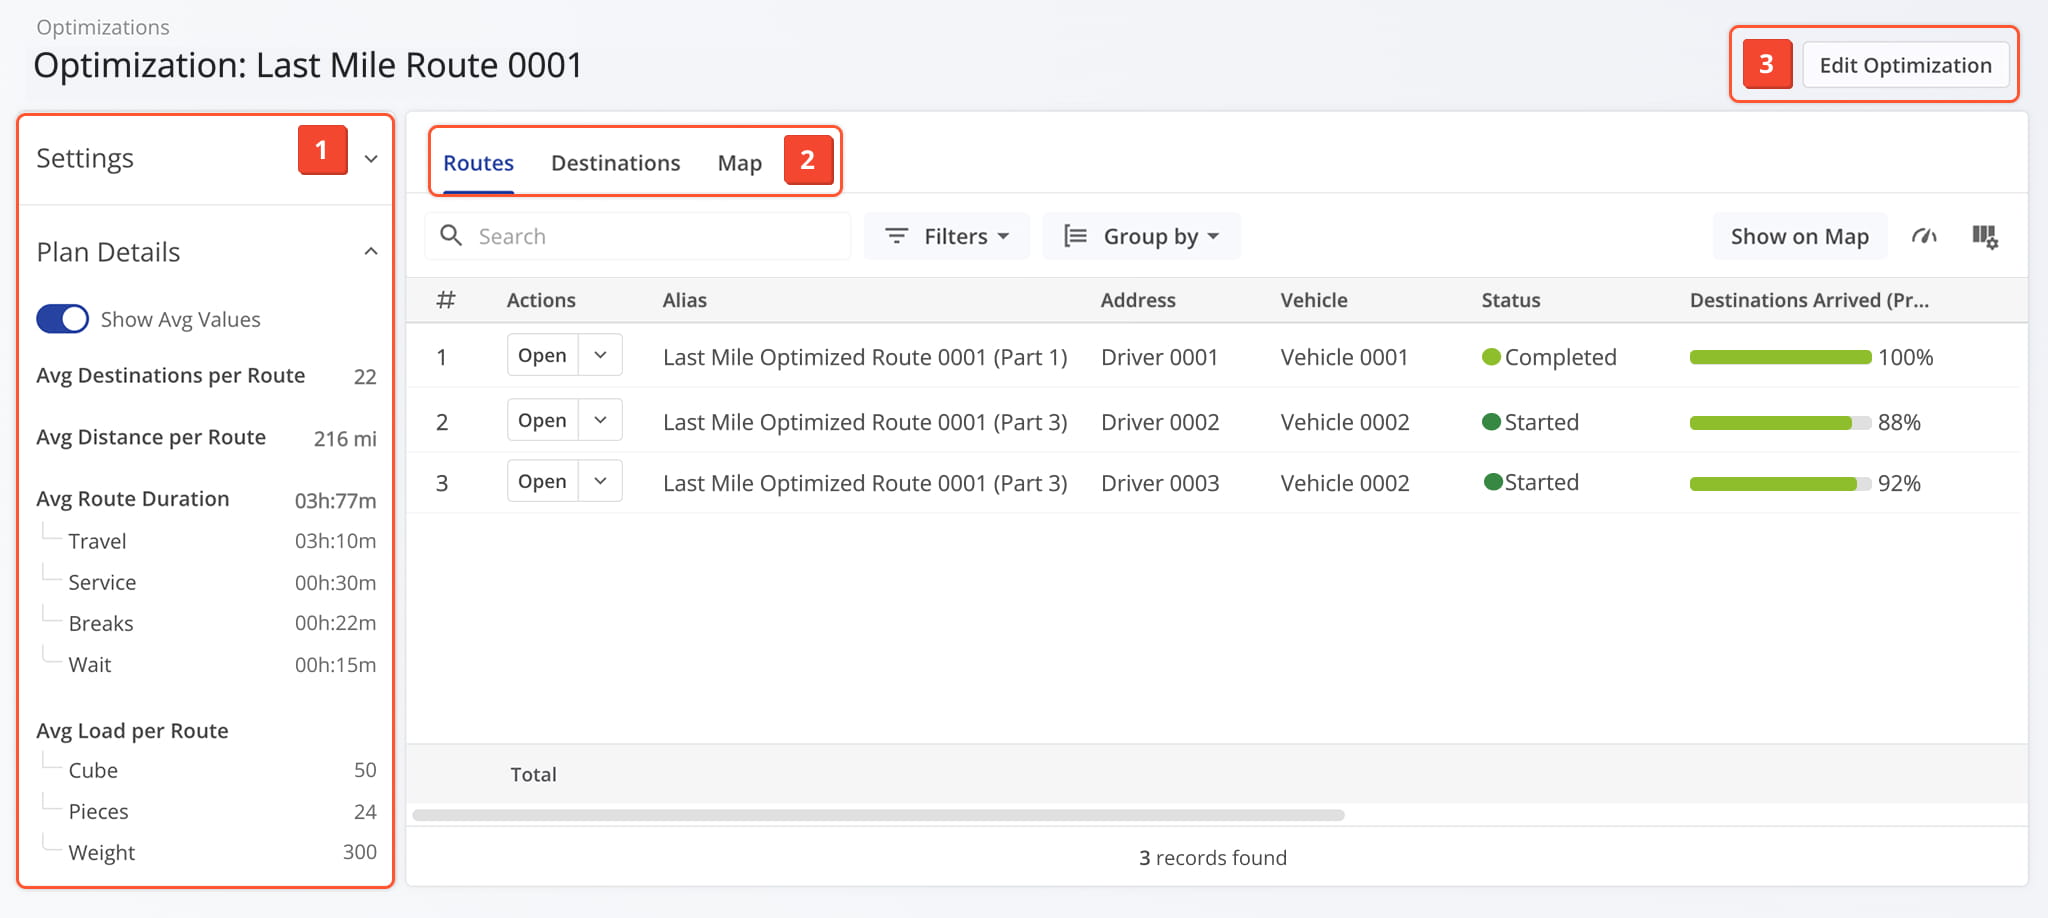
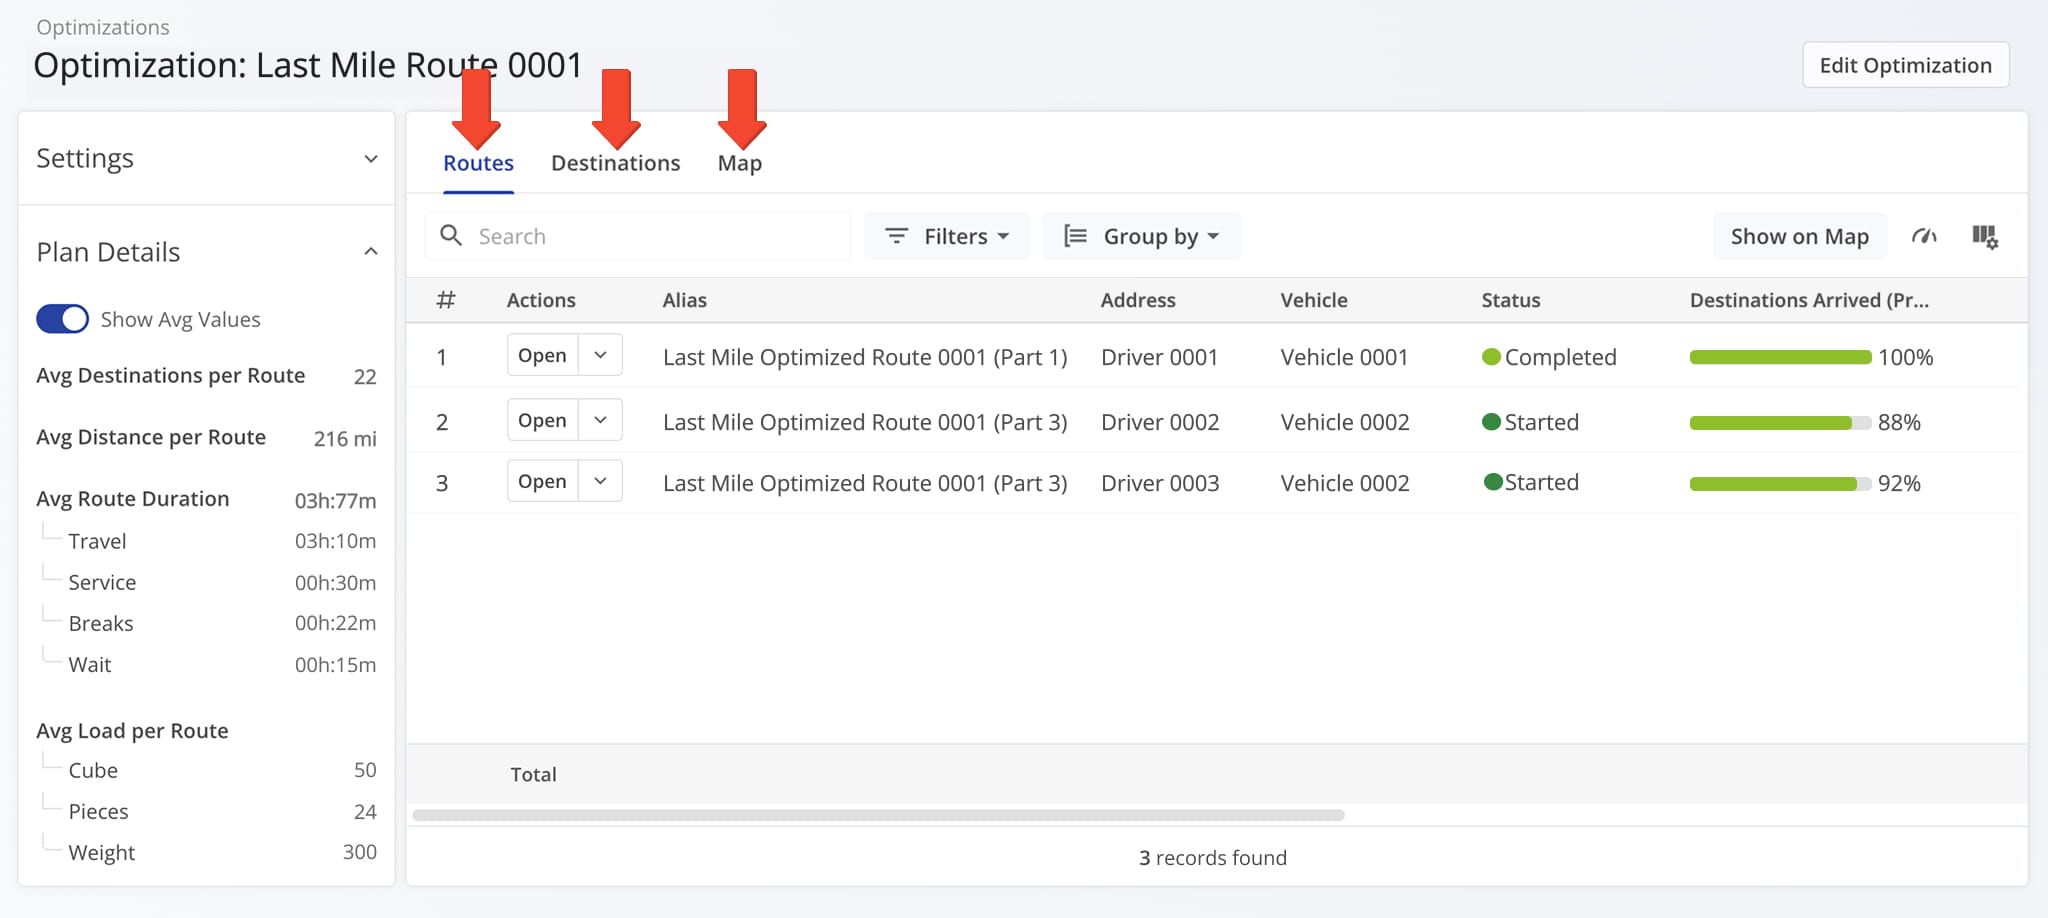
Once the Snapshot is opened, you’ll see a detailed interface designed to help you review and manage all Optimization data:
- Summary Panel: Overview of key information about the Optimization including its Settings and Plan Details.
- Optimization Data Tabs: Switch between tabs to explore Optimization-related data, which you can filter and customize as needed.
- Edit Controls: Click the “Edit Optimization” button in the top-right corner to modify Optimization details.
Optimization Profile Overview – Location, Details, Performance Metrics
Review Optimization Summary – Detailed Snapshot Information Panel
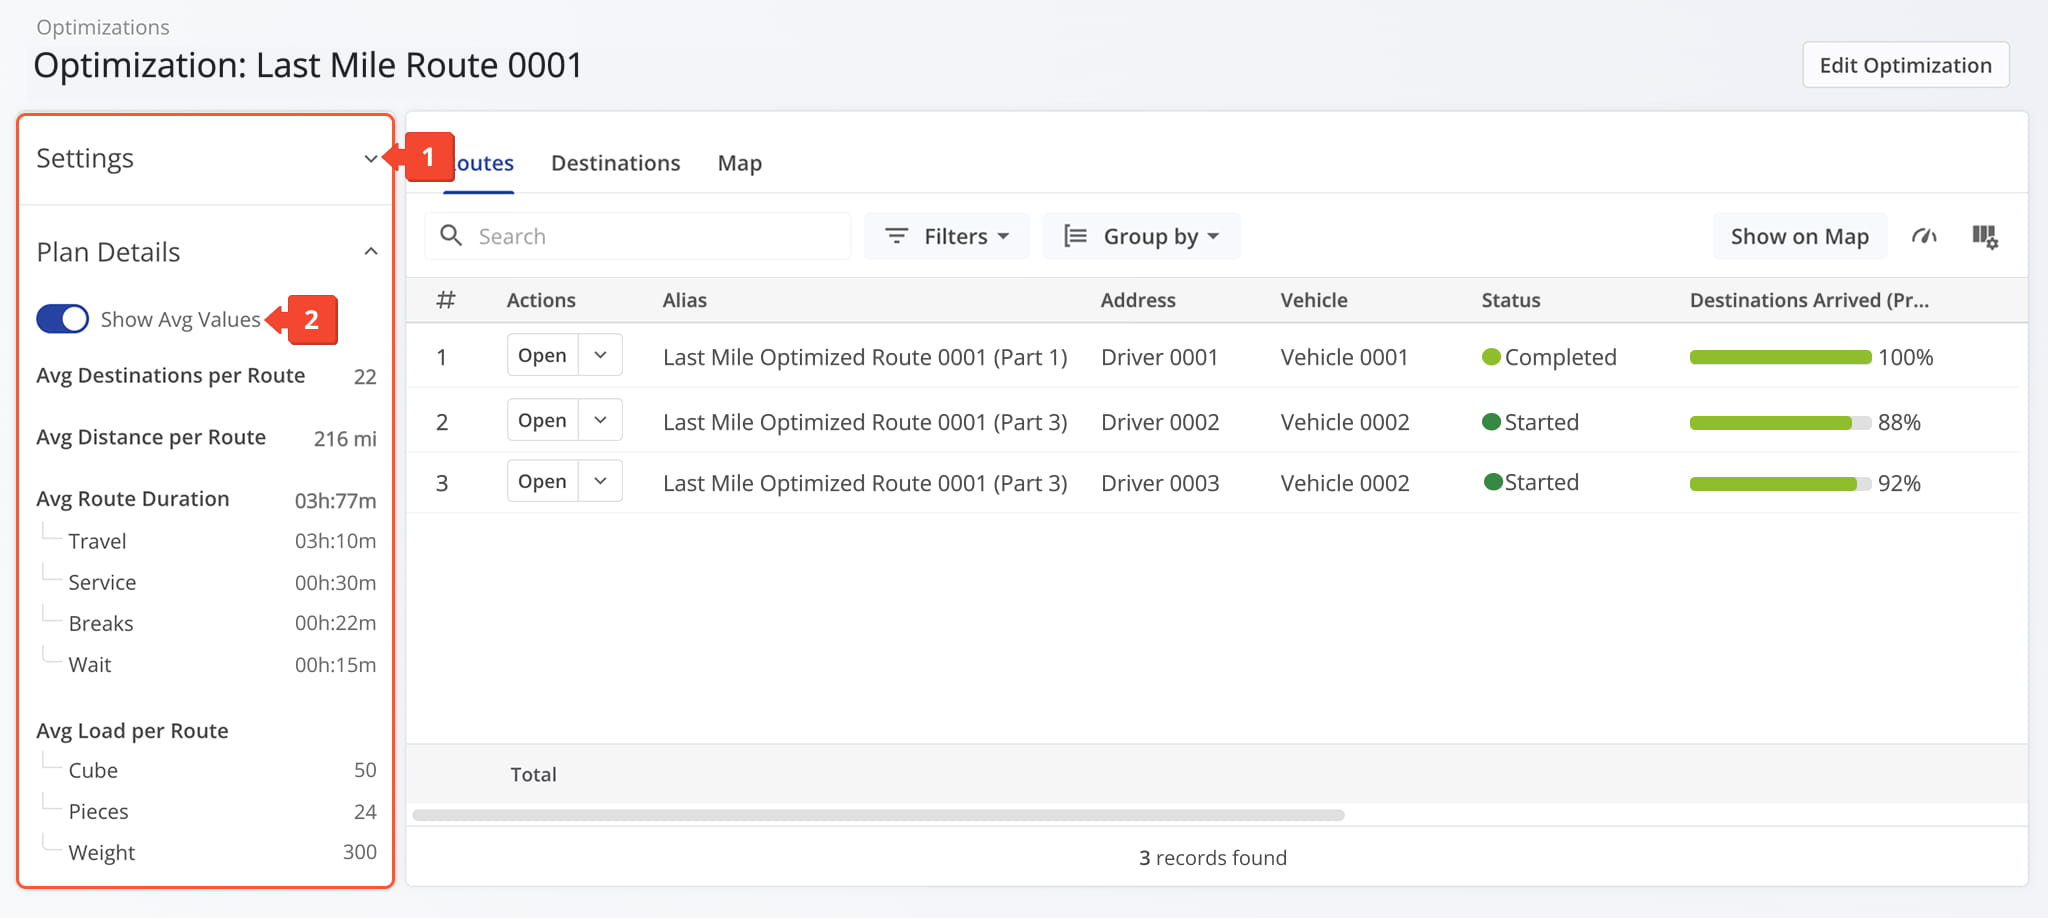
The Optimization Summary Panel displays key metrics, including scheduling settings, route limits, totals, and performance data across the entire plan. From this panel you can:
- Click the Up/Down Arrow next to “Settings” or “Plan Details” to expand each section and review associated data.
- In the “Plan Details” section, toggle “Show Avg Values” to view average metrics per route in addition to total optimization values.
See the table below for a complete list of metrics available in the Optimization Information Panel.
| Metric | Description | |
|---|---|---|
| Settings | ||
| Start Date | Scheduled start date of routes associated with the optimization. | |
| Start Time | Scheduled start time of routes associated with the optimization. | |
| Max # of Routes | Total allowed number of routes for the optimization. | |
| Max Duration | Maximum allowed duration of routes for the optimization. | |
| Plan Details | ||
| Show Avg Values | Enable this toggle to show average values for in the Plan Details section of the Summary Panel. | |
| Destinations | The total number of destinations in the optimization. Also provides the average number of destinations assigned to each route. | |
| Total Planned Distance | The total distance associated with the optimization across all routes. Also provides the average distance per route within the optimization. | |
| Total Planned Duration | The total planned time for all routes in the optimization, broken down into Travel Time, Service Time, Break Time, and Wait Time. Also provides the average planned time per route in the optimization, along with the same breakdown. | |
| Total Planned Load | The total load associated with the optimization, broken down into Cube, Pieces, and Weight. Also provides the average load per route within the optimization. | |
| Total Revenue | The total revenue generated across all routes in the optimization. Also provides the total revenue generated for each individual route, each destination, each mile traveled, and each hour of operation. | |
Route Performance Metrics Panel – Vehicle Route And Time Performance Overview
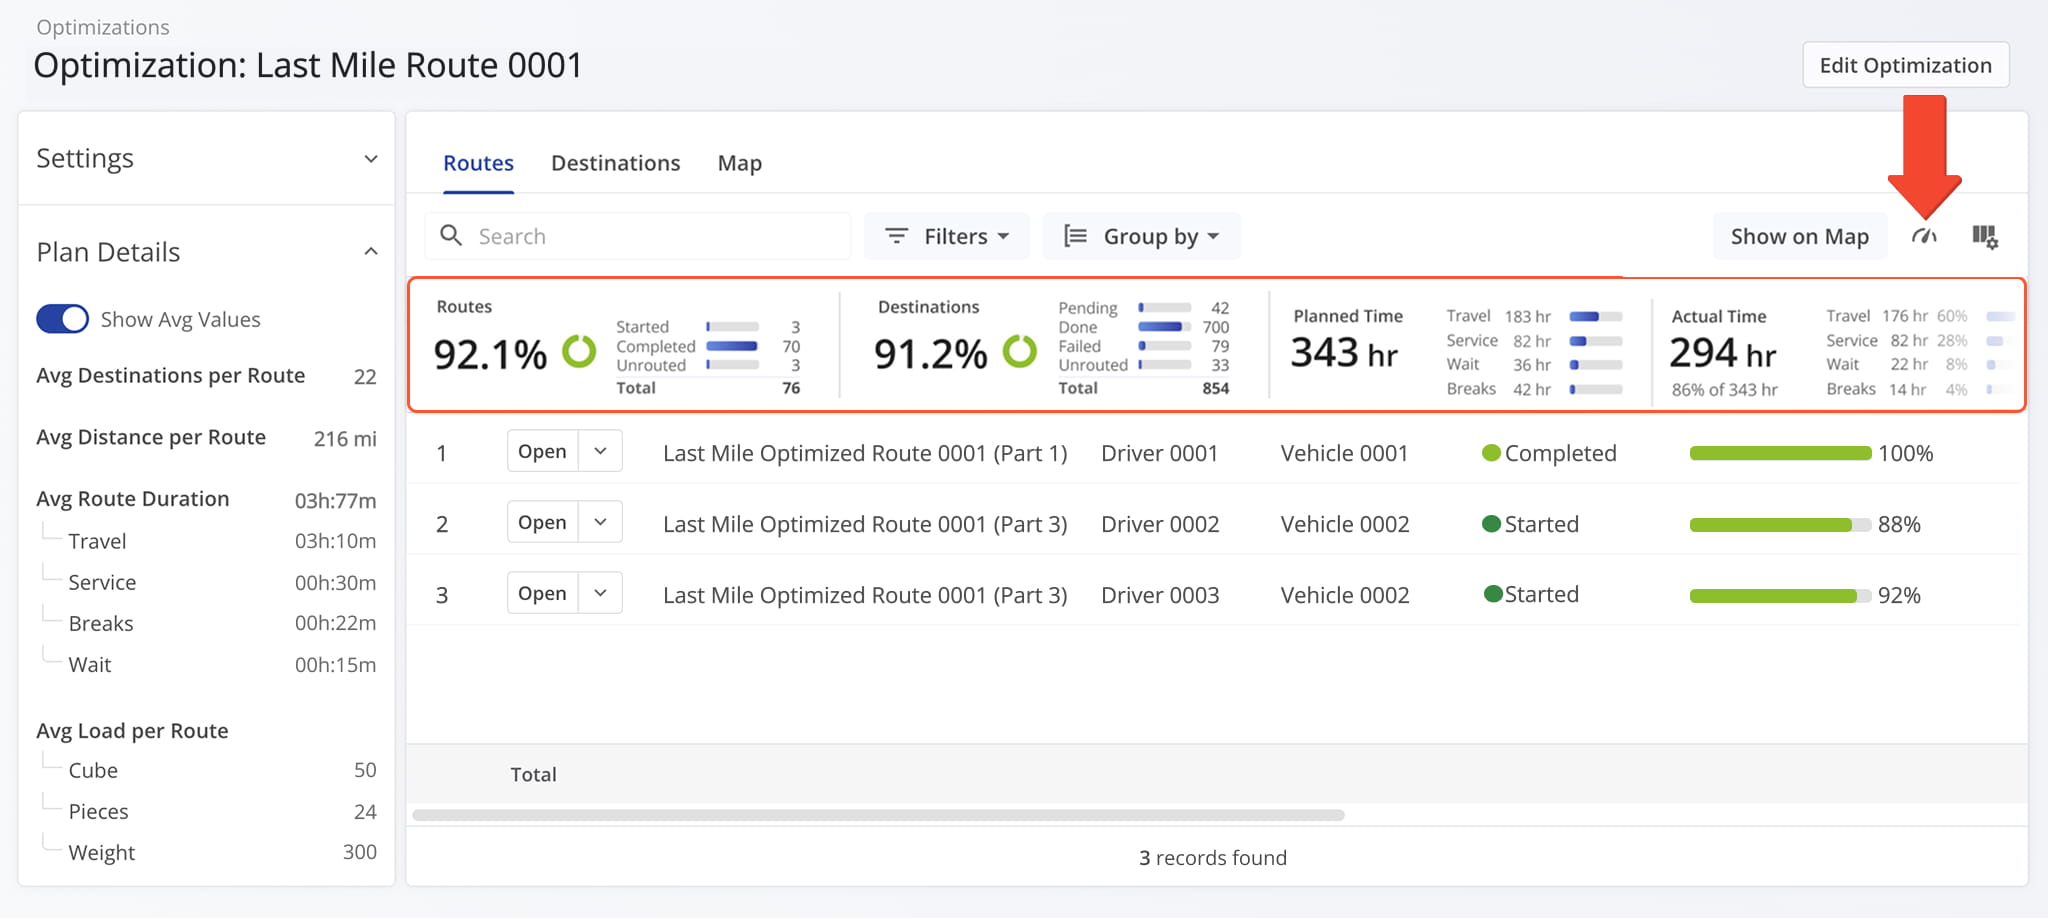
Click the Metrics Icon in the upper-right corner to open the Performance Metrics panel, where you can monitor progress, track efficiency, and evaluate operational performance across routes.
This panel, available from the Routes tab, provides a summary of planned routes and destinations, along with a side-by-side breakdown of planned and actual time for travel, service, wait, and breaks.
Optimization Snapshot Categories – Optimization Analytics Data Tabs
The Optimization Snapshot is organized into tabs, each corresponding to a specific category of data described below.
Routes Tab – Route Information And Insights
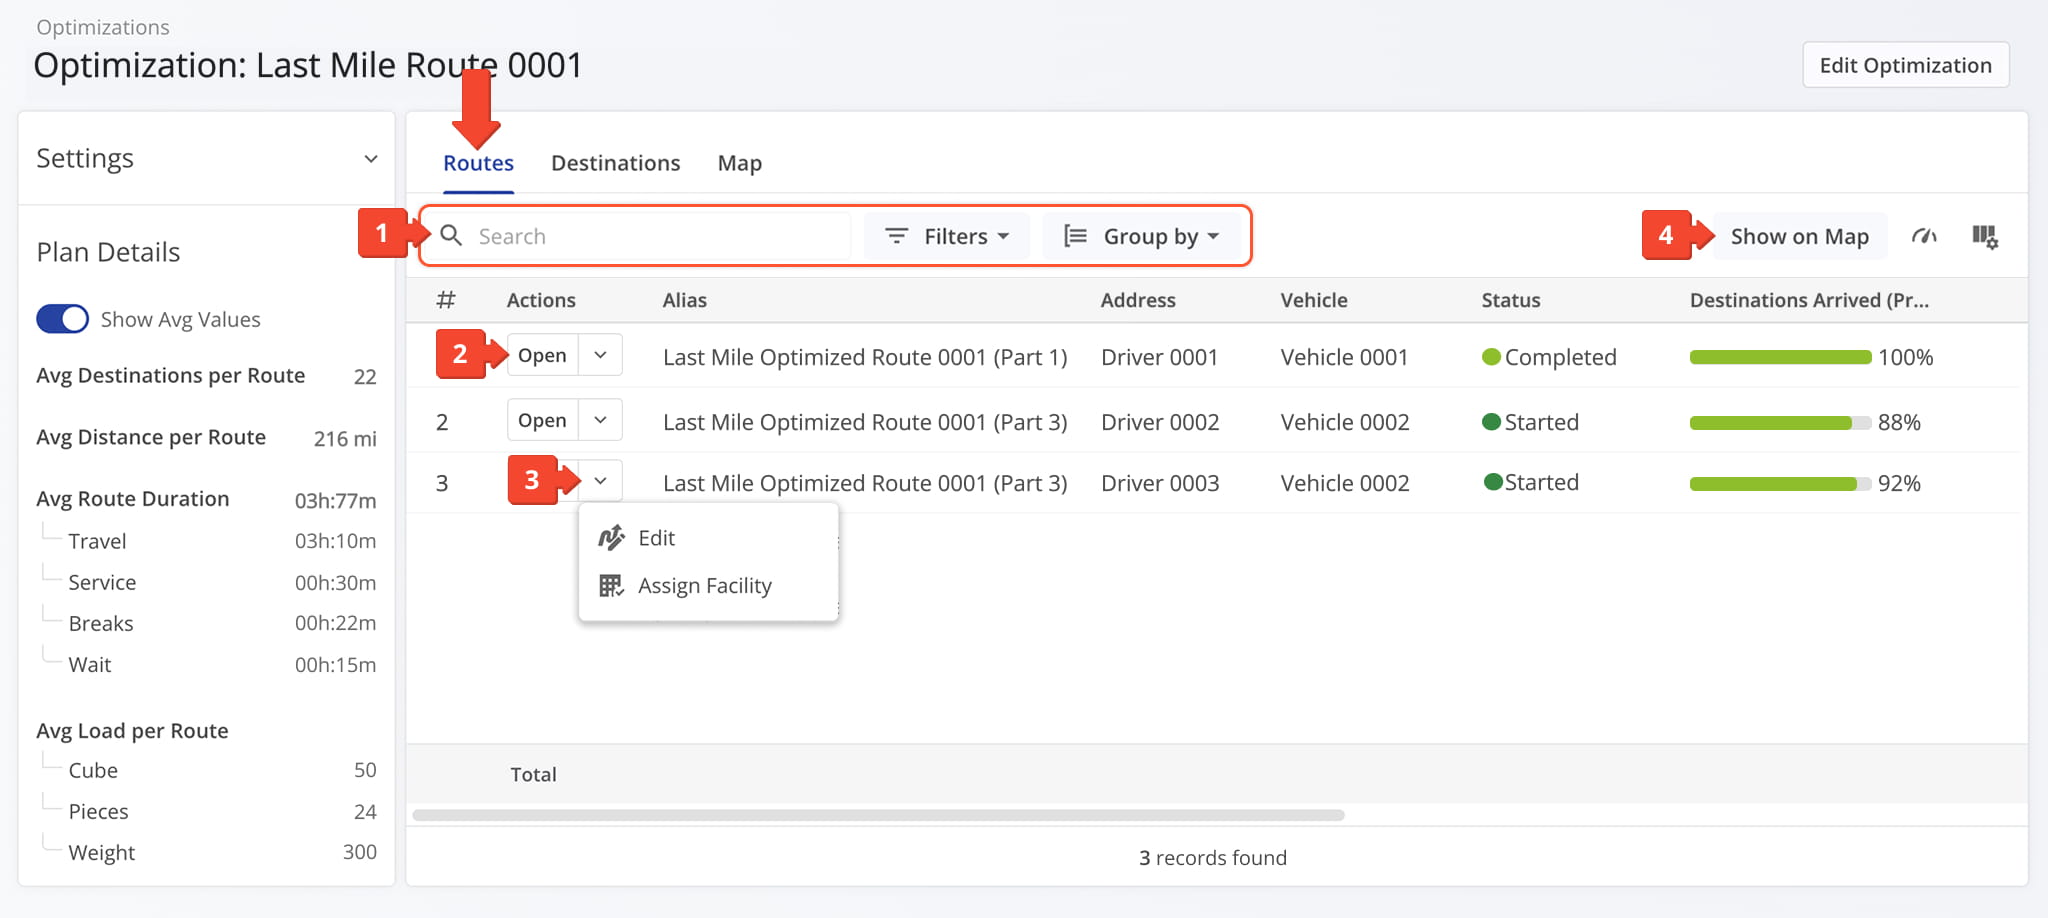
The Routes tab displays all routes associated with the selected Optimization in a customizable data table. From this tab you can:
- Use the Search field to locate specific routes, “Group By” to organize them, or filters (described below) to narrow displayed data.
- Click “Open” next to a route to access its Route Snapshot.
- Click the Down Arrow next to a route to either “Edit” it or click “Assign Facility” to assign the route to a Final Mile Facility.
- Click “Show on Map” to view the route in the Route Editor, where you can also make modifications.
| Filter | Description | |
|---|---|---|
| Assignment & Attribution | ||
| Vehicle | Filter by vehicle assigned to the route. | |
| Facility | Filter by facility linked to the route. | |
| Customer | Filter by customer linked to the route. | |
| Contract | Filter by contract linked to the route. | |
| Strategic Optimization | ||
| Strategic Optimization Name | Filter by the name of the strategic optimization used to generate or modify the route. | |
| Scenario Name | Filter by the scenario applied during strategic route planning. | |
| Route | ||
| Status | Filter by the current progress or completion state of the route (e.g., Planned, Scheduled, Started, Completed). | |
| Planned Total Route Duration (h) | Filter by the total estimated duration, in hours, planned for completing the route. | |
| Planned Total Distance (mi) | Filter by the total planned distance, in miles, for completing all stops on the route. | |
| Progress Metrics | ||
| Destinations Arrived (Progress %) (User Actioned) | Filter by the percentage of planned destinations the driver has arrived at. | |
| Key Metrics | ||
| Destinations Count | Filter by the total number of destinations assigned to the route. | |
| Pending Destinations | Filter by destinations not yet started or completed by the driver. | |
| Failed Destinations | Filter by destinations marked as failed due to inability to complete service. | |
| Skipped Destinations | Filter by destinations the driver intentionally skipped or bypassed. | |
| Completed Destinations | Filter by destinations successfully completed on the route. | |
| Notes Count | Filter by number of notes added to the route by users or automated processes. | |
| Customer Requested Time Window Adherence | ||
| Destinations Arrived Late (User Actioned) | Filter by destinations where the driver arrived after the scheduled time window. | |
| Destinations Arrived Early (User Actioned) | Filter by destinations where the driver arrived earlier than the scheduled time window. | |
| Destinations Arrived On Time (User Actioned) | Filter by destinations where the driver arrived within the scheduled time window. | |
| SLA | ||
| Out of Sequence Destinations (#) | The number of destinations visited in an order different from the planned sequence. | |
| Actual Route Distance | ||
| Actual Total Distance (Mobile App) (mi) | Total distance in miles recorded by the mobile app during the route. | |
| Actual Total Distance (Telematics) | Total distance in miles recorded from the assigned vehicle’s telematics device. | |
| Utilization – Pieces/Units | ||
| Planned | Filter by total planned Pieces (units) amount of all Destinations on the planned route. | |
| Completed | Filter by total number of completed pieces or units. | |
| Completed (%) | Filter by percentage of pieces or units completed. | |
| Remaining At End (%) | Filter by percentage of pieces or units still remaining when the route ended. | |
| Utilization – Weight | ||
| Planned | Filter by total planned Weight amount of all Destinations on the planned route. | |
| Completed | Filter by total weight completed across all serviced destinations. | |
| Completed (%) | Filter by percentage of planned weight completed. | |
| Remaining At End (%) | Filter by percentage of planned weight still remaining at the route’s end. | |
| Utilization – Cube | ||
| Planned | Filter by total planned Cube (volume) amount of all Destinations on the planned route. | |
| Completed | Filter by total cubic volume completed across all serviced destinations. | |
| Completed (%) | Filter by percentage of the planned volume completed. | |
| Remaining At End (%) | Filter by percentage of planned volume remaining at the route’s end. | |
| Utilization – Revenue | ||
| Planned | Filter by total revenue to be generated from servicing all route Destinations. | |
| Completed | Filter by total revenue generated from the Destinations completed on the route. | |
| Completed (%) | Filter by percentage of planned revenue achieved. | |
| Remaining At End (%) | Filter by percentage of revenue still unfulfilled at route end. | |
| Utilization – Cost | ||
| Cost | The estimated or recorded total expense associated with completing all stops on the route, including labor, fuel, and other operational costs. | |
| Address Book Details | ||
| Address Book Details | Information from your Route4Me address book linked to the route, including saved addresses, contact names, and relevant notes for reference or communication. | |
You can also customize the data displayed in the table. Click the Column Icon in the upper right corner to select which route data fields appear and adjust their order to suit your operational needs.
The table below provides an overview of all available data columns, which you can reorder by dragging them into place.
| Item | Description | |
|---|---|---|
| Route | ||
| Date Created | Date and time when the route was created. | |
| Scheduled Start Time | Scheduled start time for the route. | |
| Planned End Time | Planned end time for the route. | |
| Actual Start Time | Time when the route actually started. | |
| Route Total Distance | Total distance planned for the route, including all stops. | |
| Planned Total Route Duration | Estimated total duration for completing the route. | |
| Start Time Zone | Timezone of the route’s start location. | |
| Total Man Hours | Total estimated working hours for completing the route. | |
| Route # | The route number. This is relevant when you are exporting multiple routes. | |
| Key Metrics | ||
| Destinations Count | Total number of destinations planned for the route. | |
| Pending Destinations | Number of destinations not yet visited. | |
| Failed Destinations | Number of destinations that could not be completed. | |
| Skipped Destinations | Number of destinations intentionally skipped. | |
| Completed Destinations | Number of destinations successfully completed. | |
| Notes Count | Total number of notes added to the route by users or automated processes. | |
| Route Start Odometer | The vehicle odometer reading at the beginning of the route. | |
| Route End Odometer | The vehicle odometer reading at the completion of the route. | |
| Customer Requested Time Window Adherence | ||
| Destinations Arrived On-Time (User Actioned) | Destinations where arrival matched the scheduled time, based on user input. | |
| Destinations Arrived Early (User Actioned) | Destinations reached earlier than scheduled, based on user input. | |
| Destinations Arrived Late (User Actioned) | Destinations reached later than scheduled, based on user input. | |
| Operational Status | ||
| First Access Time | Date and time the route was first viewed by a user. | |
| Status | Current progress or completion status of the route. | |
| Dispatch | Indicates whether the route has been assigned to a driver or team. | |
| Progress Metrics | ||
| Arrived Destinations (User Actioned) | Number of destinations marked as arrived by user actions. | |
| Destinations Arrived (Progress %) (User Actioned) | Percentage of destinations completed, based on user input. | |
| Actual Route Distance | ||
| Actual Total Distance (Mobile App) | Total distance traveled, recorded by the mobile app. | |
| Actual Total Distance (Telematics) | Total distance traveled, recorded by telematics. | |
| Actual Total Distance (Merged) | Combined distance from mobile app and telematics data. | |
| Actual Duration | ||
| Actual Route Duration (User Actioned) | Actual Route Duration is calculated based on the received Mobile App GPS data. Duration is measured from when the route was started to when the route was ended by the assigned User on the Mobile App. | |
| Actual Total Route Duration (Grand Total of All Sub-Durations) | The total time spent traveling the route, including all individual segments and stop durations. | |
| Actual Total Travel Duration (User Actioned) | The total time spent traveling the route, recorded from driver actions in the Mobile App. | |
| Actual Total Service Duration (User Actioned) | The total time drivers spent servicing stops, recorded from actions in the Mobile App. | |
| Actual Total Wait Duration (User Actioned) | Total amount of time that a driver spent being inactive while driving the route (i.e., a route started before the opening hours and a driver had to wait, a driver arrived at the address before the opening of the Time Window, etc.). | |
| Actual Total Break Duration | The total duration of all scheduled breaks for the route, calculated based on the planned stops and route schedule. | |
| Actual Total Unattributed Duration | Time not attributed to driving, service, or breaks. | |
| Actual Service Time | ||
| Actual Total Service Time (Auto Detected) | The total amount of the average Service Time of all destinations on the route. | |
| Actual Travel Duration | ||
| Actual Total Duration (Mobile App) | Total duration of route recorded via the mobile app. | |
| Actual Total Duration (Telematics) | Total duration of route recorded via telematics. | |
| Planned Durations | ||
| Planned Route Duration | Estimated total route duration. | |
| Planned Total Travel Duration | Estimated driving time for the route. | |
| Planned Total Wait Duration | Estimated total wait time during the route. | |
| Planned Total Service Duration | Estimated total service time at destinations. | |
| Planned Total Break Duration | Estimated total driver break time. | |
| SLA | ||
| Out of Sequence Destinations (#) | The number of destinations visited in an order different from the planned sequence. | |
| Out of Sequence Destinations (%) | The percentage of destinations visited in an order different from the planned sequence. | |
| Assignment & Attribution | ||
| Facility | The depot, warehouse, or starting point used for planning the route; serves as the origin for route sequencing and time calculations. | |
| Customer | The name of the customer associated with the route or destination, as defined in the account or order data. | |
| Contract | The name or identifier of the contract linked to the assigned customer, if applicable, used for tracking or reporting purposes. | |
| Utilization – Pieces/Units | ||
| Pieces Planned | Total number of pieces planned for delivery. | |
| Pieces Completed | Number of pieces successfully delivered. | |
| Pieces Completed (%) | Percentage of planned pieces delivered. | |
| Pieces Remaining At End (%) | Percentage of pieces undelivered at the route’s end. | |
| Utilization – Weight | ||
| Weight Planned | Total weight of items planned for delivery. | |
| Weight Completed | Weight of items successfully delivered. | |
| Weight Completed (%) | Percentage of planned weight delivered. | |
| Weight Remaining At End (%) | Percentage of weight remaining at the end of the route. | |
| Utilization – Cube | ||
| Cube Planned | Total cubic volume planned for delivery. | |
| Cube Completed | Cubic volume successfully delivered. | |
| Cube Completed (%) | Percentage of planned cubic volume delivered. | |
| Cube Remaining At End (%) | Percentage of cubic volume remaining at the end of the route. | |
| Utilization – Revenue | ||
| Revenue Planned | Planned revenue for the route based on scheduled deliveries. | |
| Revenue Completed | Revenue earned from completed deliveries. | |
| Revenue Completed (%) | Percentage of planned revenue achieved. | |
| Revenue Remaining At End (%) | Percentage of planned revenue remaining at the route’s end. | |
| Utilization – Cost | ||
| Cost Planned | Estimated cost associated with completing all stops on the route, including labor, fuel, and other operational expenses. | |
| Strategic Optimization | ||
| Strategic Optimization Name | Name of the strategic optimization applied to the route. | |
| Scenario Name | Scenario associated with the strategic optimization. | |
| Note Custom Field Sum | ||
| Sum Decimals | Total of all decimal values entered in a custom field across the route. | |
| Sum Whole Numbers | Total of all whole number values entered in a custom field across the route. | |
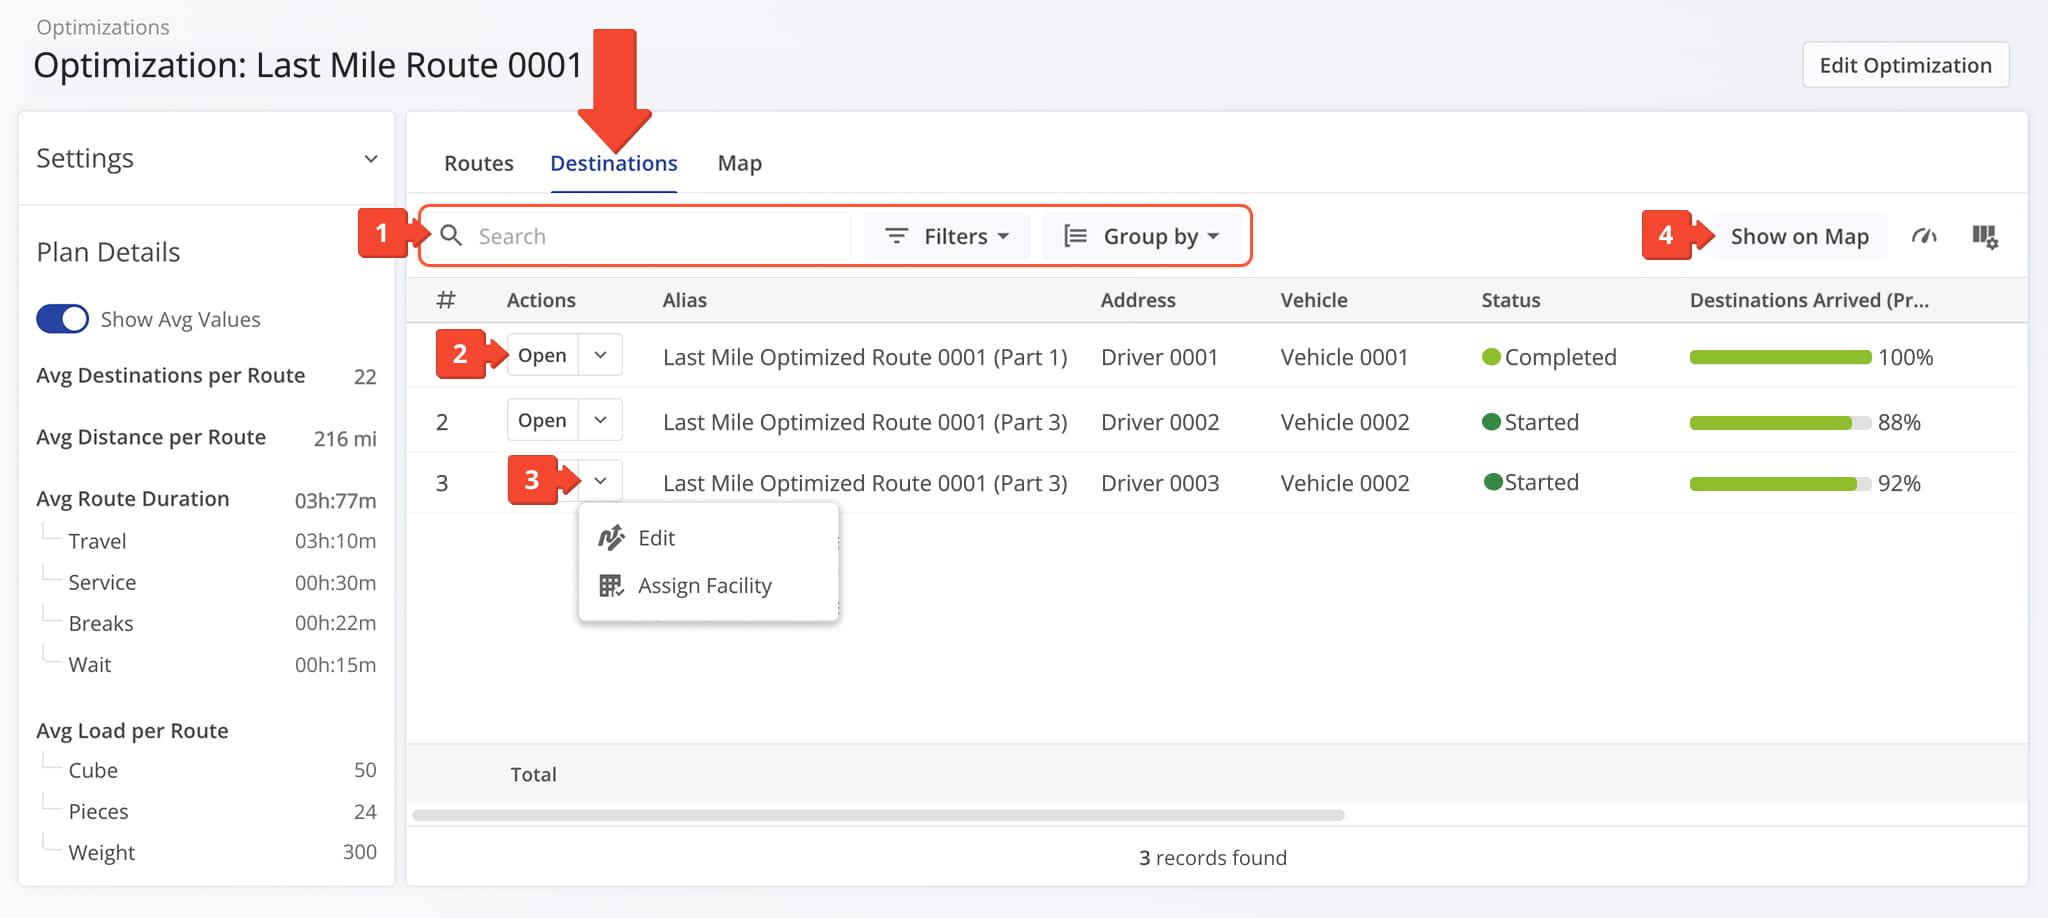
Destinations Tab – Stop Details And Operational Data
From the Destinations tab, you can view all destinations included in the selected Optimization. From this tab you can:
- Use the Search field to locate specific routes, “Group By” to organize them, or filters (described below) to narrow displayed data.
- Click “Open” next to a route to access its Destination Snapshot.
- Click the Down Arrow next to a route and select “Open Route” (open its Route Snapshot) or “Edit Route” (open it in the Route Editor).
- Click “Show on Map” to view the destinations in the Route Editor, where you can also make modifications.
| Column | Description | |
|---|---|---|
| Assignment & Attributes | ||
| Assigned User | Filter by driver or field team member assigned to the destination. | |
| Assigned Vehicle | Filter by vehicle assigned to the destination. | |
| Assigned Customer | Filter by the name of the customer associated with the destination. | |
| Route Name | Filter by the name of the route associated with the destination. | |
| Assigned Facility | Filter by the facility associated with the destination. | |
| Destination | ||
| Service Type | Filter by the type of service at the destination (e.g., delivery, pickup). | |
| Alias | Filter by the custom name or label for the destination address. | |
| Destinations Sequence # | Filter by the order in which the destination is scheduled on the route. | |
| Arrived | text | |
| Departed | text | |
| Destination Status | Filter by the current status of the destination (e.g., completed, pending, failed). | |
| Notes Count | text | |
| Order | ||
| Tracking Number | Filter by the identifier used to track the shipment. | |
| Order Number | Filter by the order reference number for tracking purposes. | |
| Invoice Number | Filter by the invoice number associated with the order. | |
| Reference Number | Filter by the additional unique reference for the order or transaction. | |
| Dimensional & Financial | ||
| Priority | Filter by the priority level assigned to the destination for scheduling. | |
| Cube | Filter by the volume of items for delivery at the destination. | |
| Pieces /Unit | Filter by the number of individual items or packages for delivery. | |
| Weight | Filter by the total weight of items for delivery. | |
| Revenue | Filter by the revenue associated with the destination or delivery. | |
| Customer | ||
| First Name | Filter by the customer’s first name. | |
| Last Name | Filter by the customer’s last name. | |
| Filter by the customer’s email address. | ||
| Phone | Filter by the customer’s phone number. | |
| Customer PO | Filter by the customer purchase order associated with the destination. | |
| Group | Filter by the customer group or category. | |
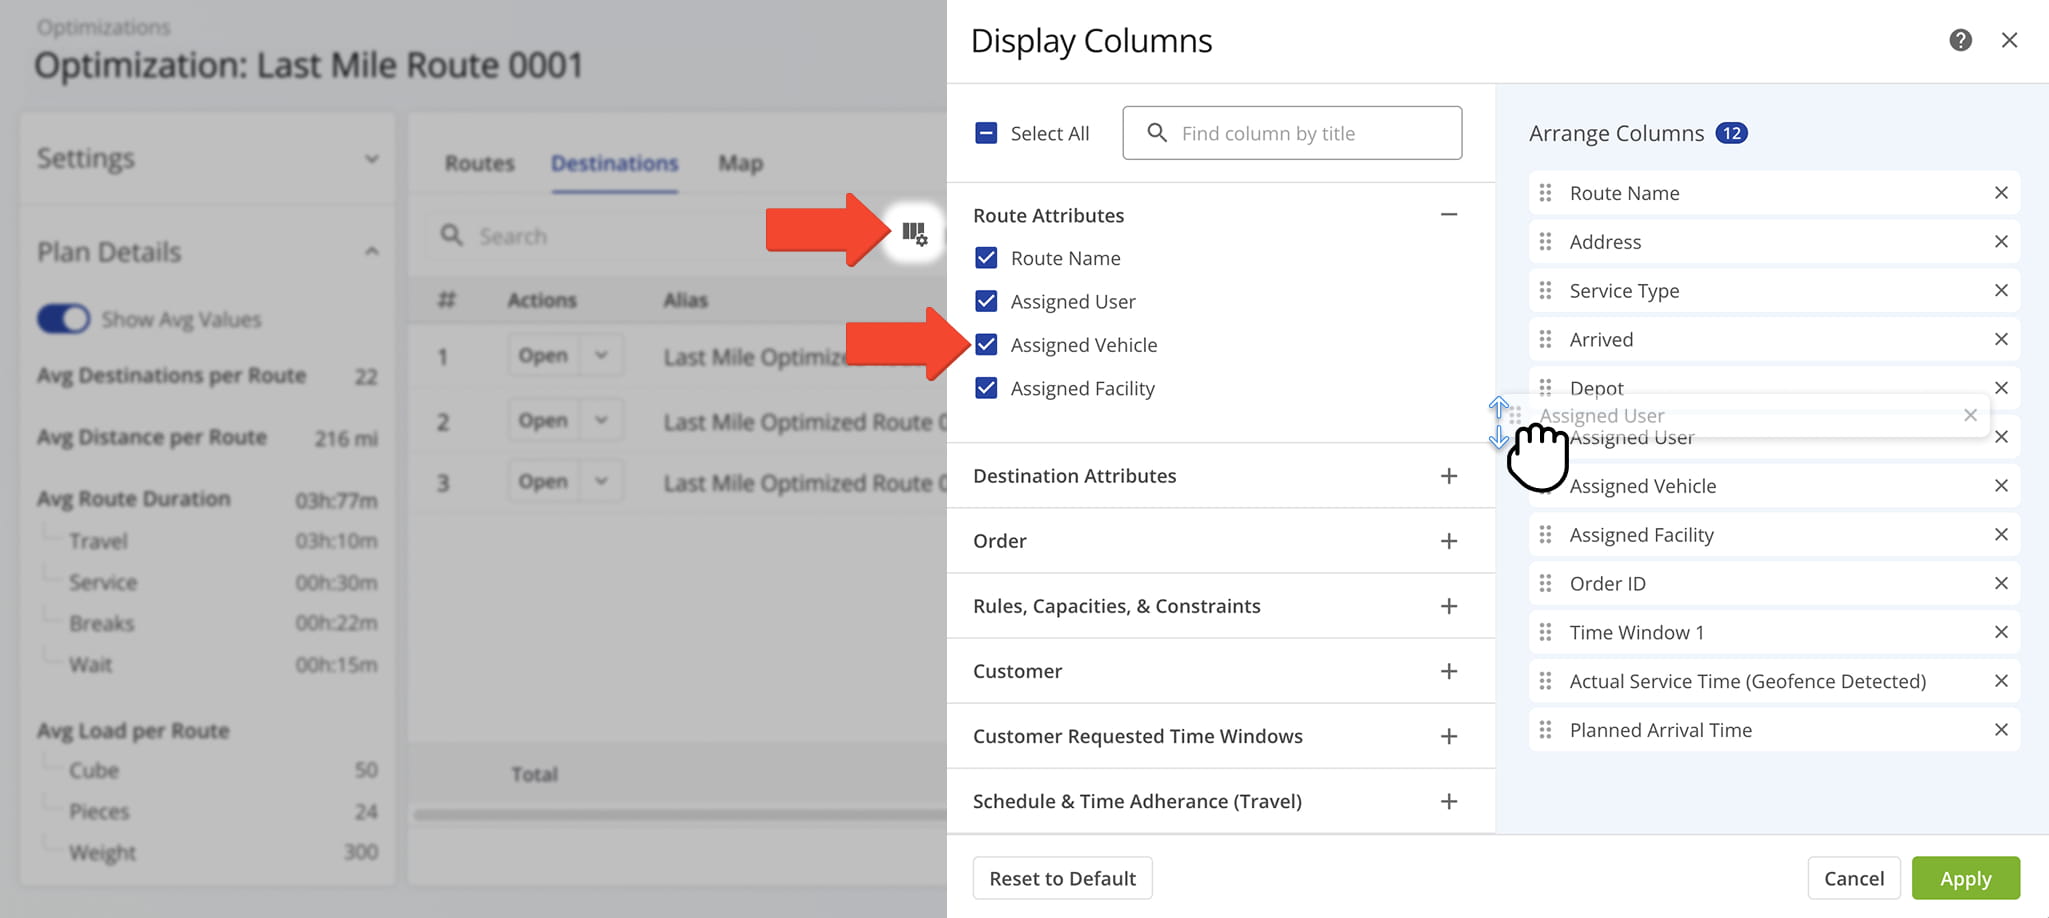
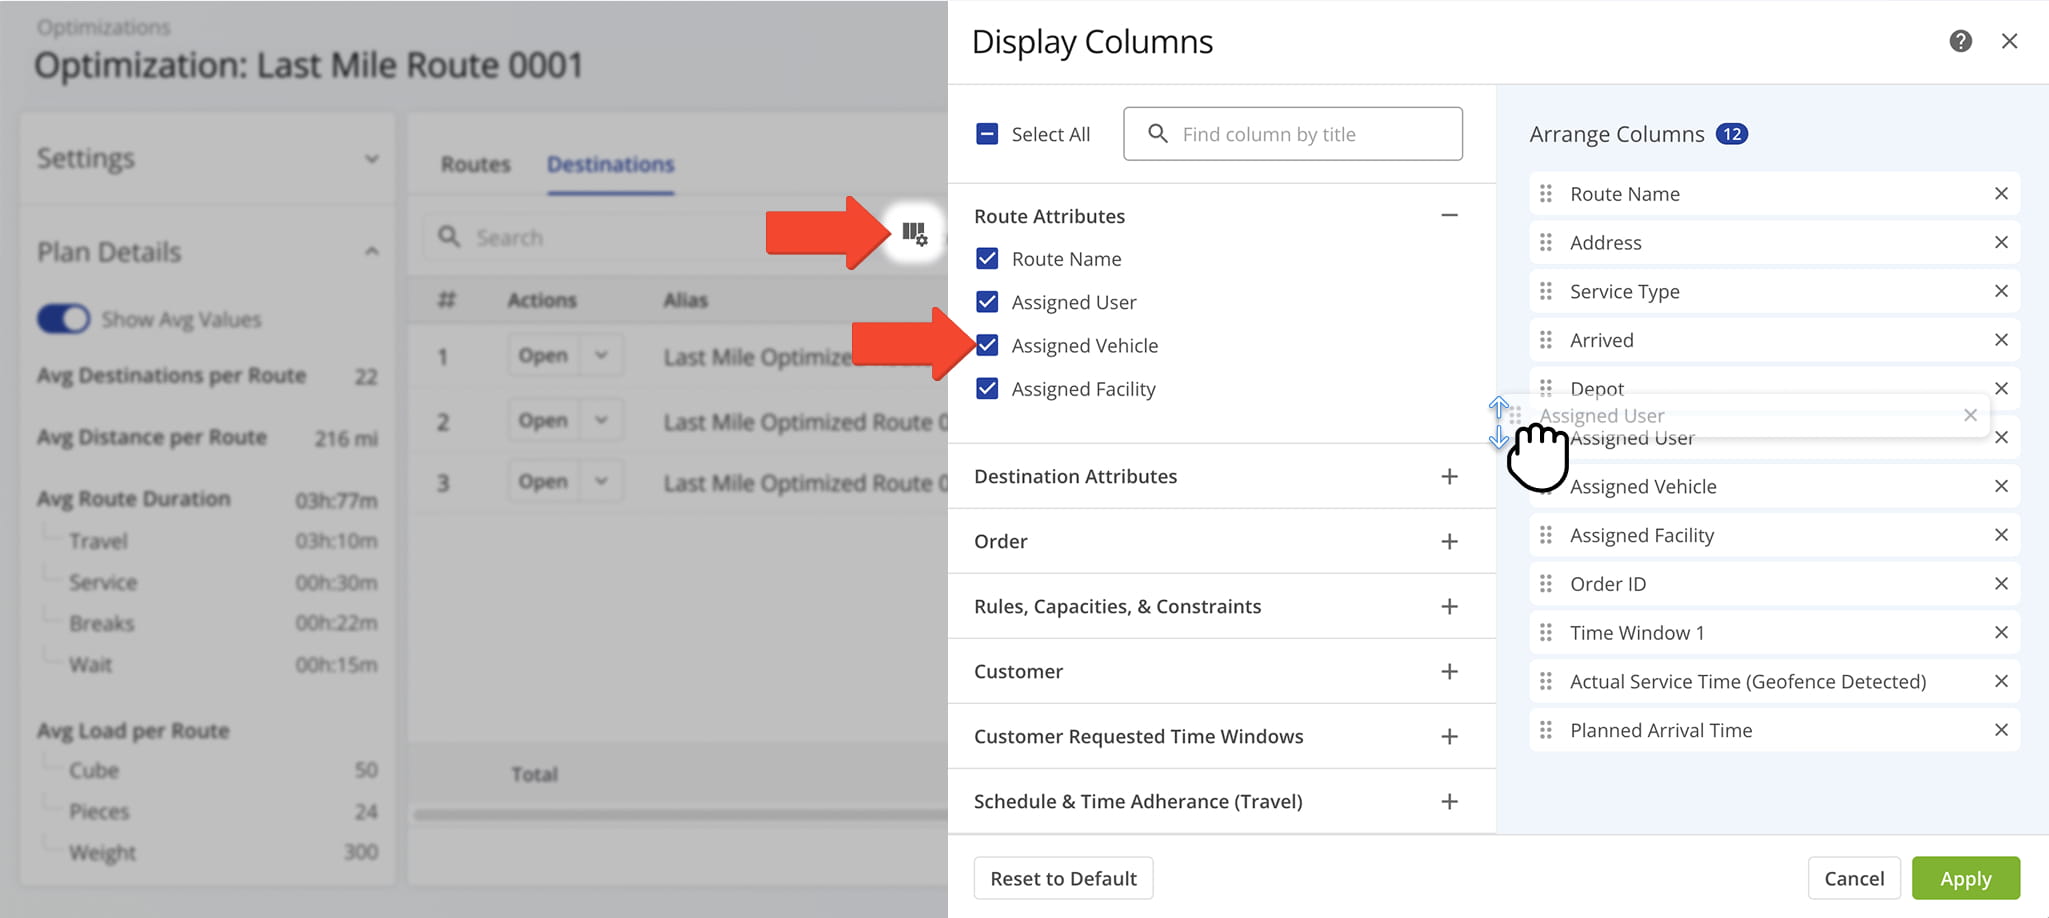
You can also customize the data displayed in the table. Click the Column Icon in the upper right corner to select which route data fields appear and adjust their order to suit your operational needs.
The table below provides an overview of all available data columns, which you can reorder by dragging them into place.
| Data | Description | |
|---|---|---|
| Route Attributes | ||
| Route Name | Name of the route associated with the destination. | |
| Assigned User | The user responsible for the route, typically the driver or team completing it. | |
| Assigned Vehicle | The vehicle assigned to the route for tracking and capacity purposes. | |
| Assigned Facility | The facility associated with the route, usually serving as the start or end location. | |
| Destination Attributes | ||
| Depot | The starting location or home base for the route. | |
| Destination Sequence # | The planned order of this destination within the route, indicating the sequence the driver should follow. | |
| Address | The full street address of the destination for delivery or service. | |
| Alias | A custom name or shorthand identifier for the destination to simplify identification. | |
| Service Type | The type of service or delivery expected at the destination, e.g., pickup, drop-off, or service call. | |
| Status | The current status of the destination (e.g., pending, in progress, completed, failed). | |
| Timezone | The time zone of the destination, used for accurate scheduling of arrivals and departures. | |
| Distance to Next Destination | The driving distance from this destination to the next stop on the route. | |
| Drive Time to Next Destination | The estimated travel time from this destination to the next stop, based on planned routing. | |
| Man-Hours | Employee working hours required for completing the destination visit. | |
| Notes Count | Total number of notes added to a destination by users or automated processes. | |
| Customer Billing Type | The billing classification applied to the customer associated with the destination. | |
| Order | ||
| Order ID | Unique identifier for the order in the system. | |
| Tracking Number | The shipping or tracking number associated with the order for logistics purposes. | |
| Order Number | Reference number assigned to the order by the system or customer. | |
| Invoice Number | The invoice number linked to the order. | |
| Reference Number | Additional reference or internal tracking number associated with the order. | |
| Rules, Capacities, & Constraints | ||
| Priority | The priority level of the order or destination, which may affect route sequencing. | |
| Cube | The volume of items for the destination, used for vehicle load planning. | |
| Pieces / Units | The total quantity of items or units for delivery or service at the destination. | |
| Weight | The total weight of items for the destination, used for vehicle capacity planning. | |
| Revenue | The expected revenue associated with completing the order at the destination. | |
| Cost | The cost value associated with completing the order at the destination. | |
| Customer | ||
| Customer | The name of the customer receiving the service or delivery. | |
| First Name | Customer’s first name for identification and communication purposes. | |
| Last Name | Customer’s last name for identification and communication purposes. | |
| Customer’s email address, used for notifications or tracking updates. | ||
| Phone | Customer’s phone number, used for notifications or communication. | |
| Customer PO | The customer’s purchase order number associated with the order. | |
| Group | A classification or grouping of the customer, often used for reporting or filtering. | |
| Customer Requested Time Windows | ||
| Time Window 1 | The first requested time window for service at the destination. | |
| Time Window 2 | The second requested time window for service, if applicable. | |
| Schedule & Time Adherence (Travel) | ||
| Actual Arrival Time (User Actioned) | The arrival time recorded manually by the user. “User Actioned” means it was entered or confirmed by a person rather than automatically detected. | |
| Actual Departure Time (User Actioned) | The departure time recorded manually by the user. | |
| Schedule & Time Adherence (Service) | ||
| Planned Service Time | The expected duration of service at the destination based on planning. | |
| Actual Service Time (User Actioned) | The service duration recorded manually by the user, reflecting the real-world time spent completing the service or delivery. | |
| Geofence Detections | ||
| Actual Service Time (Geofence Detected) | The service duration automatically recorded when the user is within the destination geofence. | |
| Actual Arrival Time (Geofence Detected) | The arrival time automatically detected when the vehicle enters the geofence. | |
| Actual Departure Time (Geofence Detected) | The departure time automatically detected when the vehicle exits the geofence. | |
| Entry Speed (Geofence Detected) | Vehicle speed upon entering the geofence, useful for safety and compliance tracking. | |
| Entry Odometer (Geofence Detected) | Odometer reading when the vehicle enters the geofence. | |
| Exit Speed (Geofence Detected) | Vehicle speed upon leaving the geofence. | |
| Exit Odometer (Geofence Detected) | Odometer reading when the vehicle leaves the geofence. | |
| Device ID (Geofence Detected) | The identifier of the device that recorded the geofence event. | |
| Vehicle ID (Geofence Detected) | The identifier of the vehicle associated with the geofence detection. | |
| Telematics Vehicle ID (Geofence Detected) | The telematics-assigned vehicle ID used to track geofence events. | |
| Arrival & Departure Status | ||
| Arrived | Indicates whether the destination has been marked as arrived, either manually or via geofence detection. | |
| Departed | Indicates whether the destination has been marked as departed, either manually or via geofence detection. | |
| Arrival & Departure Time | ||
| Planned Arrival Time | The scheduled time for arrival at the destination based on route planning. | |
| Planned Departure Time | The scheduled time for departure from the destination. | |
| Actual Arrival Time (User Actioned) | The user-recorded arrival time at the destination. | |
| Actual Departure Time (User Actioned) | The user-recorded departure time from the destination. | |
| Dynamic Arrival Time | The estimated arrival time that adjusts in real-time based on traffic or route changes. | |
| Dynamic Departure Time | The estimated departure time that adjusts in real-time based on traffic or route changes. | |
| Arrival / Departure Schedule Deviation | ||
| Time Window Violated (User Actioned) | Indicates if the arrival or departure fell outside the scheduled time window, as recorded manually. | |
| Arrival Time Variance (-Early,+Late) (User Actioned) | The difference in minutes between the planned and actual arrival times, manually recorded. Negative indicates early arrival, positive indicates late. | |
| Departure Time Variance (-Early,+Late) (User Actioned) | The difference in minutes between planned and actual departure times, manually recorded. Negative indicates early departure, positive indicates late. | |
| Planned Remaining Capacity | ||
| Planned Remaining Cube | Estimated remaining volume capacity of the vehicle after servicing this destination. | |
| Planned Remaining Pieces | Estimated remaining item/unit capacity of the vehicle after servicing this destination. | |
| Planned Remaining Revenue | Expected remaining revenue after servicing this destination. | |
| Planned Remaining Weight | Estimated remaining weight capacity of the vehicle after servicing this destination. | |
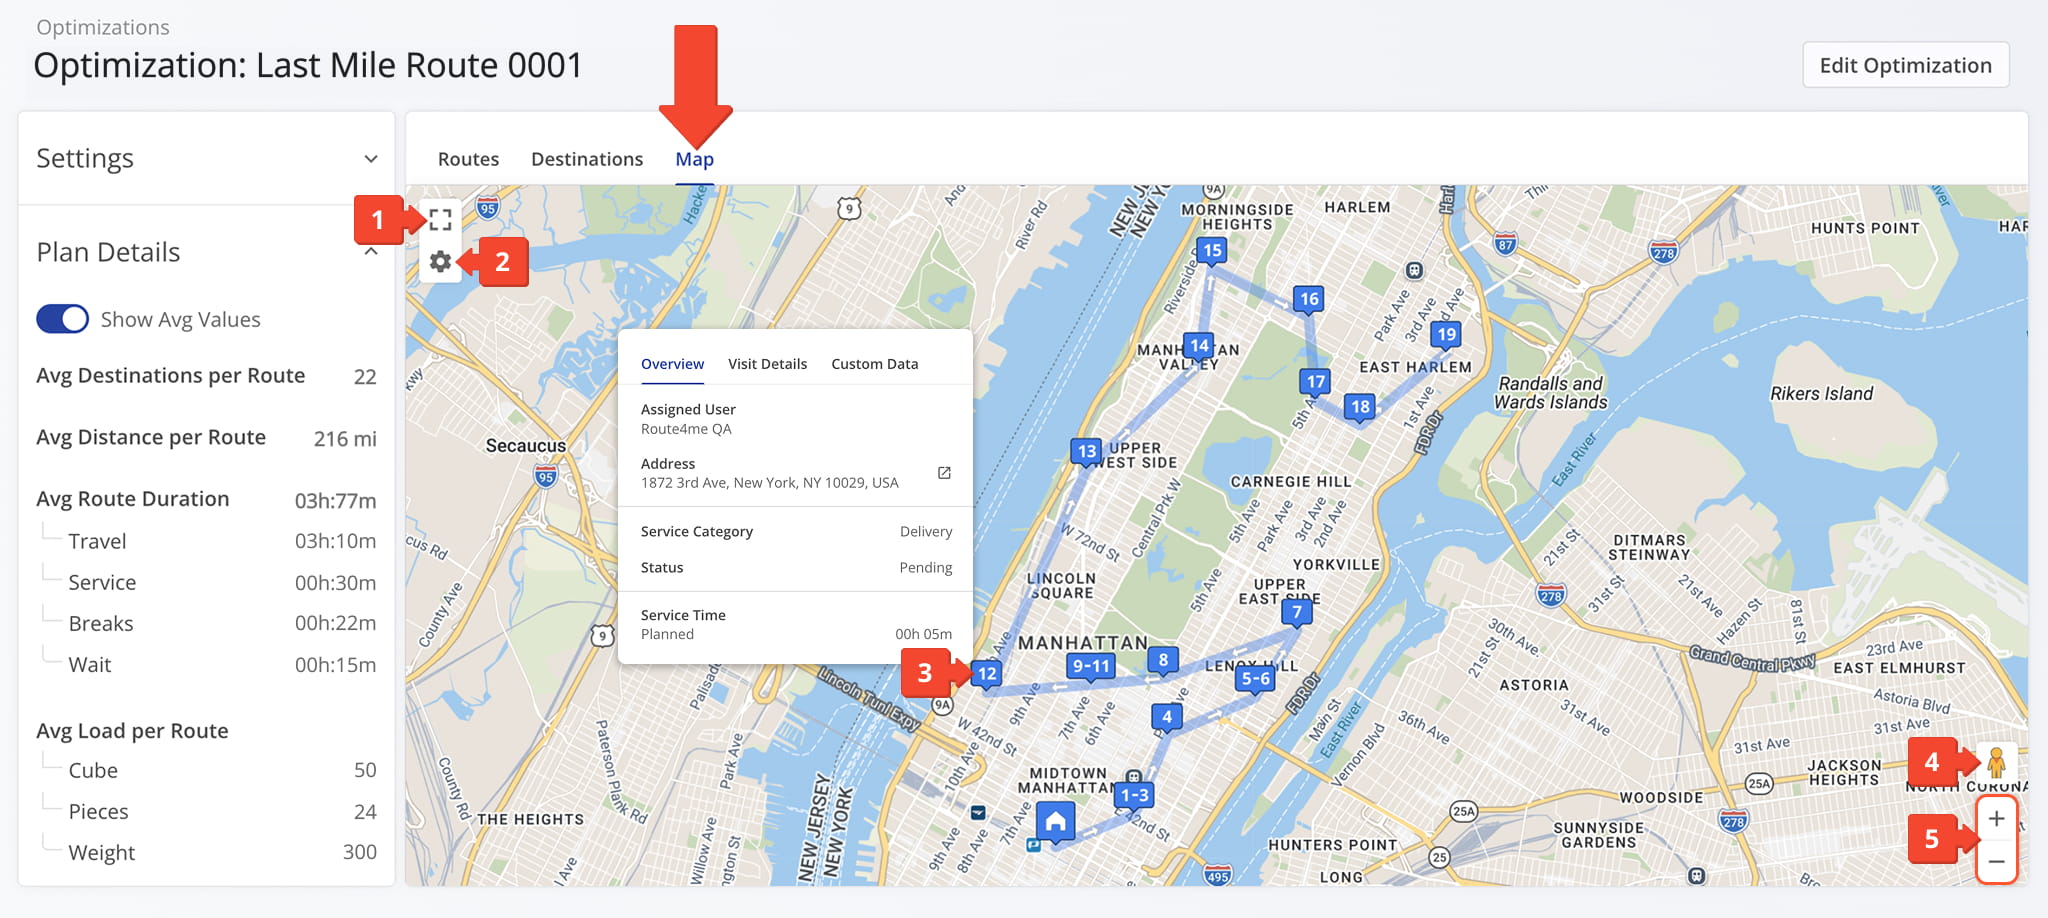
Map Tab – Interactive Route And Destination Insights
The Map tab provides a visual, interactive view of the selected Optimization, showing an associated route and its destinations while allowing you to access route-level data and view stop distribution in a geographic context. From this tab you can:
- Click the Full Screen icon to expand the map for a larger, more detailed view.
- Click the Gear icon to adjust map settings, including map type, route display, and map layers.
NOTE: The map provides the same route-level detail and operational data as the Routes Page Routes Map. - Click on any location to access detailed information about that specific destination.
- Drag the Pegman icon onto the map to access Street View for location-level detail.
- Click the Plus (+) and Minus (–) controls to zoom in or out for better visibility.
Visit Route4Me's Marketplace to Check out Associated Modules:
- Operations
Audit Logging and Activity Stream
- Operations
Custom Data Add-On
- Operations
Advanced Team Management Add-On
About author: Daniel Archer
With a background in pedagogy and writing instruction, Daniel is a former tenured English Instructor who, after nearly 20 years of teaching, transitioned into content strategy and leading writing teams for global brands. Now, as Technical Documentation Manager at Route4Me, he translates complex logistics technology into clear, accessible content that empowers users.