Routes Page Data Catalog – Routes List Data Columns And Filters Database
The Routes Page provides an overview of all route data, including key metrics, status, and destination information. You can customize route data columns, apply filters to find routes or stops, and use grouping options to organize routes by shared attributes. This centralized view helps you track performance, monitor progress, and optimize operations.
Table of Contents
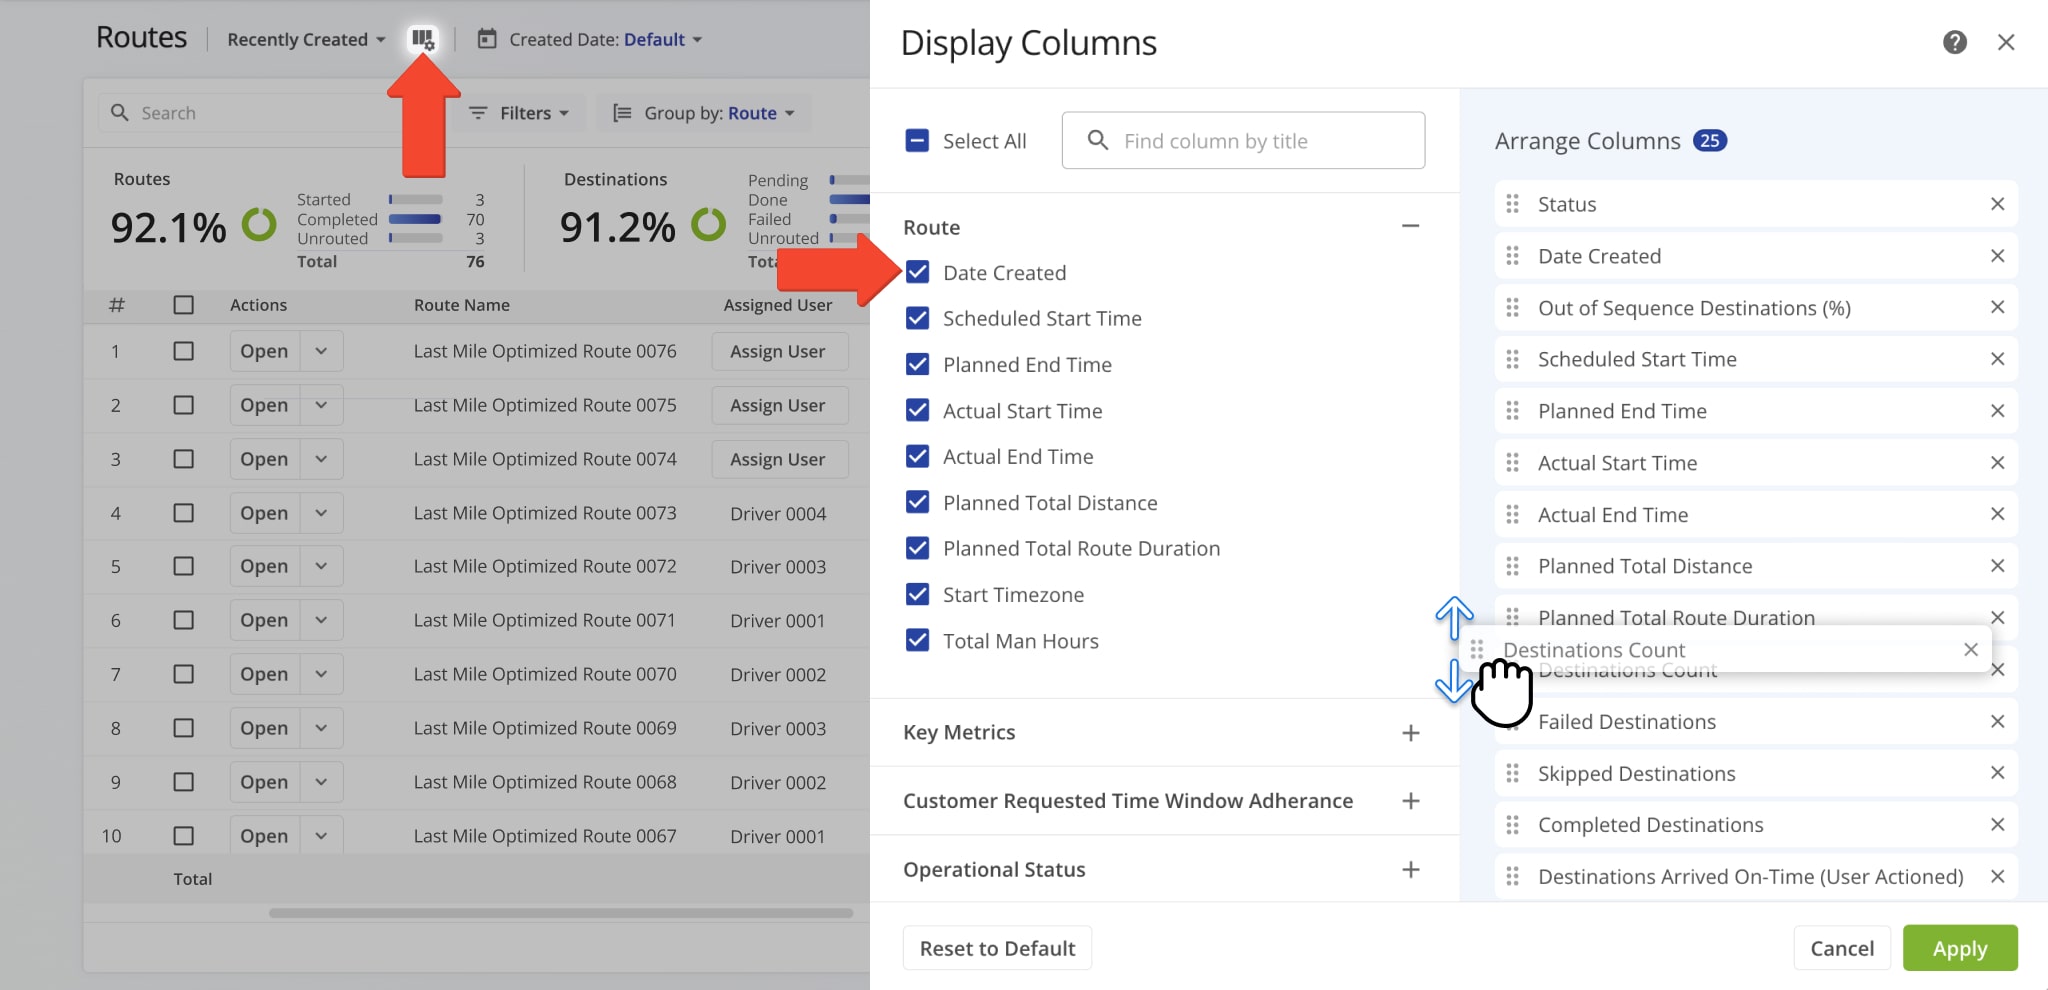
Routes Page Data Columns
Below is a table of all data columns available on your Routes Page. The columns are organized into categories such as route details, key metrics, and operational status so you can navigate your route data more efficiently.
| Data Column | Description | |
|---|---|---|
| Route | ||
| Date Created | Date and time when the route was created. | |
| Scheduled Start Time | Scheduled start time for the route. | |
| Planned End Time | Planned end time for the route. | |
| Actual Start Time | Time when the route actually started. | |
| Actual End Time | Time when the route was completed. | |
| Planned Total Distance | Total distance planned for the route, including all stops. | |
| Planned Total Route Duration | Estimated total duration for completing the route. | |
| Start Timezone | Timezone of the route’s start location. | |
| Total Man Hours | Total estimated working hours for completing the route. | |
| Key Metrics | ||
| Destinations Count | Total number of destinations planned for the route. | |
| Pending Destinations | Number of destinations not yet visited. | |
| Failed Destinations | Number of destinations that could not be completed. | |
| Skipped Destinations | Number of destinations intentionally skipped. | |
| Completed Destinations | Number of destinations successfully completed. | |
| Customer Requested Time Window Adherence | ||
| Destinations Arrived On-Time (User Actioned) | Destinations where arrival matched the scheduled time, based on user input. | |
| Destinations Arrived Early (User Actioned) | Destinations reached earlier than scheduled, based on user input. | |
| Destinations Arrived Late (User Actioned) | Destinations reached later than scheduled, based on user input. | |
| Operational Status | ||
| First Access Time | Date and time the route was first viewed by a user. | |
| Status | Current progress or completion status of the route. | |
| Dispatch | Indicates whether the route has been assigned to a driver or team. | |
| Progress Metrics | ||
| Arrived Destinations (User Actioned) | Number of destinations marked as arrived by user actions. | |
| Destinations Arrived (Progress %) (User Actioned) | Percentage of destinations completed, based on user input. | |
| Actual Route Distance | ||
| Actual Total Distance (Mobile App) | Total distance traveled, recorded by the mobile app. | |
| Actual Total Distance (Telematics) | Total distance traveled, recorded by telematics. | |
| Actual Total Distance (Merged) | Combined distance from mobile app and telematics data. | |
| Actual Duration | ||
| Actual Route Duration (User Actioned) | Total route duration as recorded based on user actions. | |
| Actual Total Route Duration (Grand total of all route sub-durations) | Total duration of the route, combining all individual sub-durations for driving, service, wait, and breaks. | |
| Actual Total Travel Duration (User Actioned) | Total driving time recorded by user actions. | |
| Actual Total Service Duration (User Actioned) | Total service time at destinations recorded by user actions. | |
| Actual Total Wait Duration (User Actioned) | Total wait time recorded during the route. | |
| Actual Total Breaks Duration (User Actioned) | Total break time taken by drivers during the route. | |
| Actual Total Unattributed Duration (User Actioned) | Time not attributed to driving, service, or breaks. | |
| Actual Service Time | ||
| Actual Total Service Time (Auto Detected) | Service time automatically recorded by system. | |
| Actual Travel Duration | ||
| Actual Total Duration (Mobile App) | Total duration of route recorded via the mobile app. | |
| Actual Total Duration (Telematics) | Total duration of route recorded via telematics. | |
| Planned Durations | ||
| Planned Route Duration | Estimated total route duration. | |
| Planned Total Travel Duration | Estimated driving time for the route. | |
| Planned Total Wait Duration | Estimated total wait time during the route. | |
| Planned Total Service Duration | Estimated total service time at destinations. | |
| Planned Total Break Duration | Estimated total driver break time. | |
| SLA | ||
| Out of Sequence Destinations (#) | Number of destinations visited out of planned order. | |
| Out of Sequence Destinations (%) | Percentage of destinations visited out of order. | |
| Assignment & Attribution | ||
| Facility | Location or service point assigned to the route. | |
| Customer | Customer assigned to the route. | |
| Contract | Contract associated with the route. | |
| Utilization – Pieces / Units | ||
| Pieces Planned | Total number of pieces planned for delivery. | |
| Pieces Completed | Number of pieces successfully delivered. | |
| Pieces Completed (%) | Percentage of planned pieces delivered. | |
| Pieces Remaining At End (%) | Percentage of pieces undelivered at the route’s end. | |
| Utilization – Weight | ||
| Weight Planned | Total weight of items planned for delivery. | |
| Weight Completed | Weight of items successfully delivered. | |
| Weight Completed (%) | Percentage of planned weight delivered. | |
| Weight Remaining At End (%) | Percentage of weight remaining at the end of the route. | |
| Utilization – Cube | ||
| Cube Planned | Total cubic volume planned for delivery. | |
| Cube Completed | Cubic volume successfully delivered. | |
| Cube Completed (%) | Percentage of planned cubic volume delivered. | |
| Cube Remaining At End (%) | Percentage of cubic volume remaining at the end of the route. | |
| Utilization – Revenue | ||
| Revenue Planned | Planned revenue for the route based on scheduled deliveries. | |
| Revenue Completed | Revenue earned from completed deliveries. | |
| Revenue Completed (%) | Percentage of planned revenue achieved. | |
| Revenue Remaining At End (%) | Percentage of planned revenue remaining at the route’s end. | |
| Strategic Optimization | ||
| Strategic Optimization Name | Name of the strategic optimization applied to the route. | |
| Scenario Name | Scenario associated with the strategic optimization. | |
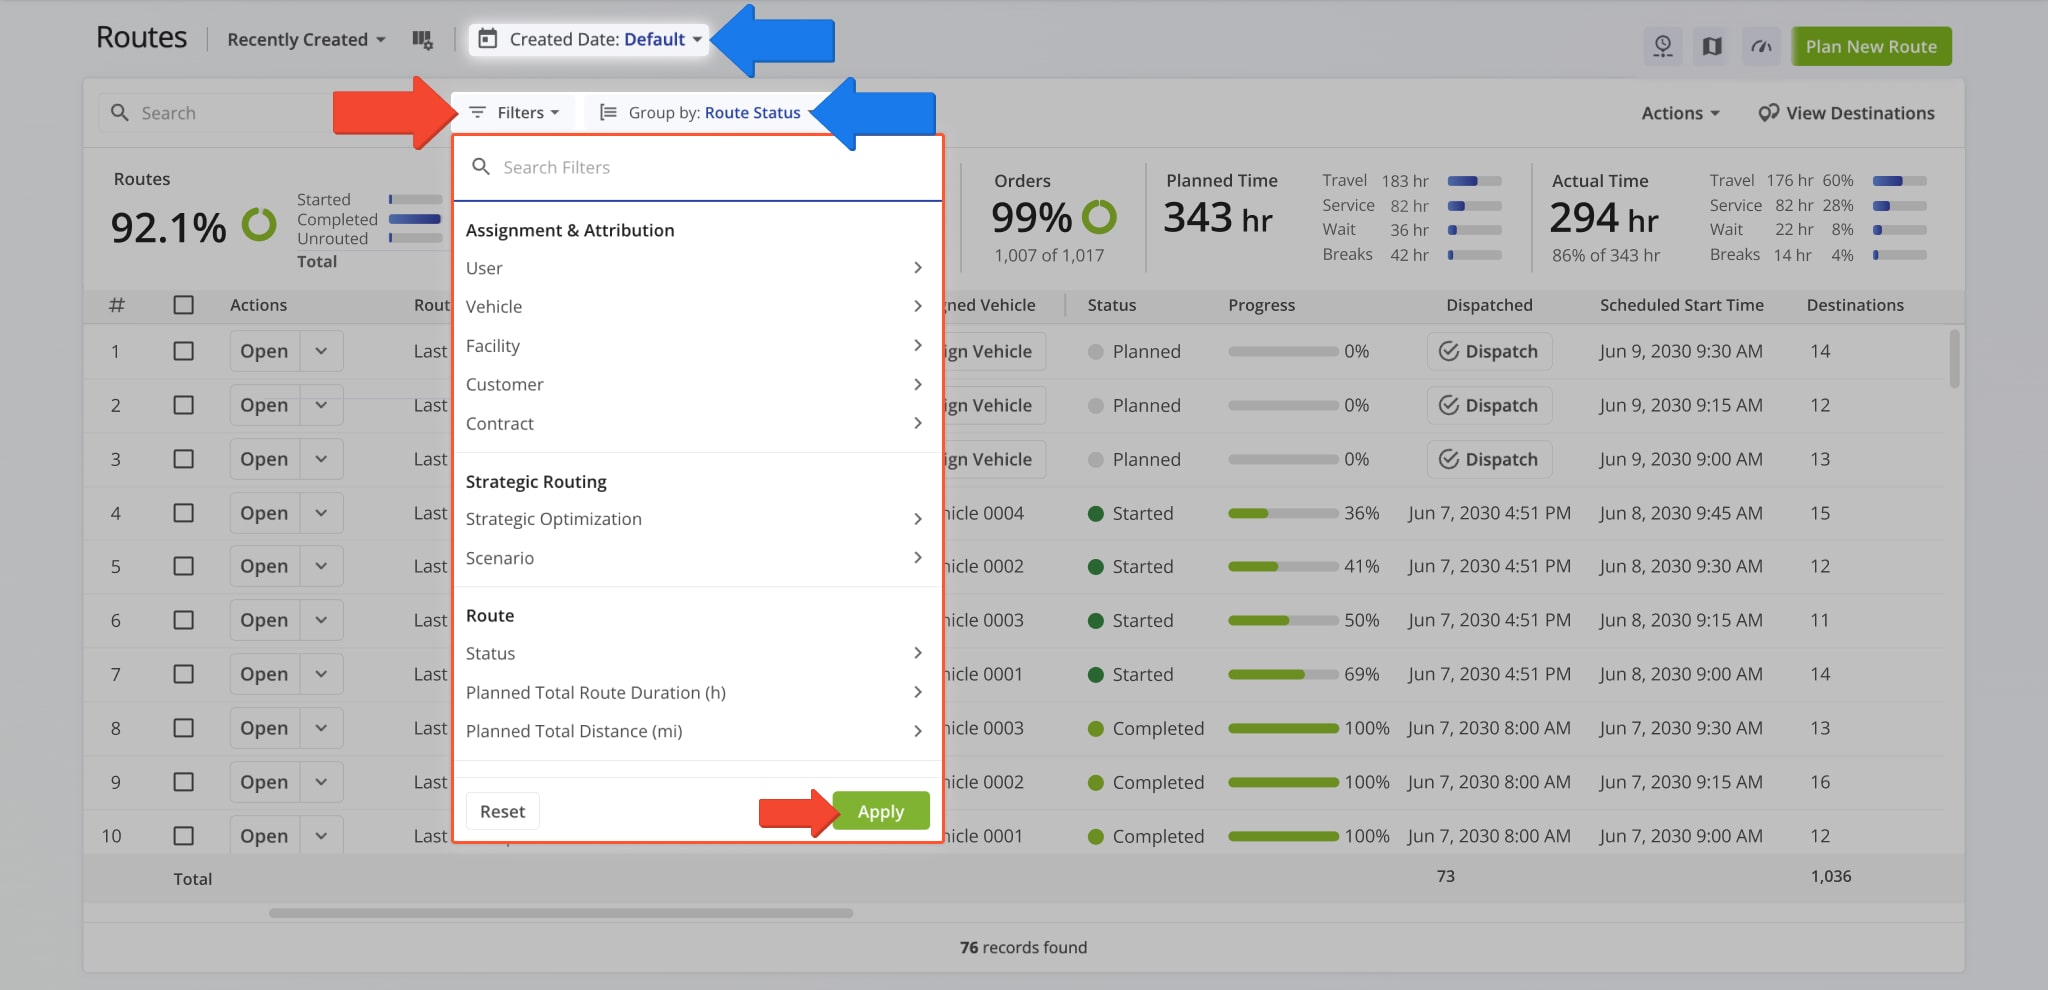
Routes Page Filters
Filters allow you to narrow and sort routes by various attributes, making it easier to review route details, compare results, and manage operations across your team. Below is an overview of all available Routes Page filters.
| Filter | Description | |
|---|---|---|
| Assignment & Attribution | ||
| User | Filter by user assigned to the route. | |
| Vehicle | Filter by vehicle assigned to the route. | |
| Facility | Filter by facility linked to the route. | |
| Customer | Filter by customer linked to the route. | |
| Contract | Filter by contract linked to the route. | |
| Strategic Optimization | ||
| Strategic Optimization Name | Filter by the name of the strategic optimization used to generate or modify the route. | |
| Scenario Name | Filter by the scenario applied during strategic route planning. | |
| Route | ||
| Status | Filter by the current progress or completion state of the route (e.g., Planned, Scheduled, Started, Completed). | |
| Planned Total Route Duration (h) | Filter by the total estimated duration, in hours, planned for completing the route. | |
| Planned Total Distance (mi) | Filter by the total planned distance, in miles, for completing all stops on the route. | |
| Progress Metrics | ||
| Destinations Arrived (Progress %) (User Actioned) | Filter by the percentage of planned destinations the driver has arrived at. | |
| Key Metrics | ||
| Destinations Count | Filter by the total number of destinations assigned to the route. | |
| Pending Destinations | Filter by destinations not yet started or completed by the driver. | |
| Failed Destinations | Filter by destinations marked as failed due to inability to complete service. | |
| Skipped Destinations | Filter by destinations the driver intentionally skipped or bypassed. | |
| Completed Destinations | Filter by destinations successfully completed on the route. | |
| Customer Requested Time Window Adherence | ||
| Destinations Arrived Late (User Actioned) | Filter by destinations where the driver arrived after the scheduled time window. | |
| Destinations Arrived Early (User Actioned) | Filter by destinations where the driver arrived earlier than the scheduled time window. | |
| Destinations Arrived On Time (User Actioned) | Filter by destinations where the driver arrived within the scheduled time window. | |
| SLA | ||
| Out of Sequence Destinations (#) | The number of destinations visited in an order different from the planned sequence. | |
| Actual Route Distance | ||
| Actual Total Distance (Mobile App) (mi) | Total distance in miles recorded by the mobile app during the route. | |
| Actual Total Distance (Telematics) | Total distance in miles recorded from the assigned vehicle’s telematics device. | |
| Utilization – Pieces/Units | ||
| Planned | Filter by total planned Pieces (units) amount of all Destinations on the planned route. | |
| Completed | Filter by total number of completed pieces or units. | |
| Completed (%) | Filter by percentage of pieces or units completed. | |
| Remaining At End (%) | Filter by percentage of pieces or units still remaining when the route ended. | |
| Utilization – Weight | ||
| Planned | Filter by total planned Weight amount of all Destinations on the planned route. | |
| Completed | Filter by total weight completed across all serviced destinations. | |
| Completed (%) | Filter by percentage of planned weight completed. | |
| Remaining At End (%) | Filter by percentage of planned weight still remaining at the route’s end. | |
| Utilization – Cube | ||
| Planned | Filter by total planned Cube (volume) amount of all Destinations on the planned route. | |
| Completed | Filter by total cubic volume completed across all serviced destinations. | |
| Completed (%) | Filter by percentage of the planned volume completed. | |
| Remaining At End (%) | Filter by percentage of planned volume remaining at the route’s end. | |
| Utilization – Revenue | ||
| Planned | Filter by total revenue to be generated from servicing all route Destinations. | |
| Completed | Filter by total revenue generated from the Destinations completed on the route. | |
| Completed (%) | Filter by percentage of planned revenue achieved. | |
| Remaining At End (%) | Filter by percentage of revenue still unfulfilled at route end. | |
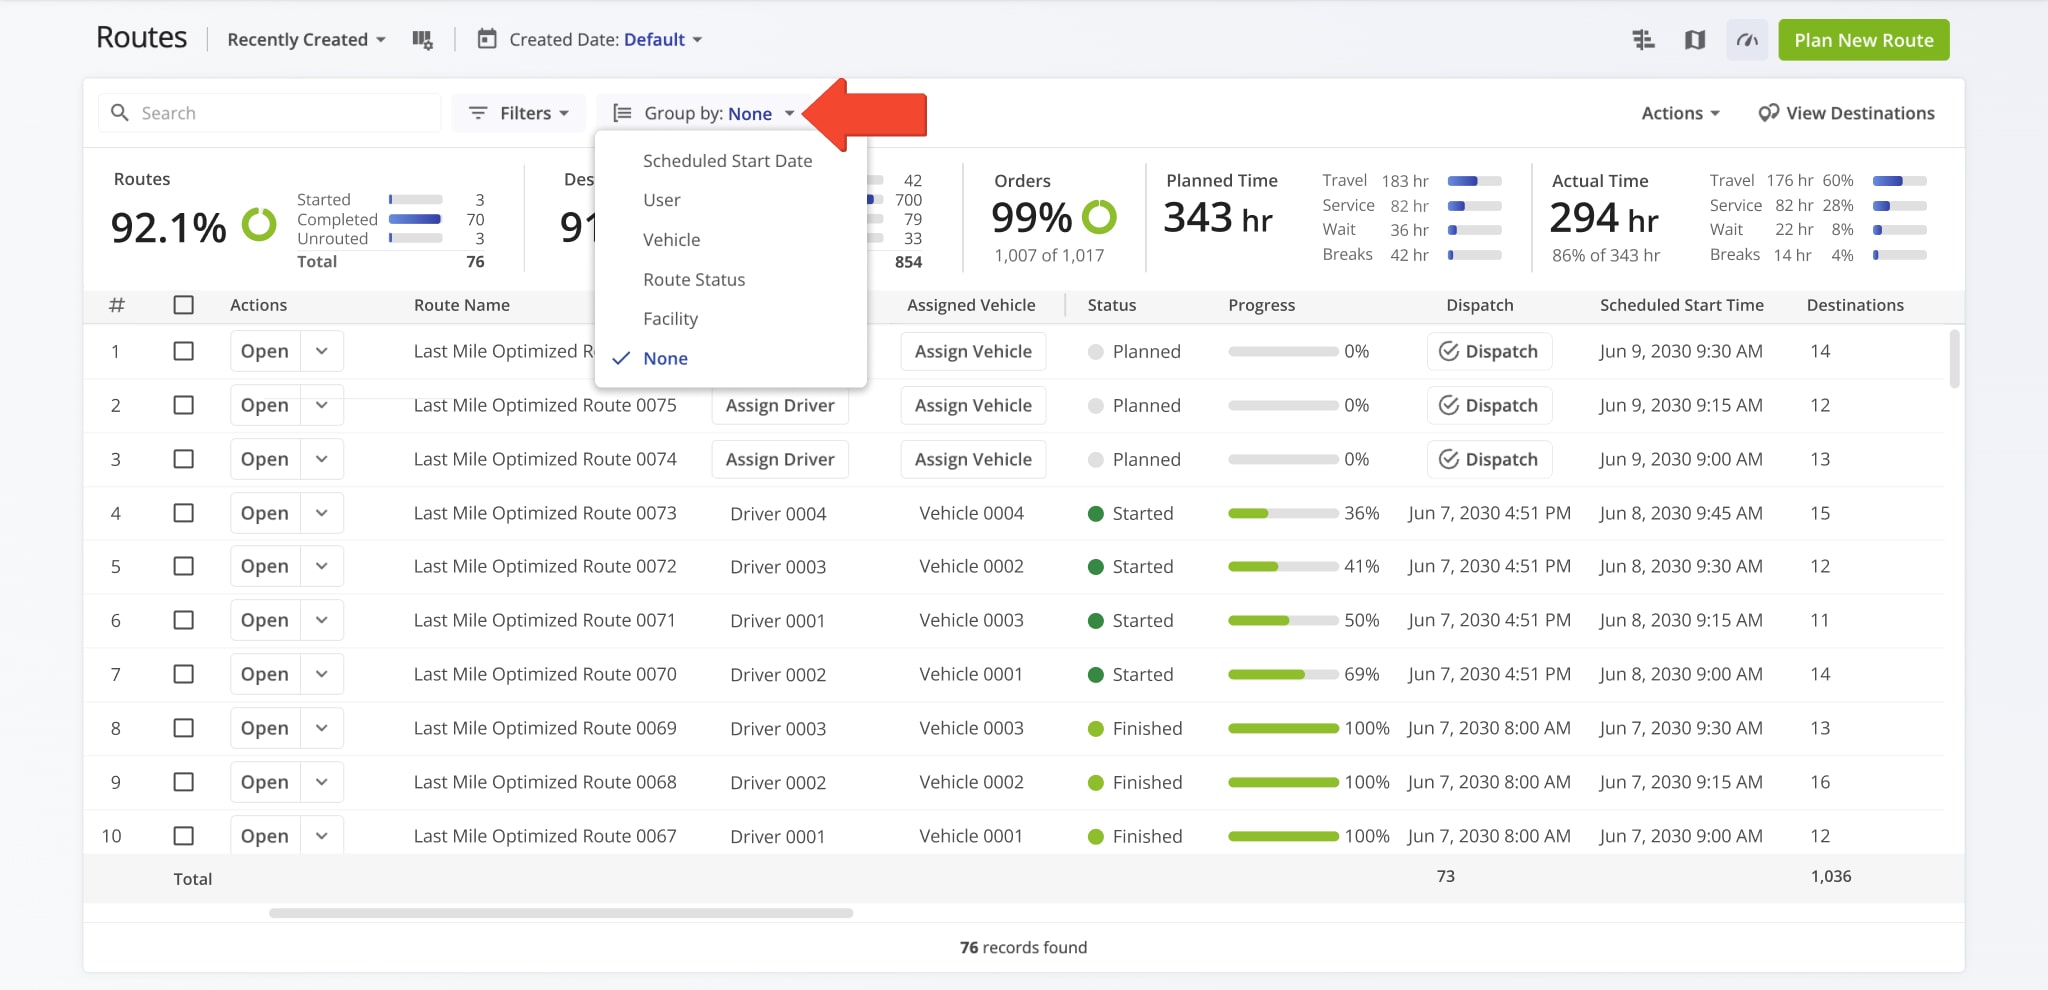
Routes Page Grouping Options
Grouping routes sorts the Routes Page by shared attributes, making it easier to review large numbers of routes, compare results, and manage operations at scale from a single view. Below is an overview of all Routes Page grouping options.
| Grouping | Description |
|---|---|
| Scheduled Start Date | Group routes based on their scheduled start date. |
| User | Group routes by user assigned to the route. |
| Vehicle | Group routes by vehicle assigned to the route. |
| Route Status | Group routes by their current progress or completion state (e.g., Planned, Scheduled, Started, Completed). |
| Facility | Group routes by facility linked to the route. |
| None | Remove grouping so that all routes are displayed individually. |
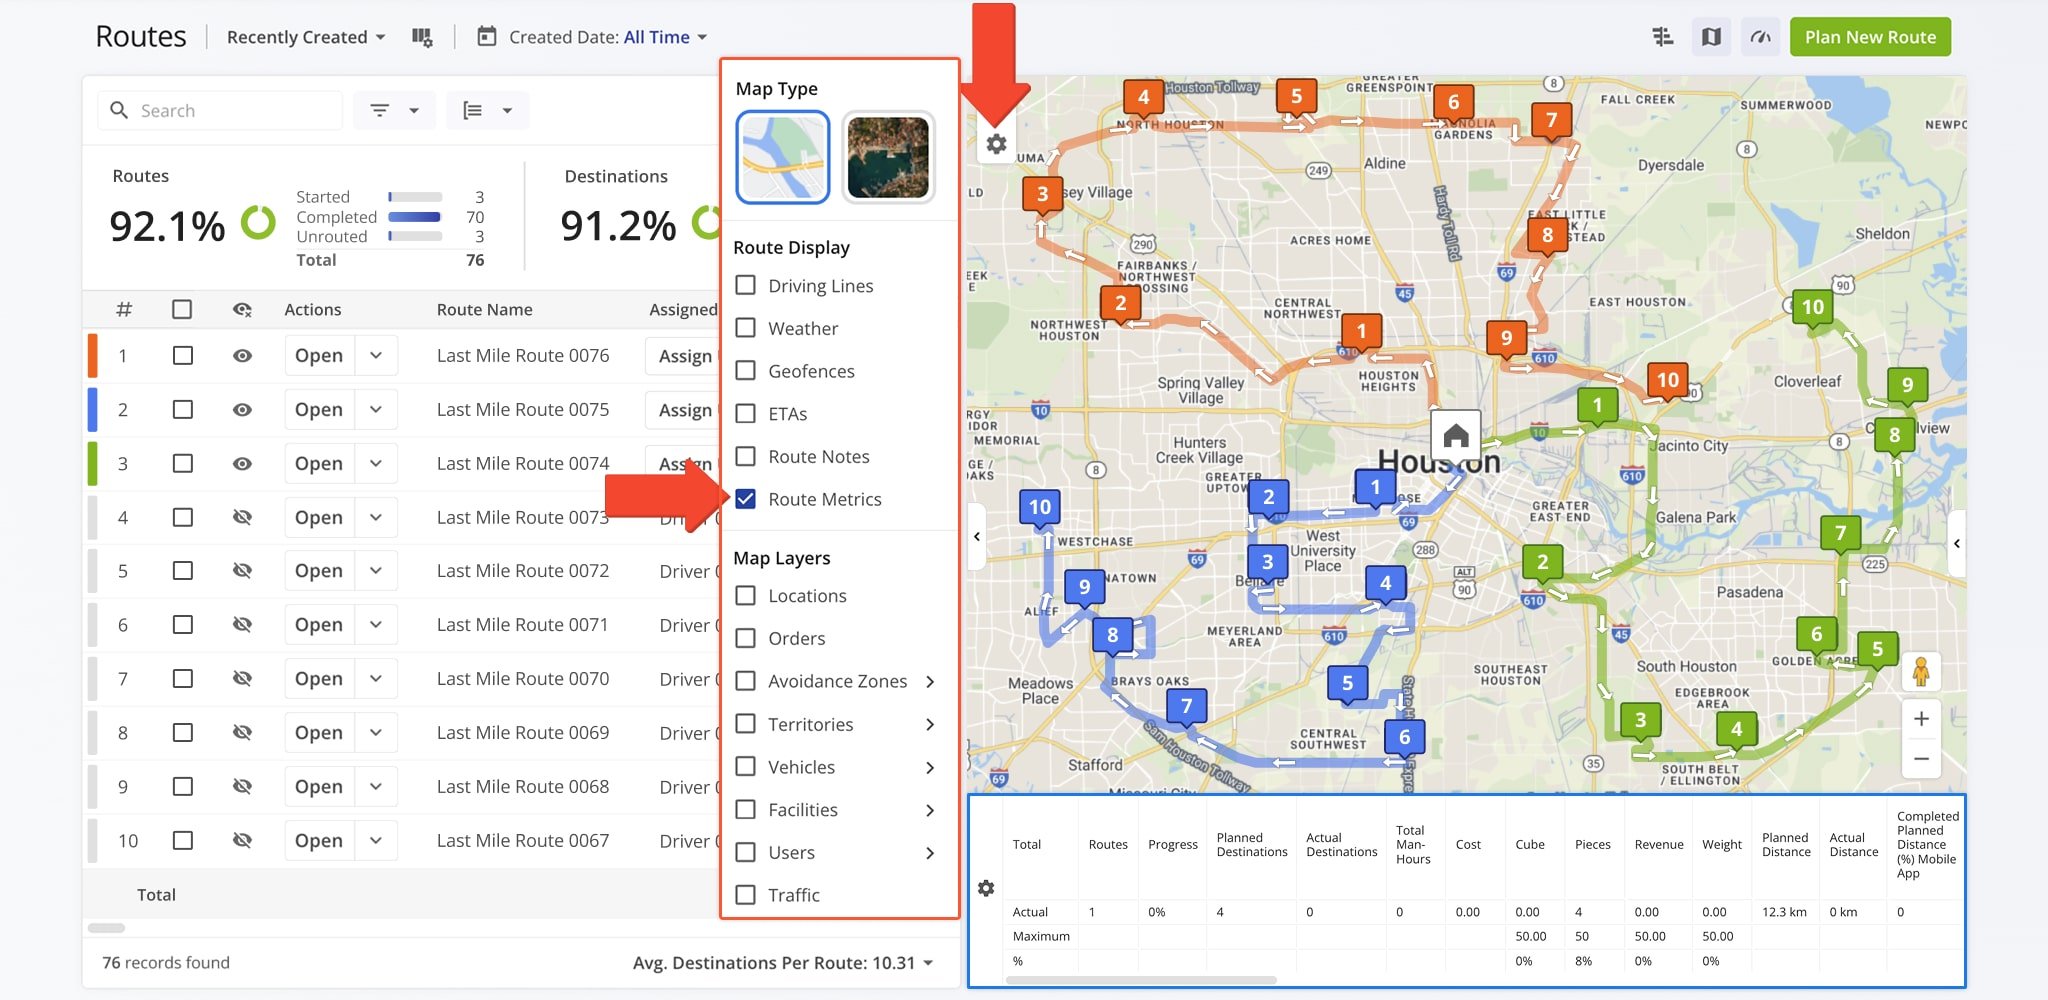
Routes Map – Route Metrics Display
Routes Map metrics provide a high-level overview of route performance, workload, and efficiency across selected routes. These metrics help you quickly evaluate progress, distance, time, and utilization without opening individual route details.
Below is an overview of all available Routes Map metrics.
| Metric | Description |
|---|---|
| Routes | The total number of routes included in the selected view. |
| Progress | The percentage of destinations completed across all selected routes. |
| Planned Destinations | The total number of destinations scheduled for the selected routes according to the original route plans. |
| Actual Destinations | The total number of destinations that were actually visited or completed during route execution. |
| Total Man-Hours | The combined time spent by all drivers or users on the selected routes, including travel and service time. |
| Cost | The total cost associated with completing the selected routes. |
| Cube | The total volume of goods to be delivered across the selected routes, measured in cubic units. |
| Pieces | The total number of individual items to be delivered across all stops on the selected routes. |
| Revenue | The total revenue associated with deliveries or services completed on the selected routes. |
| Weight | The total weight of goods to be delivered across all selected routes. |
| Planned Distance | The total distance planned for the selected routes based on their original route plans. |
| Actual Distance | The total distance actually traveled on the selected routes. |
| Completed Planned Distance (%) Mobile App | The percentage of planned distance completed, as tracked via the Mobile App. |
| Completed Planned Distance (%) Telematics | The percentage of planned distance completed, as tracked via telematics systems. |
| Completed Planned Distance (%) Mobile App + Telematics | The combined percentage of planned distance completed using Mobile App and telematics data. |
| Remaining Planned Distance (%) Mobile App | The percentage of planned distance remaining, as tracked via the Mobile App. |
| Remaining Planned Distance (%) Telematics | The percentage of planned distance remaining, as tracked via telematics systems. |
| Remaining Planned Distance (%) Mobile App + Telematics | The combined percentage of remaining planned distance using Mobile App and telematics data. |
| Deviated From Planned Distance (%) Mobile App | The percentage of distance traveled that deviated from the planned route, as tracked via the Mobile App. |
| Deviated From Planned Distance (%) Telematics | The percentage of distance traveled that deviated from the planned route, as tracked via telematics. |
| Deviated From Planned Distance (%) Mobile App + Telematics | The combined deviation from planned distance using Mobile App and telematics data. |
| Planned Total Duration | The total planned time required to complete the selected routes. |
| Actual Total Duration | The total actual time taken to complete the selected routes. |
| Planned Travel Duration | The amount of time planned for driving between destinations. |
| Actual Travel Duration | The amount of time actually spent driving between destinations. |
| Planned Service Duration | The amount of time planned for completing service at destinations. |
| Unattributed Duration | Time spent on the route that is not categorized as travel or service. |
| Actual Service Duration | The amount of time actually spent servicing destinations. |
| Time in Traffic | Time spent delayed due to traffic conditions. |
| Planned Wait Duration | The amount of time planned for waiting at destinations or between stops. |
| Actual Wait Duration | The amount of time actually spent waiting at destinations or between stops. |
| Stem In | Distance or time from the route start location to the first stop. |
| Stem Out | Distance or time from the last stop to the route end location. |
| Planned Break Duration | The amount of time planned for breaks. |
| Actual Break Duration | The amount of time actually taken for breaks. |
| Destinations / Distance Density | The number of destinations per unit of distance, indicating stop density along the route. |
| Destinations / Hour Density | The number of destinations visited per hour, showing operational efficiency. |
| Transactions / Hour Density | The number of transactions completed per hour, measuring delivery or service speed. |
| SPORH | Stops per operational route hour, showing efficiency relative to active route time. |
| TPORH | Total points or destinations per operational route hour. |
| Cubic / Destinations Density | The volume of goods per destination, indicating delivery size per stop. |
| Cubic / Distance Density | The volume of goods delivered per unit of distance traveled. |
| Pieces / Distance Density | The number of items delivered per unit of distance traveled. |
| Weight / Distance Density | The weight of goods delivered per unit of distance traveled. |
| Weight / Destinations Density | The average weight of goods delivered per destination. |
Visit Route4Me's Marketplace to Check out Associated Modules:
- Operations
Audit Logging and Activity Stream
- Operations
Custom Data Add-On
- Operations
Advanced Team Management Add-On
About author: Daniel Archer
With a background in pedagogy and writing instruction, Daniel is a former tenured English Instructor who, after nearly 20 years of teaching, transitioned into content strategy and leading writing teams for global brands. Now, as Technical Documentation Manager at Route4Me, he translates complex logistics technology into clear, accessible content that empowers users.