Location Snapshot – Customer Location Data And Analytics Overview
Route4Me’s Location Snapshot provides a clear, centralized view of all data associated with any saved Customer Location. It helps you review visits, routes, performance metrics, and operational details in one place so you can quickly analyze trends and make informed decisions. Learn how to open a Snapshot, navigate its data categories, and filter the information you need.
NOTE: The Location Snapshot feature is currently available only by request. To enable this feature, contact Customer Support.
Table of Contents
Open Location Snapshot – Location Data And Analytics Overview
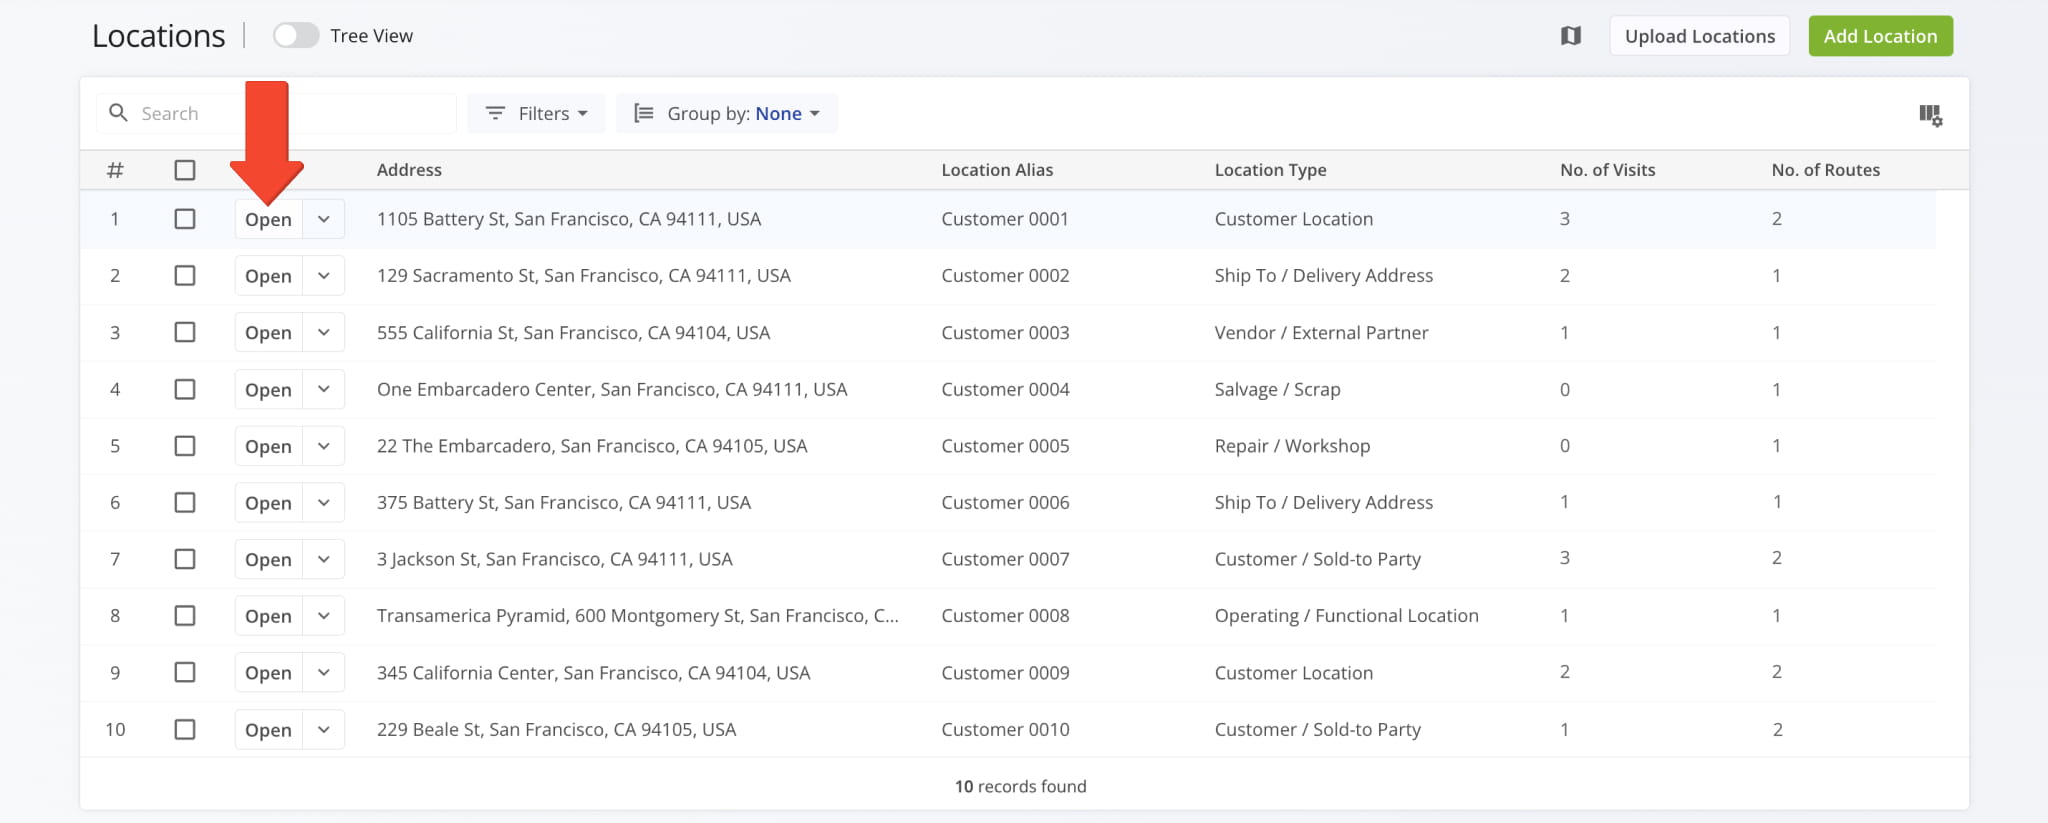
To open a Locations Snapshot, go to “Database” > “Locations” from the Navigation Menu. Then, from the Locations Page, click the “Open” button next to the desired Location.
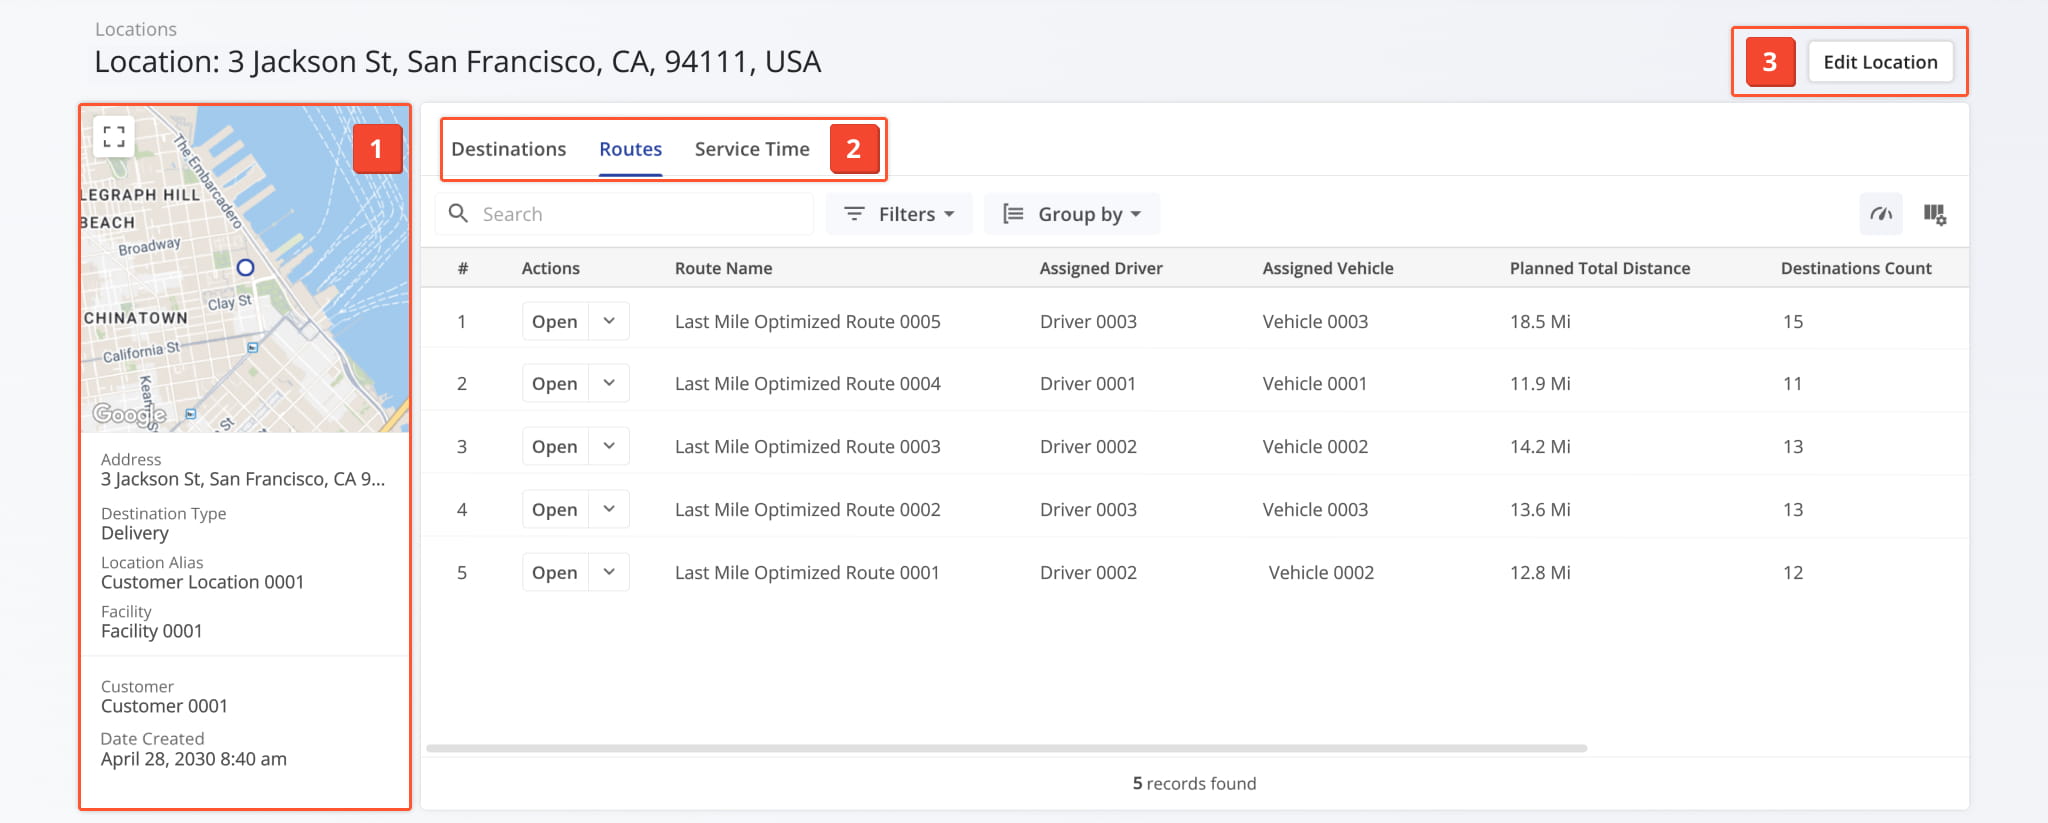
One the Snapshot is opened, you’ll see a detailed interface designed to help you review and manage all Location data:
- Location Summary: A quick overview of essential information including the address, destination type, creation date, and more.
- Location Tabs: Switch between “Destinations“, “Routes“, and “Service Time” to explore Location data.
- Edit Controls: Access the “Edit Location” button to modify Location details.
All data is centralized and accessible, making it easier to analyze Location information, spot trends, and plan accordingly.
Location Profile Overview – Map, Assignments, Performance Metrics
Dynamic Map And Location Information Panel
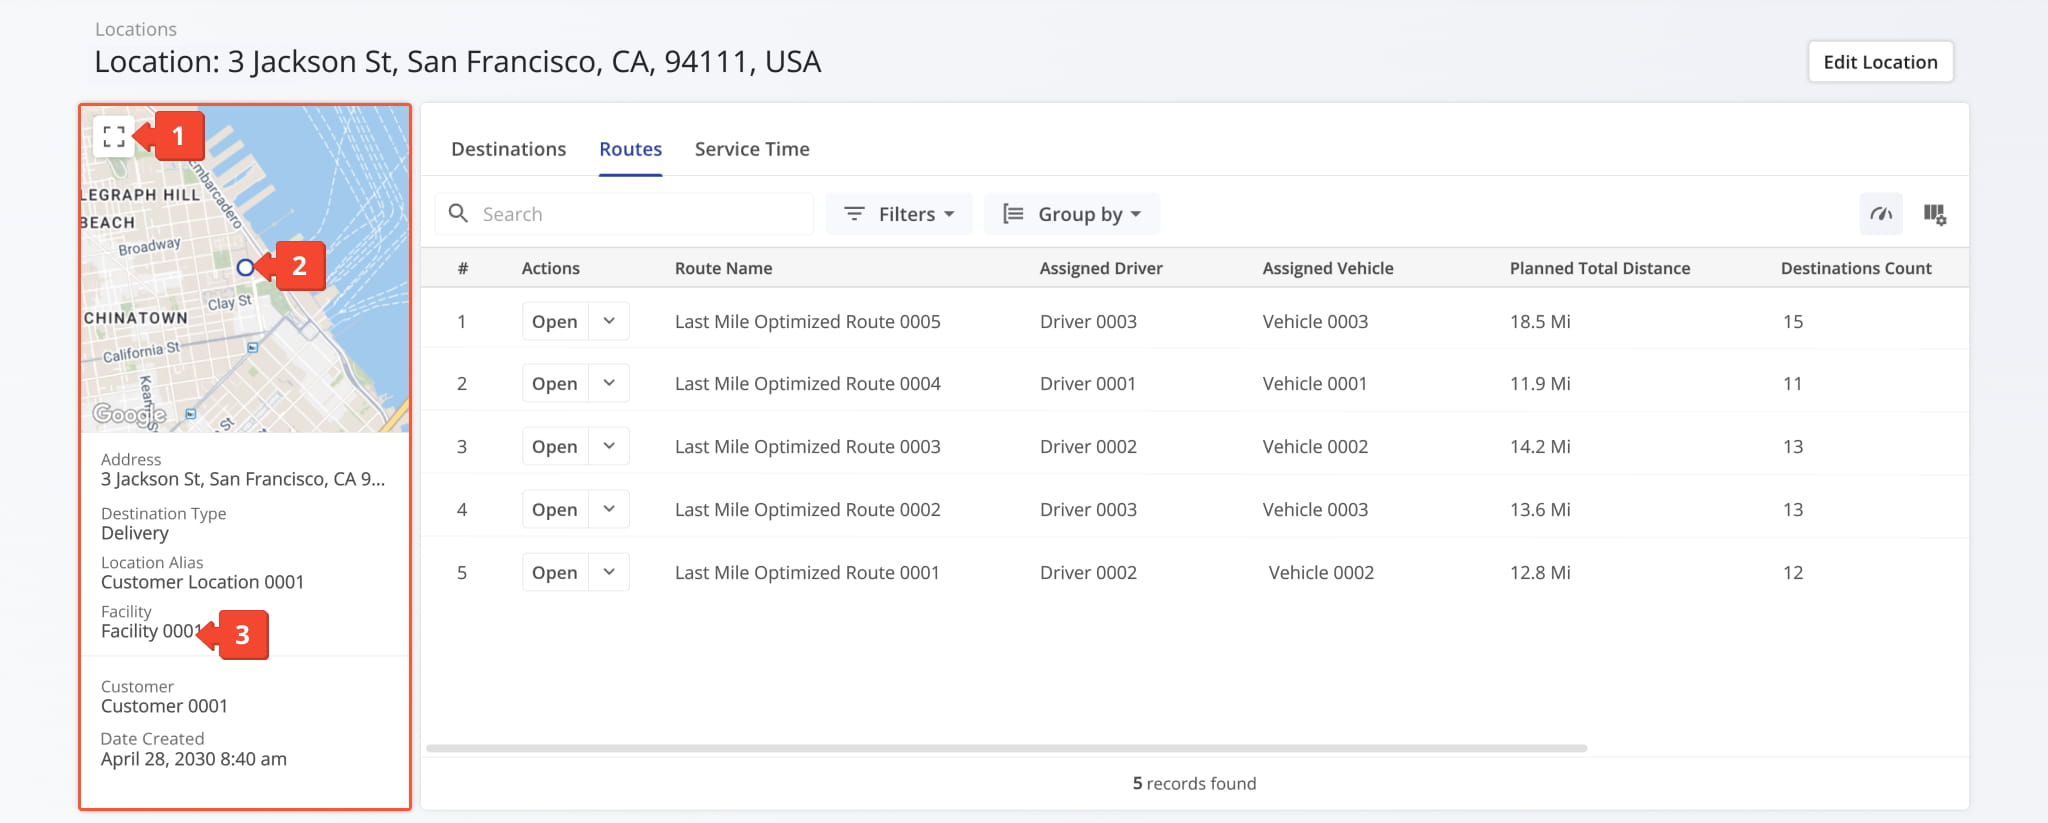
The Location Summary panel displays key details about the Location, including address, assigned Customer, and contact information, alongside a map of the Location’s position. From this panel, you can:
- Click the Frame Icon to expand the map to full-screen for a broader view.
- Click the Location dot on the map to view detailed information including its number of attached notes, number of visits, and more.
- Click “Assign Facility” to associate the Location with a last mile facility. NOTE: Locations can be assigned to multiple facilities.
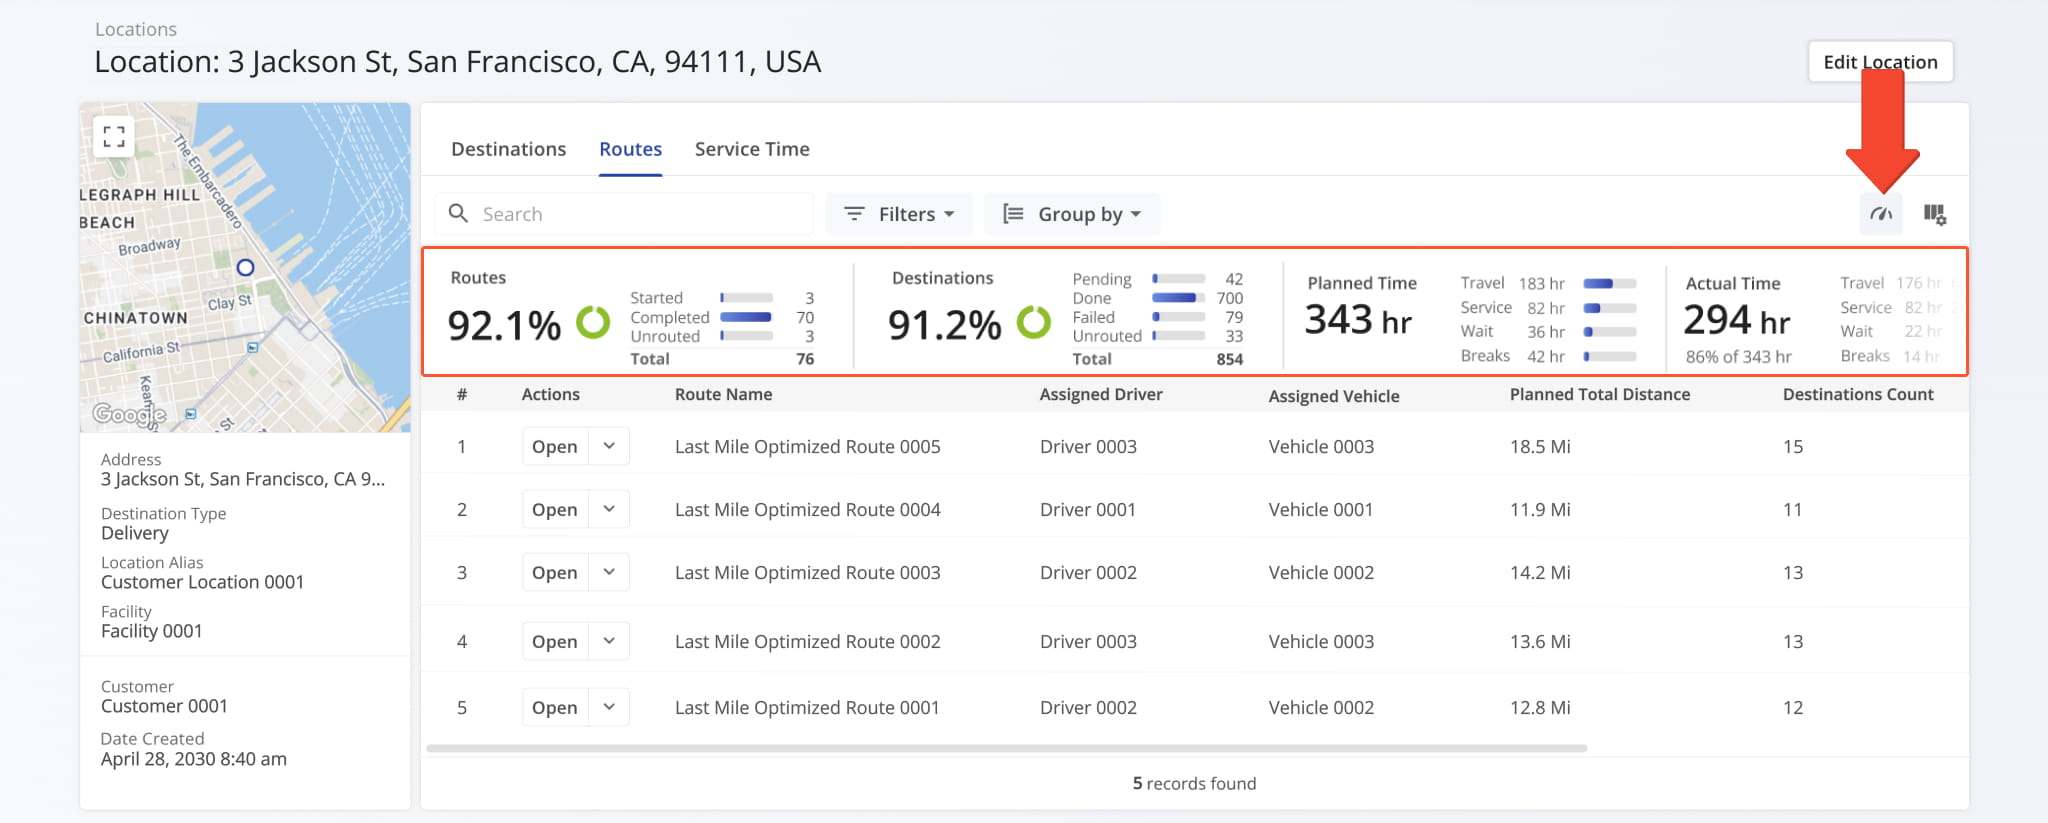
Route Performance Metrics Panel
Click the Metrics Icon in the upper-right corner to open the Location’s Performance Metrics panel, where you can monitor progress, track efficiency, and evaluate operational performance across routes.
This panel provides a summary of planned routes and destinations associated with the Location, along with a side-by-side breakdown of planned and actual time for travel, service, wait, and breaks.
Location Snapshot Categories – Analytics Overview Data Tabs
The User Snapshot is organized into multiple tabs, each corresponding to a specific category of associated data described below.
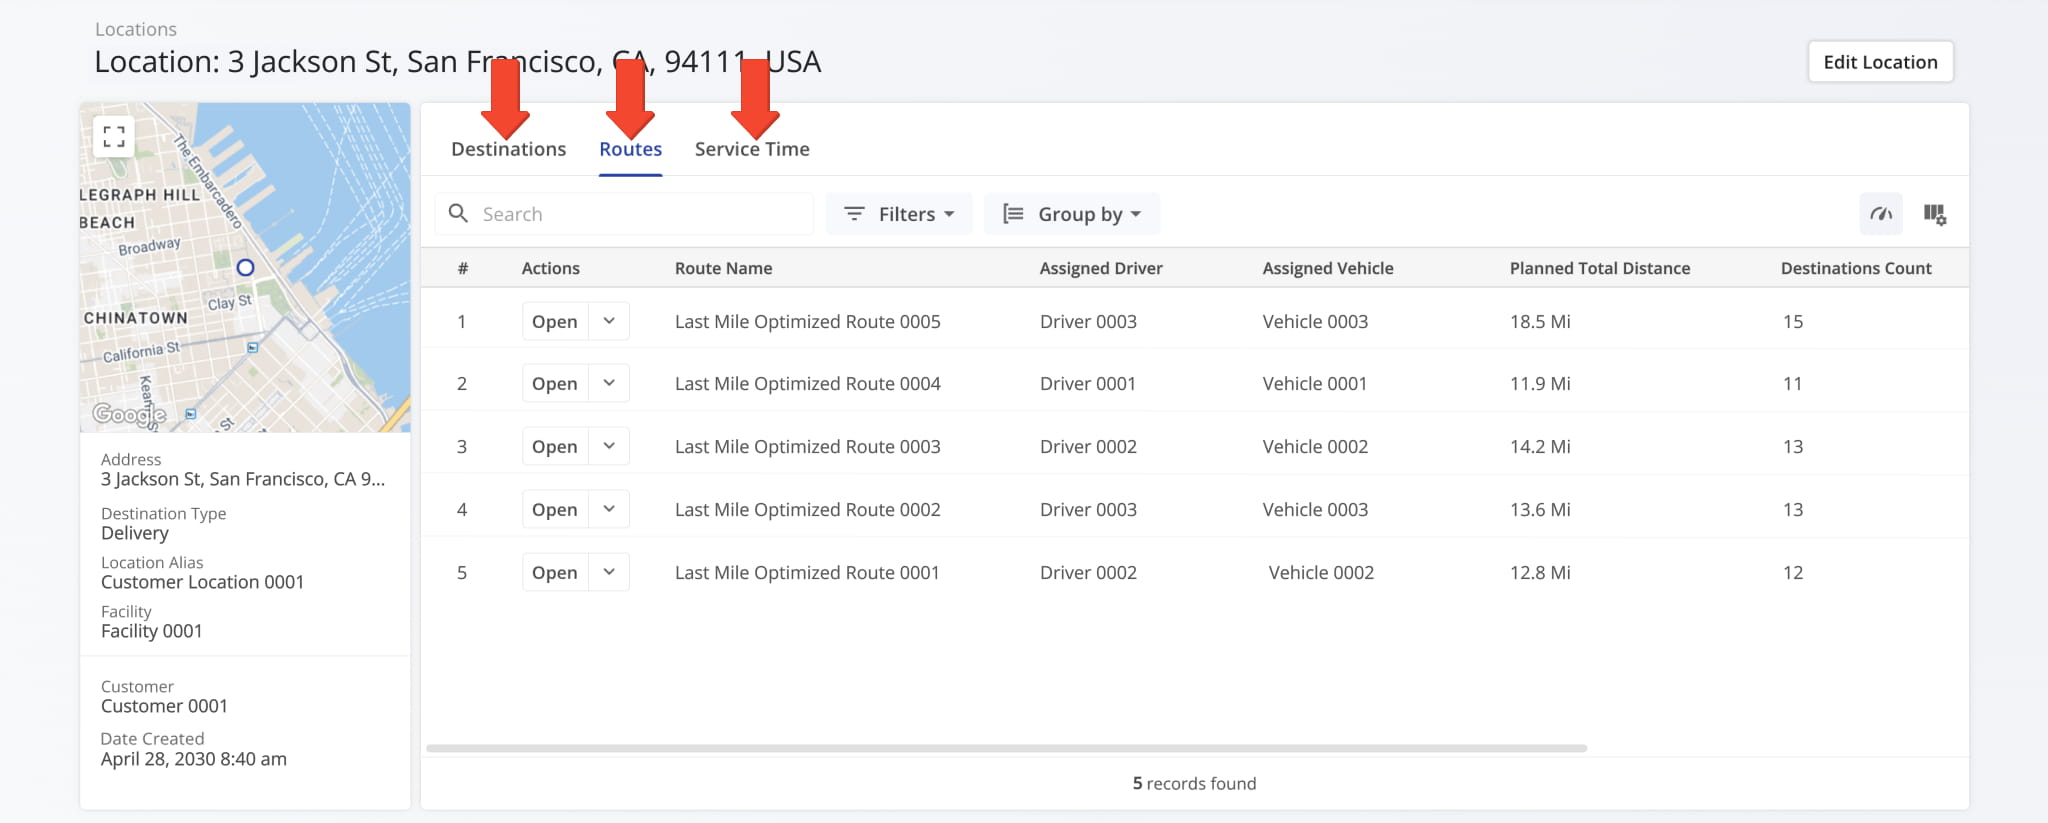
Routes Tab – Assigned Routes And Route Data Overview
By default, the Routes tab opens when you access a Location Snapshot, displaying all routes linked to the Location in a customizable table. From this tab, you can:
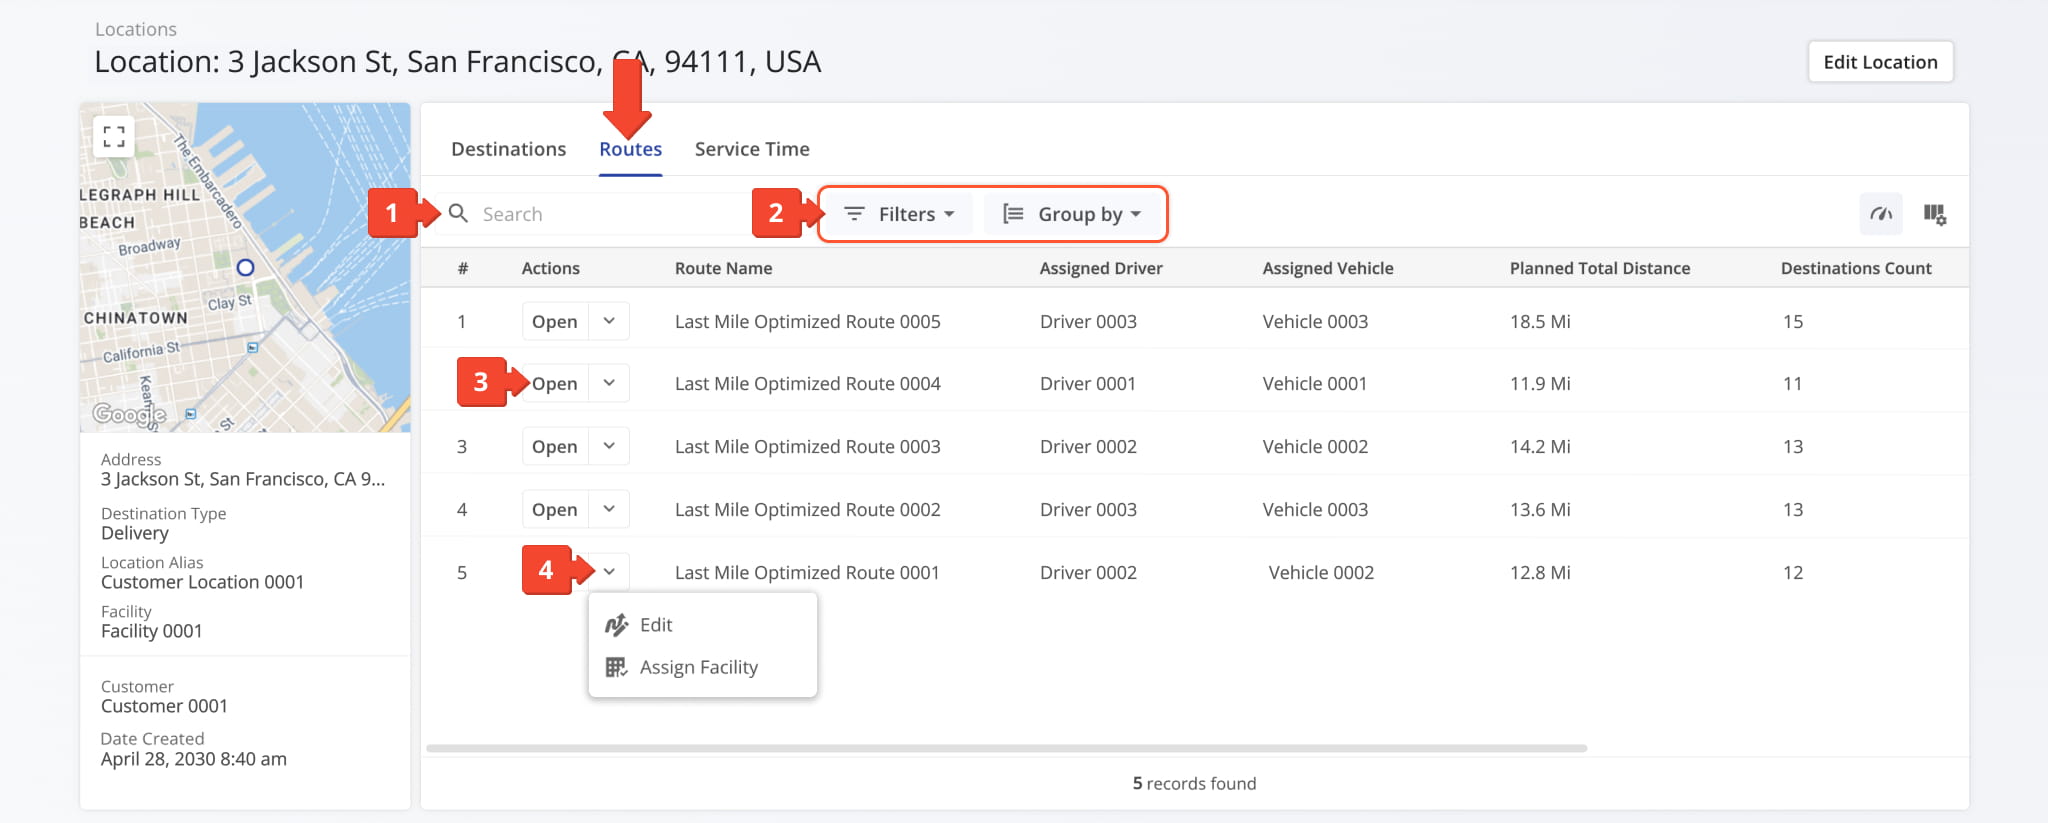
- Use the Search field to locate routes associated with the Location.
- Narrow down Routes with filters, as described in the table below, or with Group By options.
- Click “Open” next to a route to access its Route Snapshot.
- Click the Down Arrow button to modify the route in the Route Editor or assign the route to a facility.
| Filter | Description | |
|---|---|---|
| Assignment & Attribution | ||
| User | Filter by user assigned to the route. | |
| Vehicle | Filter by vehicle assigned to the route. | |
| Facility | Filter by facility linked to the route. | |
| Customer | Filter by customer linked to the route. | |
| Contract | Filter by contract linked to the route. | |
| Strategic Optimization | ||
| Strategic Optimization Name | Filter by the name of the strategic optimization used to generate or modify the route. | |
| Scenario Name | Filter by the scenario applied during strategic route planning. | |
| Route | ||
| Status | Filter by the current progress or completion state of the route (e.g., Planned, Scheduled, Started, Completed). | |
| Planned Total Route Duration (h) | Filter by the total estimated duration, in hours, planned for completing the route. | |
| Planned Total Distance (mi) | Filter by the total planned distance, in miles, for completing all stops on the route. | |
| Progress Metrics | ||
| Destinations Arrived (Progress %) (User Actioned) | Filter by the percentage of planned destinations the driver has arrived at. | |
| Key Metrics | ||
| Destinations Count | Filter by the total number of destinations assigned to the route. | |
| Pending Destinations | Filter by destinations not yet started or completed by the driver. | |
| Failed Destinations | Filter by destinations marked as failed due to inability to complete service. | |
| Skipped Destinations | Filter by destinations the driver intentionally skipped or bypassed. | |
| Completed Destinations | Filter by destinations successfully completed on the route. | |
| Notes Count | Filter by number of notes added to the route by users or automated processes. | |
| Customer Requested Time Window Adherence | ||
| Destinations Arrived Late (User Actioned) | Filter by destinations where the driver arrived after the scheduled time window. | |
| Destinations Arrived Early (User Actioned) | Filter by destinations where the driver arrived earlier than the scheduled time window. | |
| Destinations Arrived On Time (User Actioned) | Filter by destinations where the driver arrived within the scheduled time window. | |
| SLA | ||
| Out of Sequence Destinations (#) | The number of destinations visited in an order different from the planned sequence. | |
| Actual Route Distance | ||
| Actual Total Distance (Mobile App) (mi) | Total distance in miles recorded by the mobile app during the route. | |
| Actual Total Distance (Telematics) | Total distance in miles recorded from the assigned vehicle’s telematics device. | |
| Utilization – Pieces/Units | ||
| Planned | Filter by total planned Pieces (units) amount of all Destinations on the planned route. | |
| Completed | Filter by total number of completed pieces or units. | |
| Completed (%) | Filter by percentage of pieces or units completed. | |
| Remaining At End (%) | Filter by percentage of pieces or units still remaining when the route ended. | |
| Utilization – Weight | ||
| Planned | Filter by total planned Weight amount of all Destinations on the planned route. | |
| Completed | Filter by total weight completed across all serviced destinations. | |
| Completed (%) | Filter by percentage of planned weight completed. | |
| Remaining At End (%) | Filter by percentage of planned weight still remaining at the route’s end. | |
| Utilization – Cube | ||
| Planned | Filter by total planned Cube (volume) amount of all Destinations on the planned route. | |
| Completed | Filter by total cubic volume completed across all serviced destinations. | |
| Completed (%) | Filter by percentage of the planned volume completed. | |
| Remaining At End (%) | Filter by percentage of planned volume remaining at the route’s end. | |
| Utilization – Revenue | ||
| Planned | Filter by total revenue to be generated from servicing all route Destinations. | |
| Completed | Filter by total revenue generated from the Destinations completed on the route. | |
| Completed (%) | Filter by percentage of planned revenue achieved. | |
| Remaining At End (%) | Filter by percentage of revenue still unfulfilled at route end. | |
| Address Book Details | ||
| Address Book Details | Filter by Route4Me Address Book contact aliases, addresses, order details, or customer details. | |
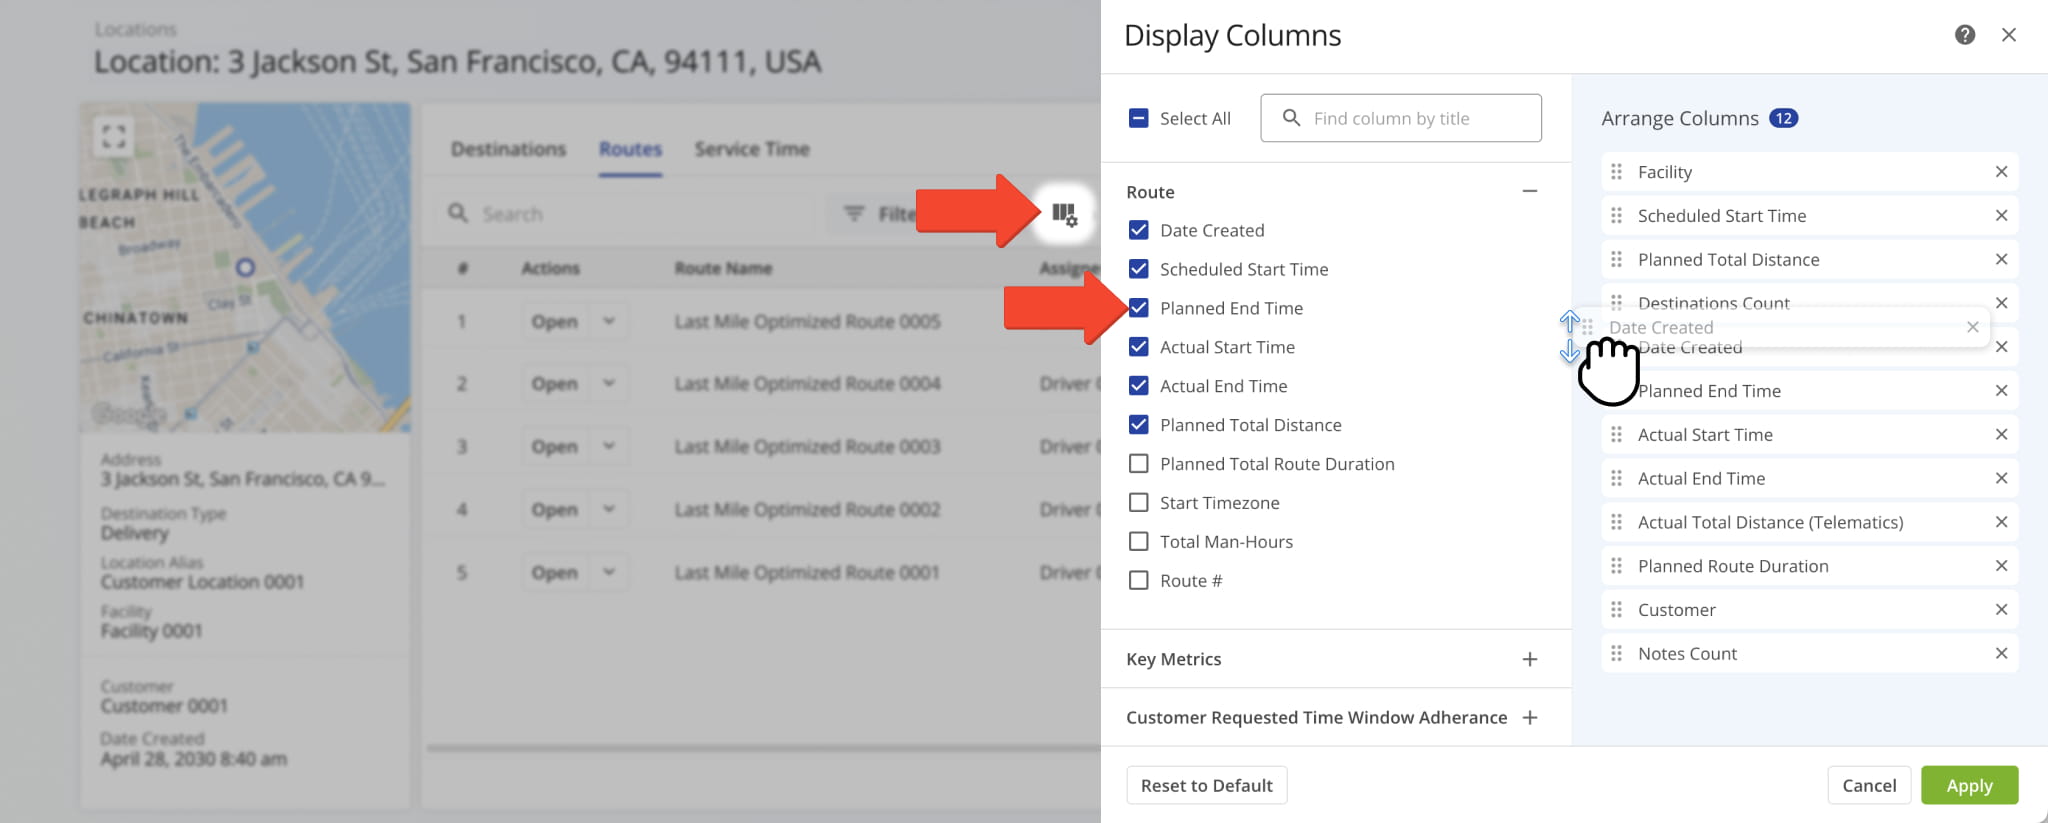
You can also customize the data displayed in the table. Click the Column Icon in the upper right corner to select which route data fields appear and adjust their order to suit your operational needs.
The table below provides an overview of all available data columns, which you can reorder by dragging them into place.
| Column | Description | |
|---|---|---|
| Route | ||
| Date Created | Date and time when the route was created. | |
| Scheduled Start Time | Scheduled start time for the route. | |
| Planned End Time | Planned end time for the route. | |
| Actual Start Time | Time when the route actually started. | |
| Actual End Time | Time when the route was completed. | |
| Planned Total Distance | Total distance planned for the route, representing the full mileage that drivers are expected to cover from start to finish, including all stops and detours along the route. | |
| Planned Total Duration | Estimated total duration for completing the route. | |
| Start Timezone | Timezone of the route’s start location. | |
| Key Metrics | ||
| Destinations Count | Total number of destinations planned for the route. | |
| Pending Destinations | Number of destinations not yet visited. | |
| Failed Destinations | Number of destinations that could not be completed. | |
| Skipped Destinations | Number of destinations intentionally skipped. | |
| Completed Destinations | Number of destinations successfully completed. | |
| Customer Requested Time Window Adherence | Tracks whether the driver or field team met the specific time windows requested by customers, providing insight into scheduling accuracy and service reliability. | |
| Destinations Arrived On-Time (User Actioned) | Destinations where arrival matched the scheduled time, based on user input. | |
| Destinations Arrived Early (User Actioned) | Destinations reached earlier than scheduled, based on user input. | |
| Destinations Arrived Late (User Actioned) | Destinations reached later than scheduled, based on user input. | |
| Operational Status | ||
| First Access Time | Date and time the route was first viewed by a user. | |
| Status | Current progress or completion status of the route. | |
| Dispatch | Indicates whether the route has been assigned to a driver or team. | |
| Progress Metrics | ||
| Arrived Destinations (User Actioned) | Number of destinations marked as arrived by user actions. | |
| Destinations Arrived (Progress %) (User Actioned) | Percentage of destinations completed, based on user input. | |
| Actual Route Distance | ||
| Actual Total Distance (Mobile App) | Total distance traveled, recorded by the mobile app. | |
| Actual Total Distance (Telematics) | Total distance traveled, recorded by telematics. | |
| Actual Total Distance (Merged) | Combined distance from mobile app and telematics data. | |
| Actual Duration | ||
| Actual Route Duration (User Actioned) | Total route duration as recorded based on user actions. | |
| Actual Total Route Duration | Grand total of all route sub-durations. | |
| Actual Total Travel Duration (User Actioned) | Total driving time recorded by user actions. | |
| Actual Total Service Duration (User Actioned) | Total service time at destinations recorded by user actions. | |
| Actual Total Wait Duration (User Actioned) | Total wait time recorded during the route. | |
| Actual Total Breaks Duration (User Actioned) | Total break time taken by drivers during the route. | |
| Actual Total Unattributed Duration (User Actioned) | Time not attributed to driving, service, or breaks. | |
| Actual Service Time | ||
| Actual Total Service Time (Auto Detected) | Service time automatically recorded by system. | |
| Actual Travel Duration | ||
| Actual Total Duration (Mobile App) | Total duration of route recorded via the mobile app. | |
| Actual Total Duration (Telematics) | Total duration of route recorded via telematics. | |
| Planned Durations | ||
| Planned Route Duration | Estimated total route duration. | |
| Planned Total Travel Duration | Estimated driving time for the route. | |
| Planned Total Wait Duration | Estimated total wait time during the route. | |
| Planned Total Service Duration | Estimated total service time at destinations. | |
| Planned Total Break Duration | Estimated total driver break time. | |
| SLA | ||
| Out of Sequence Destinations (#) | Number of destinations visited out of planned order. | |
| Out of Sequence Destinations (%) | Percentage of destinations visited out of order. | |
| Assignment & Attribution | ||
| Facility | Location or service point assigned to the route. | |
| Utilization – Pieces / Units | ||
| Pieces Planned | Total number of pieces planned for delivery. | |
| Pieces Completed | Number of pieces successfully delivered. | |
| Pieces Completed (%) | Percentage of planned pieces delivered. | |
| Pieces Remaining At End (%) | Percentage of pieces undelivered at the route’s end. | |
| Utilization – Weight | ||
| Weight Planned | Total weight of items planned for delivery. | |
| Weight Completed | Weight of items successfully delivered. | |
| Weight Completed (%) | Percentage of planned weight delivered. | |
| Weight Remaining At End (%) | Percentage of weight remaining at the end of the route. | |
| Utilization – Cube | ||
| Cube Planned | Total cubic volume planned for delivery. | |
| Cube Completed | Cubic volume successfully delivered. | |
| Cube Completed (%) | Percentage of planned cubic volume delivered. | |
| Cube Remaining At End (%) | Percentage of cubic volume remaining at the end of the route. | |
| Utilization – Revenue | ||
| Revenue Planned | Planned revenue for the route based on scheduled deliveries. | |
| Revenue Completed | Revenue earned from completed deliveries. | |
| Revenue Completed (%) | Percentage of planned revenue achieved. | |
| Revenue Remaining At End (%) | Percentage of planned revenue remaining at the route’s end. | |
| Note Custom Fields Sum | ||
| Sum Decimals | Sum of decimal-type custom fields for the route. | |
| Sum Whole Numbers | Sum of whole number-type custom fields for the route. | |
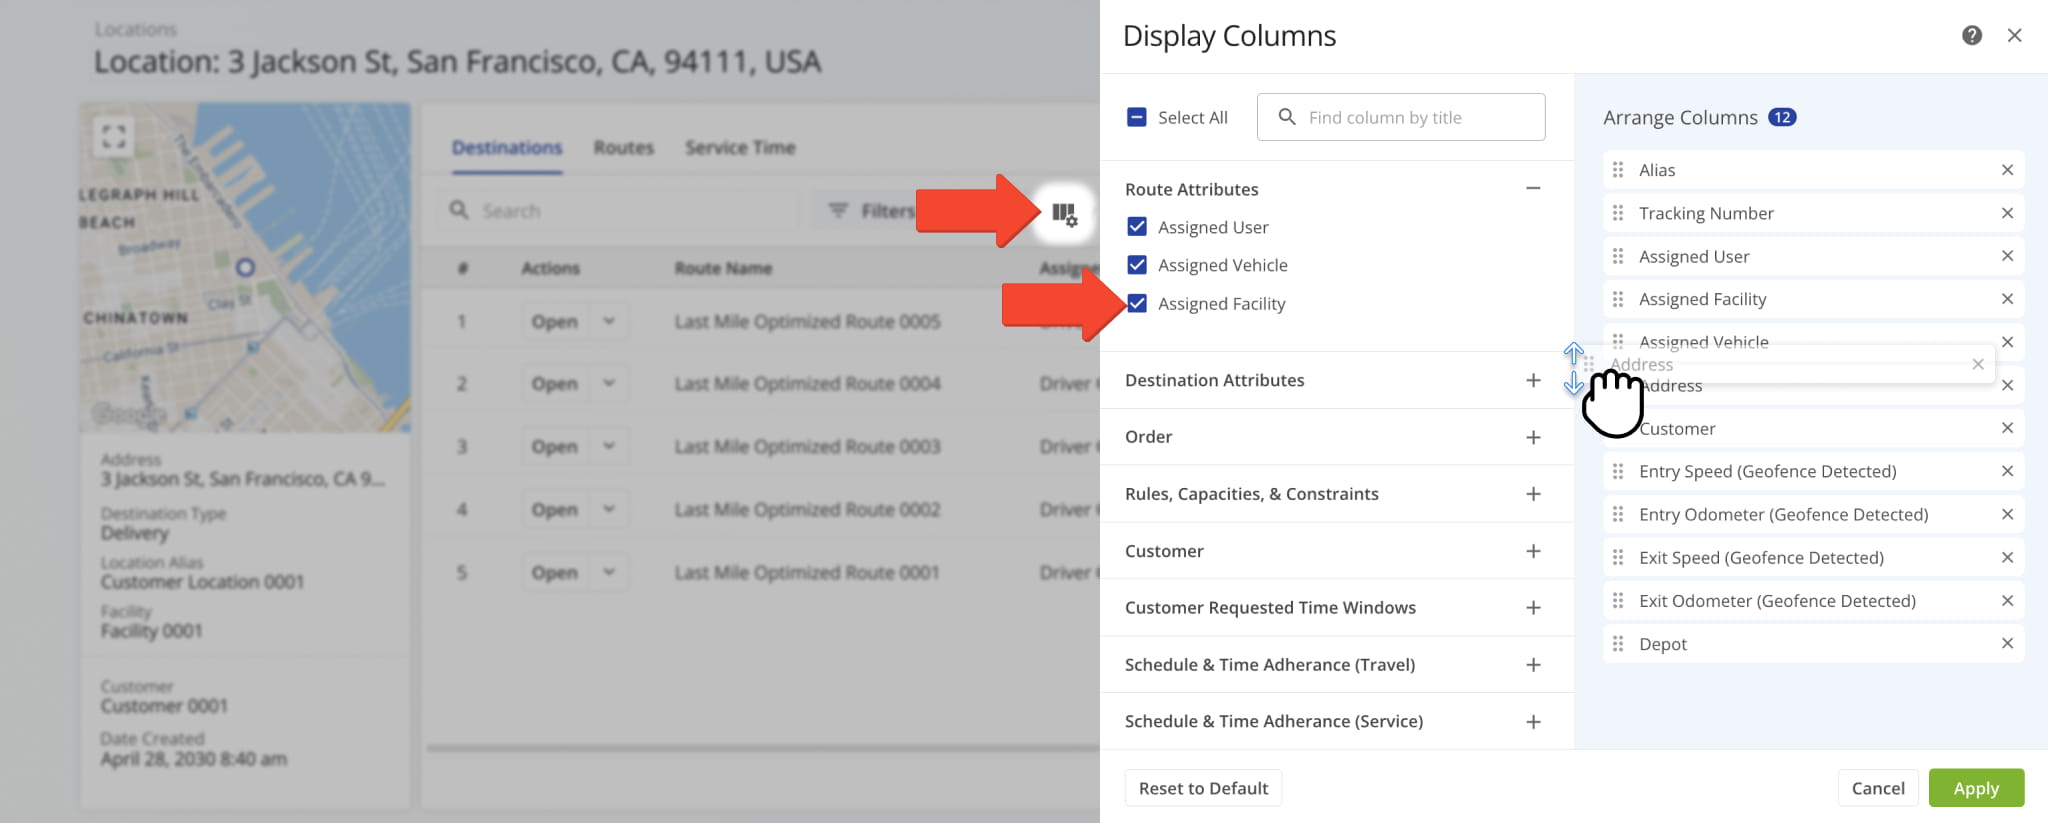
Destinations Tab – Assigned Destinations And Data Overview
When the Destinations tab is open, you can view all destinations associated with the selected Location in a customizable data table. From this tab, you can:
- Use the Search field to locate destinations associated with the Location.
- Narrow down destinations with filters, as described in the table below, or with Group By options.
- Click “Open” next to a route to access its Destination Snapshot.
- Click the Down Arrow and select “Open Route” to access its Route Snapshot or “Edit Route” to modify the route in the Route Editor.

| Column | Description | |
|---|---|---|
| Route Attributes | ||
| Route Name | Name of the route associated with the destination. | |
| Assigned User | Driver or field team member assigned to the route. | |
| Assigned Vehicle | Vehicle assigned to the route. | |
| Assigned Facility | Facility associated with the route. | |
| Destination Attributes | ||
| Depot | Starting point or base location for the route. | |
| Destinations Sequence # | Order in which the destination is scheduled on the route. | |
| Address | Physical address of the destination. | |
| Alias | Custom name or label for the destination address. | |
| Service Type | Type of service at the destination (e.g., delivery, pickup). | |
| Destination Status | Current status of the destination (e.g., completed, pending, failed). | |
| Timezone | Timezone of the destination location. | |
| Order | ||
| Order ID | Unique identifier for the order. | |
| Tracking Number | Identifier used to track the shipment. | |
| Order Number | Order reference number for tracking purposes. | |
| Invoice Number | Invoice number associated with the order. | |
| Reference Number | Additional unique reference for the order or transaction. | |
| Rules, Capacities, & Constraints | ||
| Priority | Priority level assigned to the destination for scheduling. | |
| Cube | Volume of items for delivery at the destination. | |
| Pieces | Number of individual items or packages for delivery. | |
| Weight | Total weight of items for delivery. | |
| Revenue | Revenue associated with the destination or delivery. | |
| Customer | ||
| First Name | Customer’s first name. | |
| Last Name | Customer’s last name. | |
| Customer’s email address. | ||
| Phone | Customer’s phone number. | |
| Customer PO | Customer purchase order associated with the destination. | |
| Group | Customer group or category. | |
| Customer Requested Time Windows | ||
| Time Window 1 | First scheduled time window for delivery or service. | |
| Time Window 2 | Second scheduled time window, if applicable. | |
| Schedule & Time Adherence (Travel) | ||
| Actual Arrival Time (User Actioned) | Time the destination was arrived at, recorded by the user. | |
| Actual Departure Time (User Actioned) | Time the destination was departed from, recorded by the user. | |
| Schedule & Time Adherence (Service) | ||
| Planned Service Time | Estimated service time for the destination. | |
| Actual Service Time (User Actioned) | Total time spent providing service at the destination, including all tasks such as deliveries, pickups, or other actions, as recorded manually or confirmed by the user. | |
| Geofence Detections | ||
| Actual Service Time (Geofence Detected) | Service time recorded automatically via geofence. | |
| Actual Arrival Time (Geofence Detected) | Arrival time recorded automatically via geofence. | |
| Actual Departure Time (Geofence Detected) | Departure time recorded automatically via geofence. | |
| Arrival and Departure Status | ||
| Arrived | Indicates whether the destination has been visited. | |
| Departed | Indicates whether the vehicle or driver has left the destination. | |
| Arrival and Departure Time | ||
| Planned Arrival Time | Scheduled arrival time at the destination. | |
| Planned Departure Time | Scheduled departure time from the destination. | |
| Actual Arrival Time (User Actioned) | Actual arrival time recorded by the user. | |
| Actual Departure Time (User Actioned) | Actual departure time recorded by the user. | |
| Dynamic Arrival Time | Predicted time of arrival at the destination based on live route data and current traffic conditions, helping to manage expectations and improve operational planning. | |
| Dynamic Departure Time | Estimated departure time based on real-time route updates. | |
| Arrival/Departure Schedule Deviation | ||
| Time Window Violated (User Actioned) | Indicates if the destination was serviced outside its requested time window. | |
| Arrival Time Variance (-Early,+Late) (User Actioned) | Difference between actual and scheduled arrival time in seconds. | |
| Departure Time Variance (-Early,+Late) (User Actioned) | Difference between actual and scheduled departure time in seconds. | |
| Planned Remaining Capacity | ||
| Planned Remaining Cube | Volume remaining to be delivered at the destination. | |
| Planned Remaining Pieces | Number of items remaining for delivery. | |
| Planned Remaining Revenue | Revenue remaining to be collected from the delivery. | |
| Planned Remaining Weight | Weight of goods remaining for delivery. | |
You can also customize the data displayed in the table. Click the Column Icon in the upper right corner to select which data fields appear and adjust their order to suit your operational needs.
The table below provides an overview of all available data columns, which you can reorder by dragging them into place.
| Data | Description | |
|---|---|---|
| Route Attributes | ||
| Assigned User | The user responsible for the route, typically the driver or team completing it. | |
| Assigned Vehicle | The vehicle assigned to the route for tracking and capacity purposes. | |
| Assigned Facility | The facility associated with the route, usually serving as the start or end location. | |
| Destination Attributes | ||
| Depot | The starting location or home base for the route. | |
| Destination Sequence # | The planned order of this destination within the route, indicating the sequence the driver should follow. | |
| Address | The full street address of the destination for delivery or service. | |
| Alias | A custom name or shorthand identifier for the destination to simplify identification. | |
| Service Type | The type of service or delivery expected at the destination, e.g., pickup, drop-off, or service call. | |
| Status | The current status of the destination (e.g., pending, in progress, completed, failed). | |
| Timezone | The time zone of the destination, used for accurate scheduling of arrivals and departures. | |
| Distance to Next Destination | The driving distance from this destination to the next stop on the route. | |
| Drive Time to Next Destination | The estimated travel time from this destination to the next stop, based on planned routing. | |
| Man-Hours | Employee working hours required for completing the destination visit. | |
| Order | ||
| Order ID | Unique identifier for the order in the system. | |
| Tracking Number | The shipping or tracking number associated with the order for logistics purposes. | |
| Order Number | Reference number assigned to the order by the system or customer. | |
| Invoice Number | The invoice number linked to the order. | |
| Reference Number | Additional reference or internal tracking number associated with the order. | |
| Notes Count | Total number of notes added to a destination by users or automated processes. | |
| Customer Billing Type | The billing classification applied to the customer associated with the destination. | |
| Rules, Capacities, & Constraints | ||
| Priority | The priority level of the order or destination, which may affect route sequencing. | |
| Cube | The volume of items for the destination, used for vehicle load planning. | |
| Pieces / Units | The total quantity of items or units for delivery or service at the destination. | |
| Weight | The total weight of items for the destination, used for vehicle capacity planning. | |
| Revenue | The expected revenue associated with completing the order at the destination. | |
| Cost | The cost value associated with completing the order at the destination. | |
| Customer | ||
| Customer | The name of the customer receiving the service or delivery. | |
| First Name | Customer’s first name for identification and communication purposes. | |
| Last Name | Customer’s last name for identification and communication purposes. | |
| Customer’s email address, used for notifications or tracking updates. | ||
| Phone | Customer’s phone number, used for notifications or communication. | |
| Customer PO | The customer’s purchase order number associated with the order. | |
| Group | A classification or grouping of the customer, often used for reporting or filtering. | |
| Customer Requested Time Windows | ||
| Time Window 1 | The first requested time window for service at the destination. | |
| Time Window 2 | The second requested time window for service, if applicable. | |
| Schedule & Time Adherence (Travel) | ||
| Actual Arrival Time (User Actioned) | The arrival time recorded manually by the user. “User Actioned” means it was entered or confirmed by a person rather than automatically detected. | |
| Actual Departure Time (User Actioned) | The departure time recorded manually by the user. | |
| Schedule & Time Adherence (Service) | ||
| Planned Service Time | The expected duration of service at the destination based on planning. | |
| Actual Service Time (User Actioned) | The service duration recorded manually by the user, reflecting the real-world time spent completing the service or delivery. | |
| Geofence Detections | ||
| Actual Service Time (Geofence Detected) | The service duration automatically recorded when the user is within the destination geofence. | |
| Actual Arrival Time (Geofence Detected) | The arrival time automatically detected when the vehicle enters the geofence. | |
| Actual Departure Time (Geofence Detected) | The departure time automatically detected when the vehicle exits the geofence. | |
| Entry Speed (Geofence Detected) | Vehicle speed upon entering the geofence, useful for safety and compliance tracking. | |
| Entry Odometer (Geofence Detected) | Odometer reading when the vehicle enters the geofence. | |
| Exit Speed (Geofence Detected) | Vehicle speed upon leaving the geofence. | |
| Exit Odometer (Geofence Detected) | Odometer reading when the vehicle leaves the geofence. | |
| Device ID (Geofence Detected) | The identifier of the device that recorded the geofence event. | |
| Vehicle ID (Geofence Detected) | The identifier of the vehicle associated with the geofence detection. | |
| Telematics Vehicle ID (Geofence Detected) | The telematics-assigned vehicle ID used to track geofence events. | |
| Arrival & Departure Status | ||
| Arrived | Indicates whether the destination has been marked as arrived, either manually or via geofence detection. | |
| Departed | Indicates whether the destination has been marked as departed, either manually or via geofence detection. | |
| Arrival & Departure Time | ||
| Planned Arrival Time | The scheduled time for arrival at the destination based on route planning. | |
| Planned Departure Time | The scheduled time for departure from the destination. | |
| Actual Arrival Time (User Actioned) | The user-recorded arrival time at the destination. | |
| Actual Departure Time (User Actioned) | The user-recorded departure time from the destination. | |
| Dynamic Arrival Time | The estimated arrival time that adjusts in real-time based on traffic or route changes. | |
| Dynamic Departure Time | The estimated departure time that adjusts in real-time based on traffic or route changes. | |
| Arrival / Departure Schedule Deviation | ||
| Time Window Violated (User Actioned) | Indicates if the arrival or departure fell outside the scheduled time window, as recorded manually. | |
| Arrival Time Variance (-Early,+Late) (User Actioned) | The difference in minutes between the planned and actual arrival times, manually recorded. Negative indicates early arrival, positive indicates late. | |
| Departure Time Variance (-Early,+Late) (User Actioned) | The difference in minutes between planned and actual departure times, manually recorded. Negative indicates early departure, positive indicates late. | |
| Planned Remaining Capacity | ||
| Planned Remaining Cube | Estimated remaining volume capacity of the vehicle after servicing this destination. | |
| Planned Remaining Pieces | Estimated remaining item/unit capacity of the vehicle after servicing this destination. | |
| Planned Remaining Revenue | Expected remaining revenue after servicing this destination. | |
| Planned Remaining Weight | Estimated remaining weight capacity of the vehicle after servicing this destination. | |
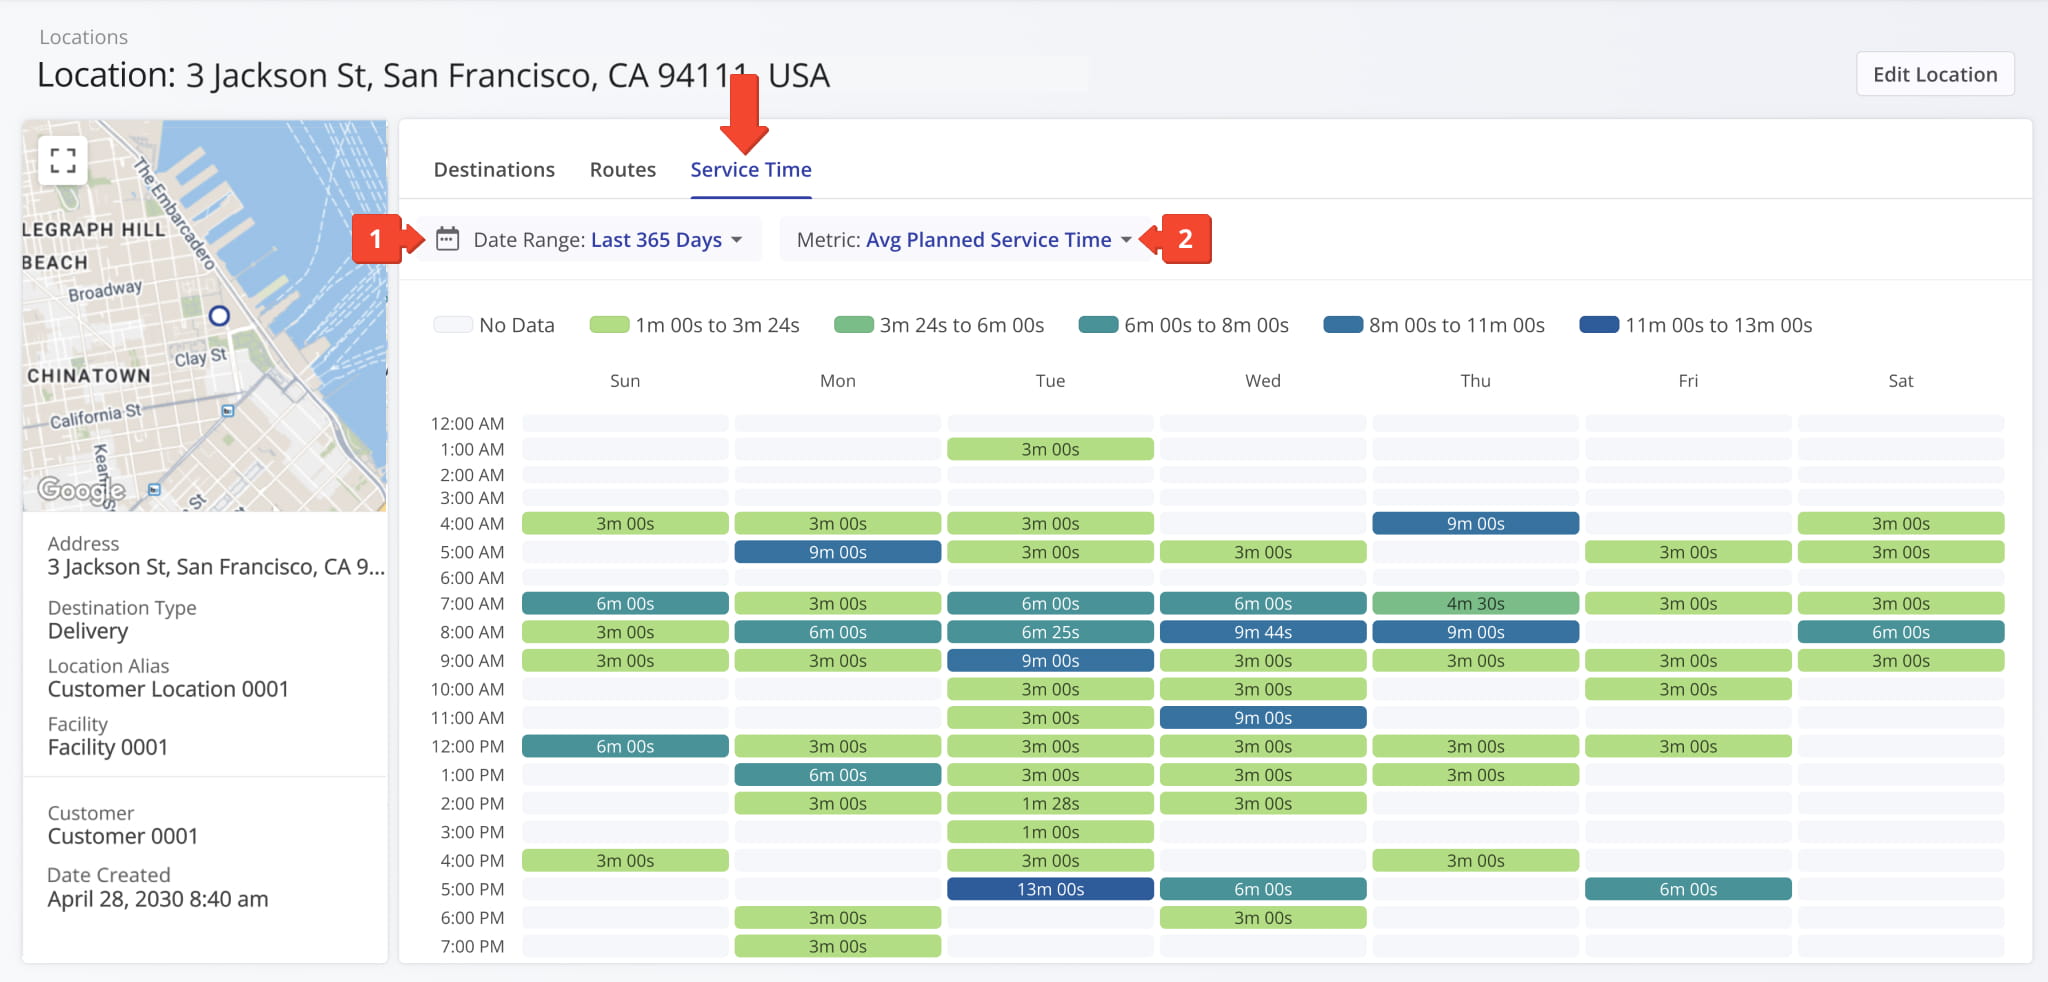
Service Time Tab – Service Time Destinations And Performance Overview
The Service Time tab shows the distribution of Destination Service Time at a specific location across the days of the week within a selected time period.
This view provides a clear breakdown of how planned, reported, and detected service times are distributed, helping you quickly identify patterns and performance gaps. From this tab, you can:
- Filter data by date range.
- Filter data by service time metrics, described in the table below.
| Column | Description |
|---|---|
| Avg Reported Service Time | Average service time reported manually by users at the destination. Reflects what actually happened according to human input, rather than system estimates. |
| Avg Detected Service Time | Average service time automatically detected via geofence triggers. A system-generated value that captures when a vehicle enters and leaves a location. |
| Avg Planned Service Time | Planned service time estimated for the destination. Expected duration set during route planning. |
| Avg Reported vs Planned Service Time (Δ) | Difference between reported and planned service times. Shows whether stops generally took longer or shorter than expected. |
| Avg Reported vs Planned Service Time (%) | Percentage difference between reported and planned service times. Easily see deviations relative to the route plan. |
| Avg Detected vs Planned Service Time (Δ) | Difference between geofence-detected and planned service times. Highlights where automated tracking differs from the schedule. |
| Avg Detected vs Planned Service Time (%) | Percentage difference between detected and planned service times. Compares automated measurements against planned expectations. |
Visit Route4Me's Marketplace to Check out Associated Modules:
- Operations
Audit Logging and Activity Stream
- Operations
Custom Data Add-On
- Operations
Advanced Team Management Add-On
About author: Daniel Archer
With a background in pedagogy and writing instruction, Daniel is a former tenured English Instructor who, after nearly 20 years of teaching, transitioned into content strategy and leading writing teams for global brands. Now, as Technical Documentation Manager at Route4Me, he translates complex logistics technology into clear, accessible content that empowers users.