Weather Map Layers – Predictive Route Weather Maps
Weather Map Layers provide insight into the conditions users will face on routes. You can easily enable and use weather overlays directly on the Routes Map. When routes are shown on the map, you’ll see predictive weather forecasts specifically for the scheduled start date of your selected routes. This proactive insight enables you to adjust schedules, reassign vehicles, notify customers of potential delays, and know when to use weather slowdown settings to keep routes on track.
Table of Contents
Weather Map Layers – Enable Weather Forecast For Scheduled Routes
Currently, Weather Map Layers are available on the Routes Page. Go to “Dynamic Routing” > “Routes” and follow the steps below:
- Click the Map Button to open the Routes Map
- Enable routes by clicking the Eye Icon in the Routes List
NOTE: If you don’t enable routes, only current weather data will be shown. - Click the Gear Icon in the Routes Map to open the Map Settings
- Enable the “Weather” option to display all Weather Map Layers
With routes and weather layers enabled, you’ll see a card in the corner of the map that specifies the weather forecast time. You can enable any combination of weather overlays to see the forecast data relevant to your needs. Keep reading to learn more.

Radar Precipitation And Rain Tracking Map Layer
Enable the “Radar” option to see predictive precipitation data across your operational area. This layer displays a heatmap of rain intensity, allowing dispatchers to cross-reference weather patterns with routes and ensure ETAs remain accurate and reliable.
![]()
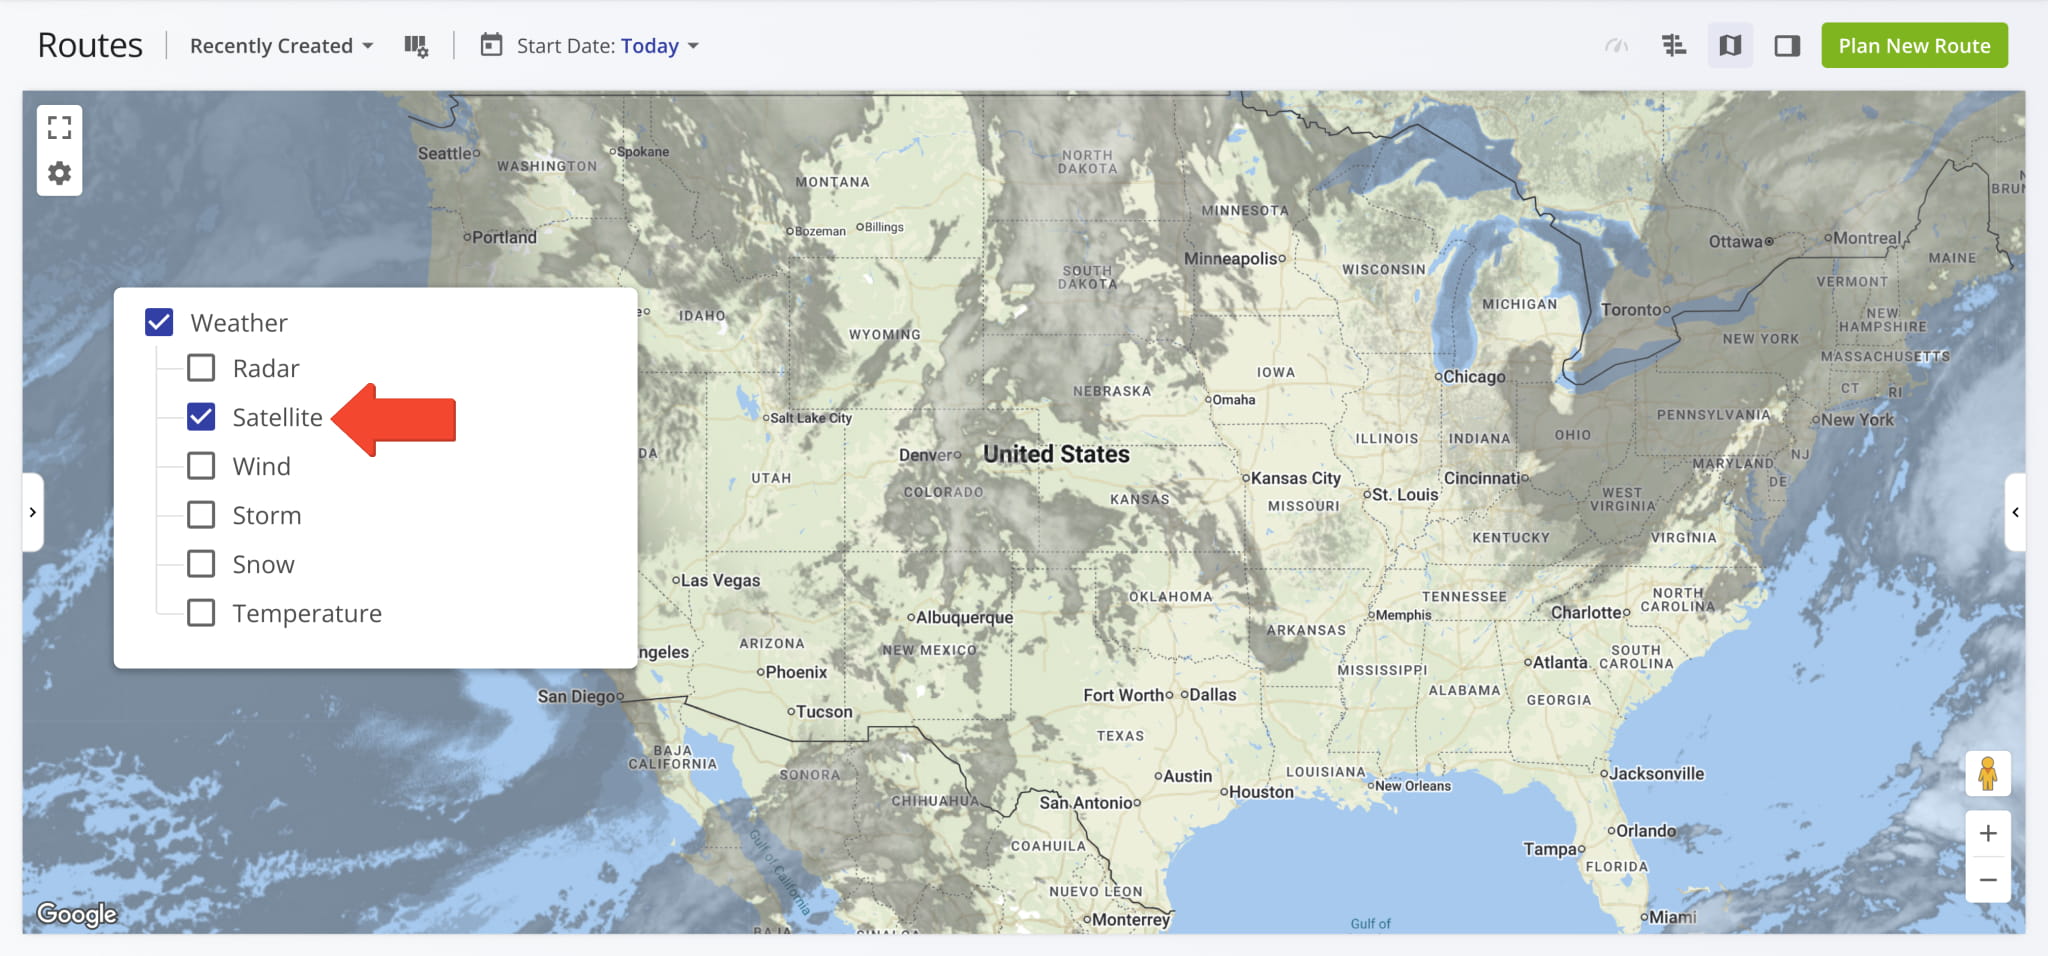
Satellite Cloud Coverage Weather Map Overlay
Enable the “Satellite” option to visualize regional cloud coverage and density. This layer provides an overview of atmospheric conditions, helping you identify areas of heavy overcast or reduced visibility that may affect driver safety and travel speeds.
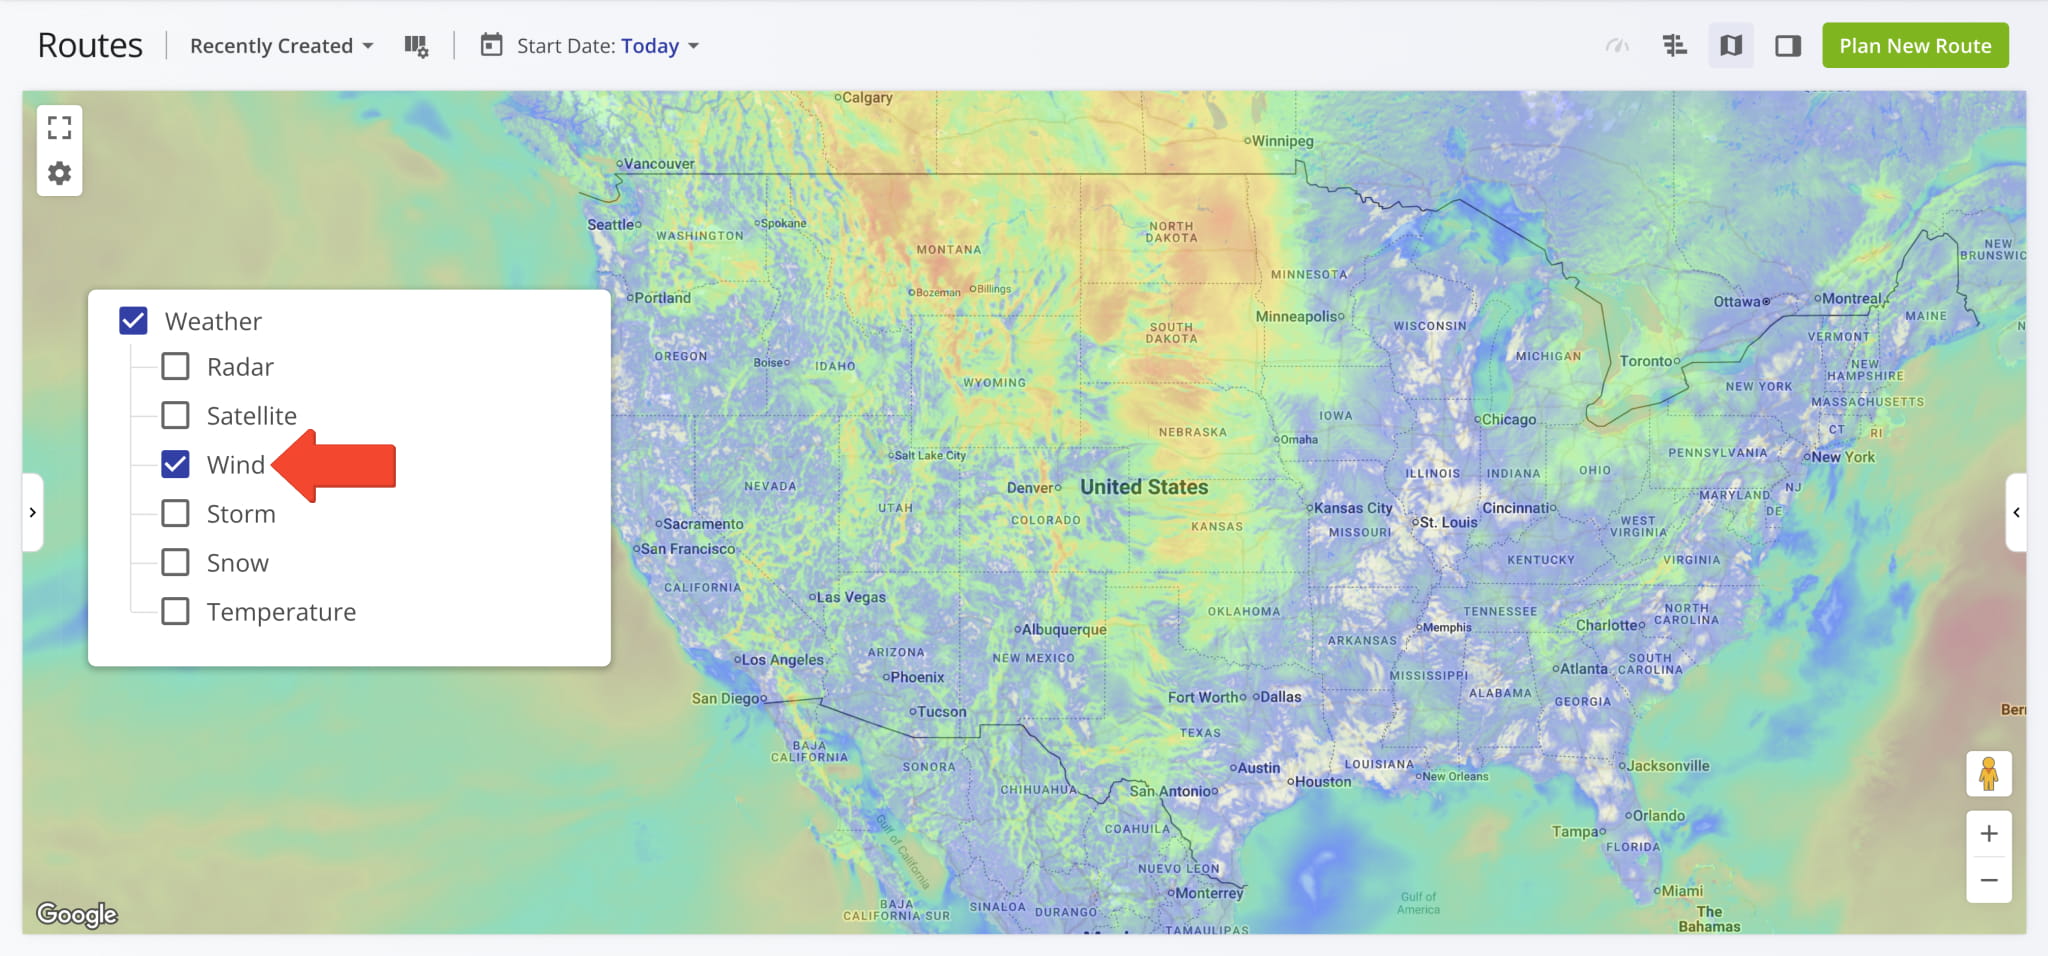
Wind Speed Heatmap Weather Map Layer
Enable the “Wind” option to see a wind speed heatmap overlay. This heatmap is essential for logistics teams managing taller commercial vehicles or long-distance transit where high-velocity gusts can impact fuel efficiency, vehicle stability, and safety.
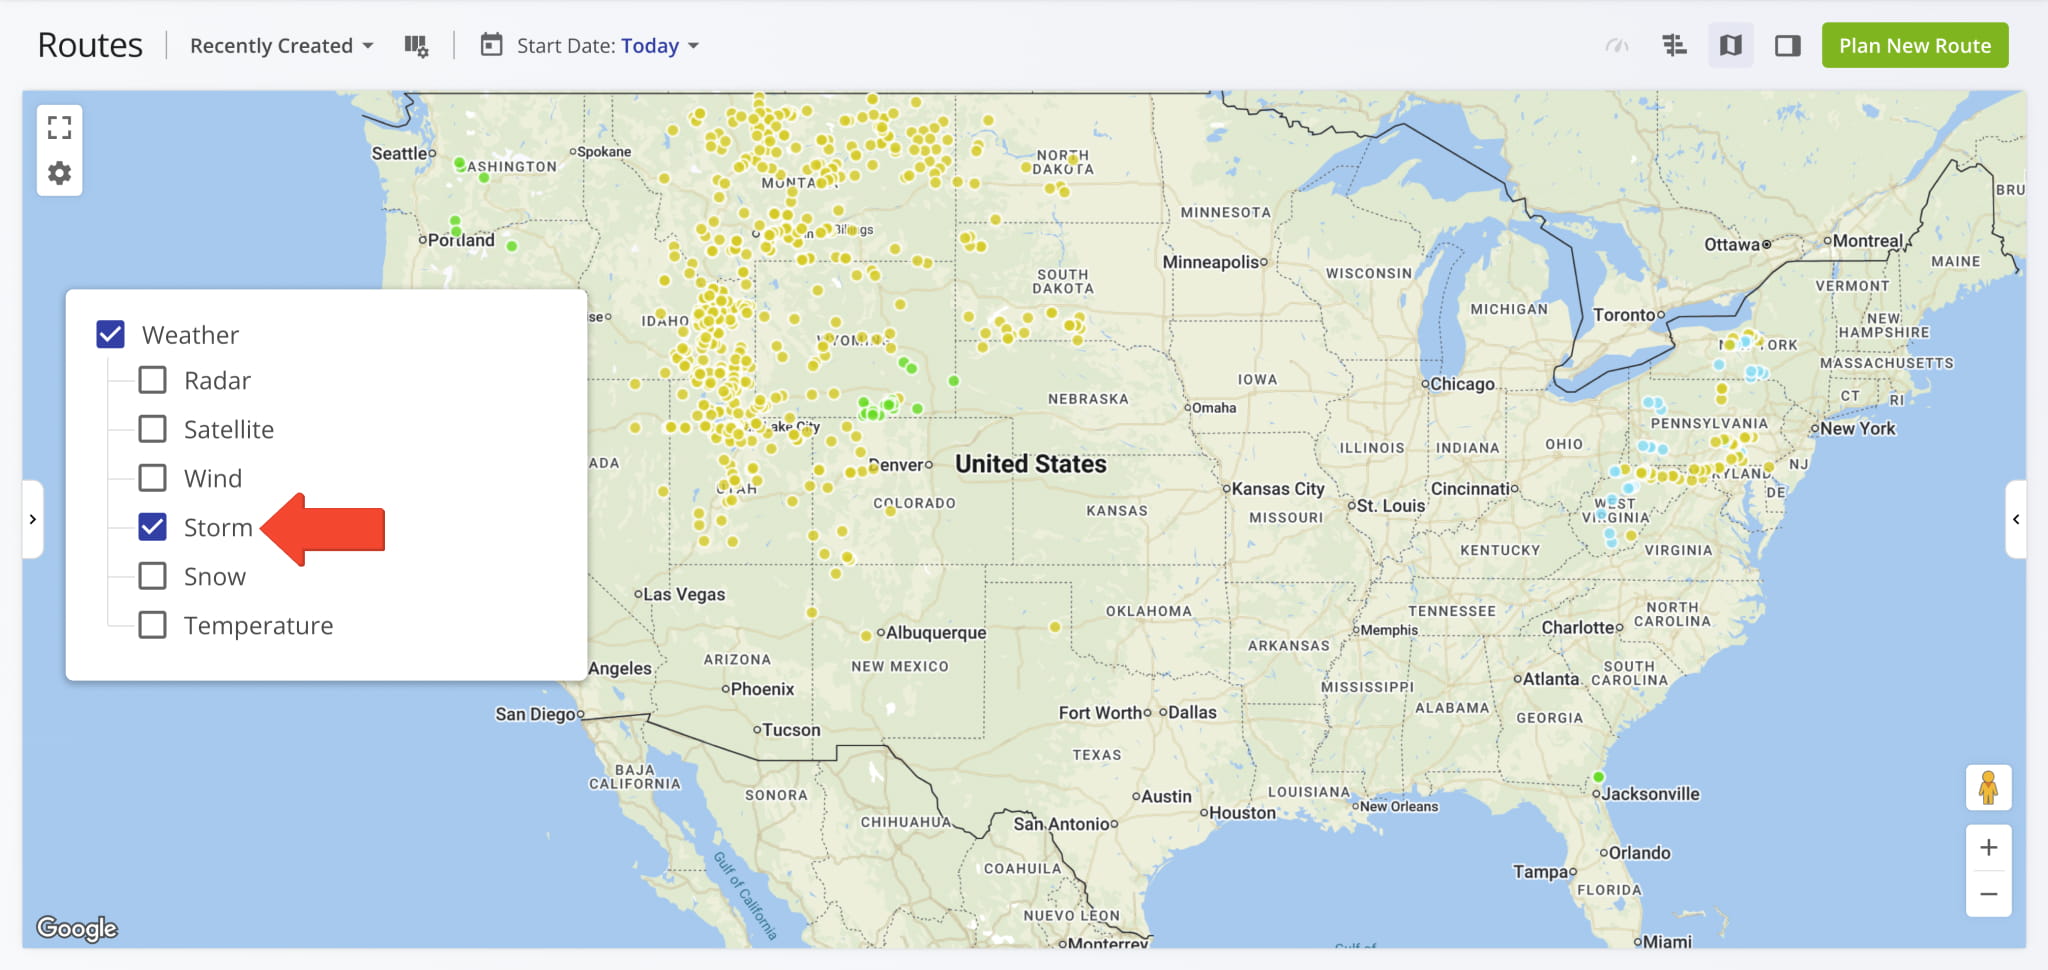
Storm Location And Severity Indicators
Enable the “Storm” option to pinpoint severe weather cells and localized atmospheric events across your service area. This layer uses color-coded markers to indicate specific locations and the intensity of detected and predicted storm weather events.
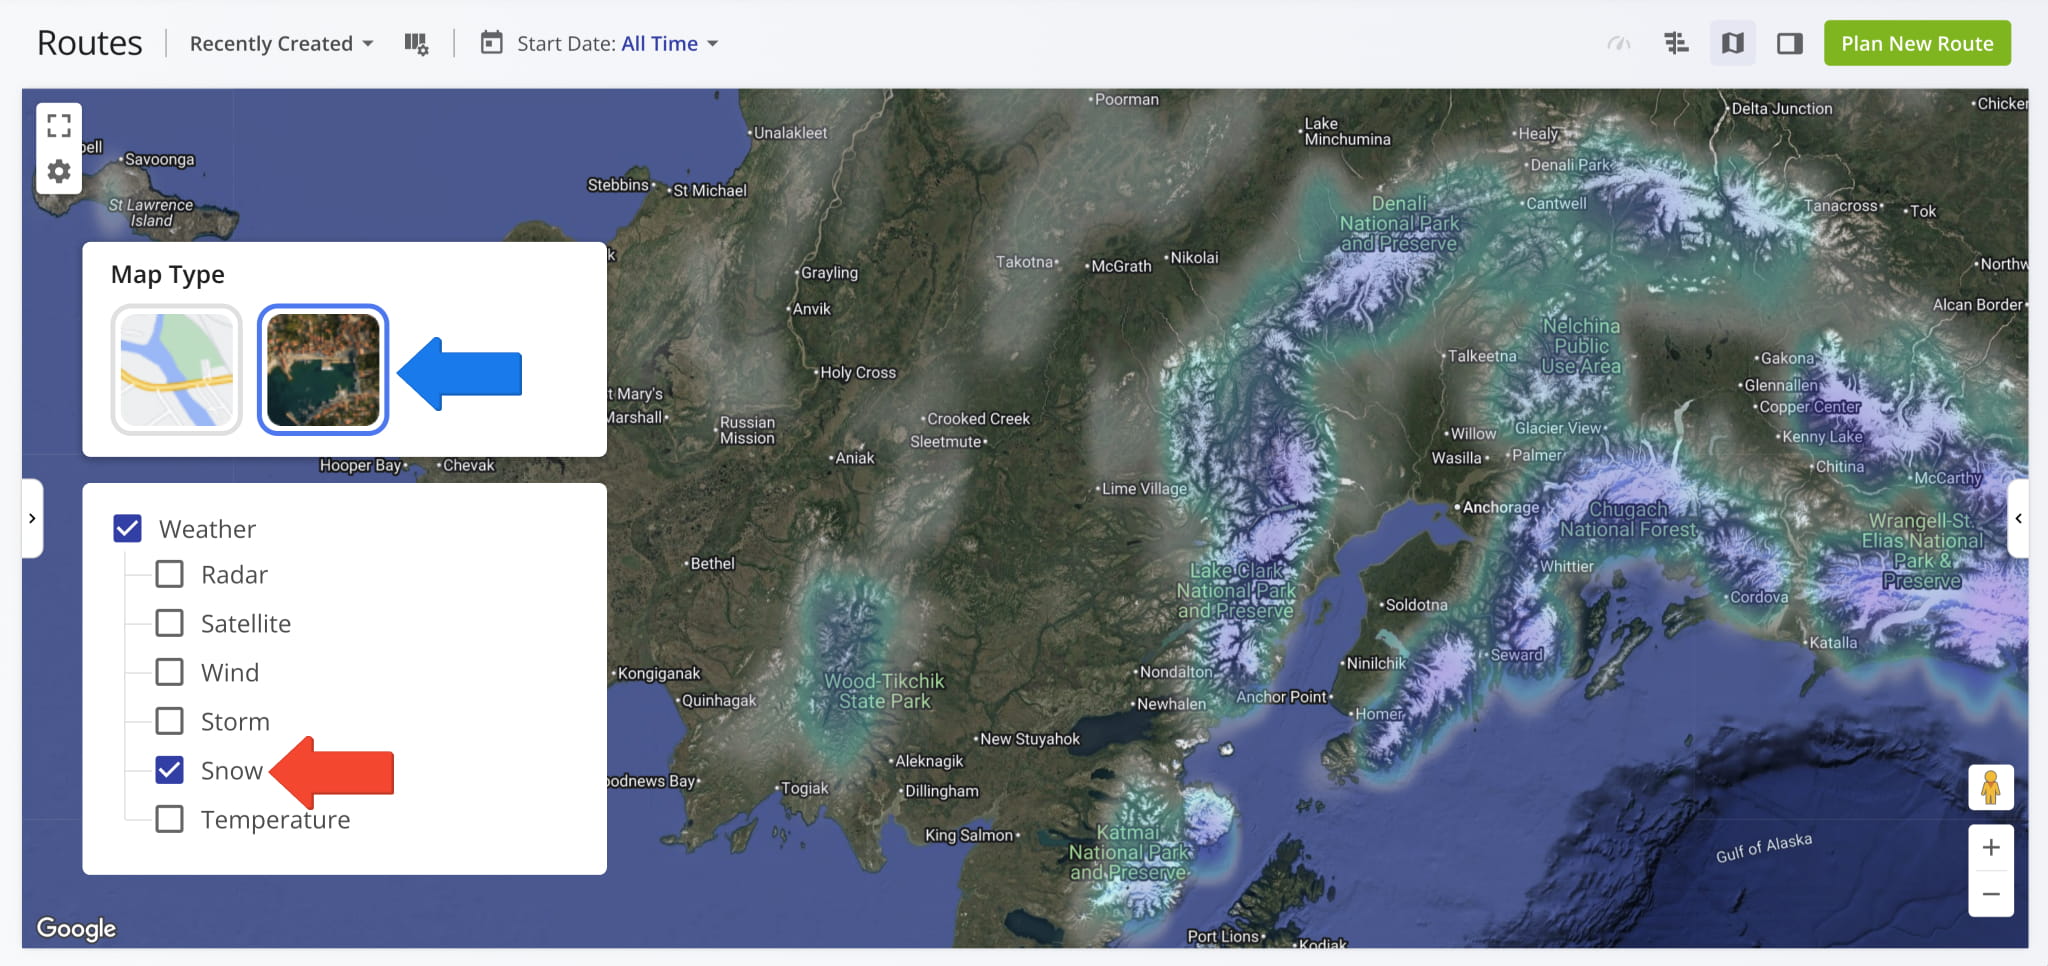
Snow Coverage Weather Map Layer
Enable the “Snow” layer to visualize snowfall and ground accumulation. This layer is indispensable for winter logistics, allowing planners and dispatchers to identify high-risk areas where winter weather can reduce road traction and vehicle speeds.
NOTE: For visual clarity, it’s recommended to switch your Map Type to satellite imagery when using the “Snow” layer. The high-contrast terrain of the satellite view makes it easier to distinguish between different levels of snow accumulation and coverage.
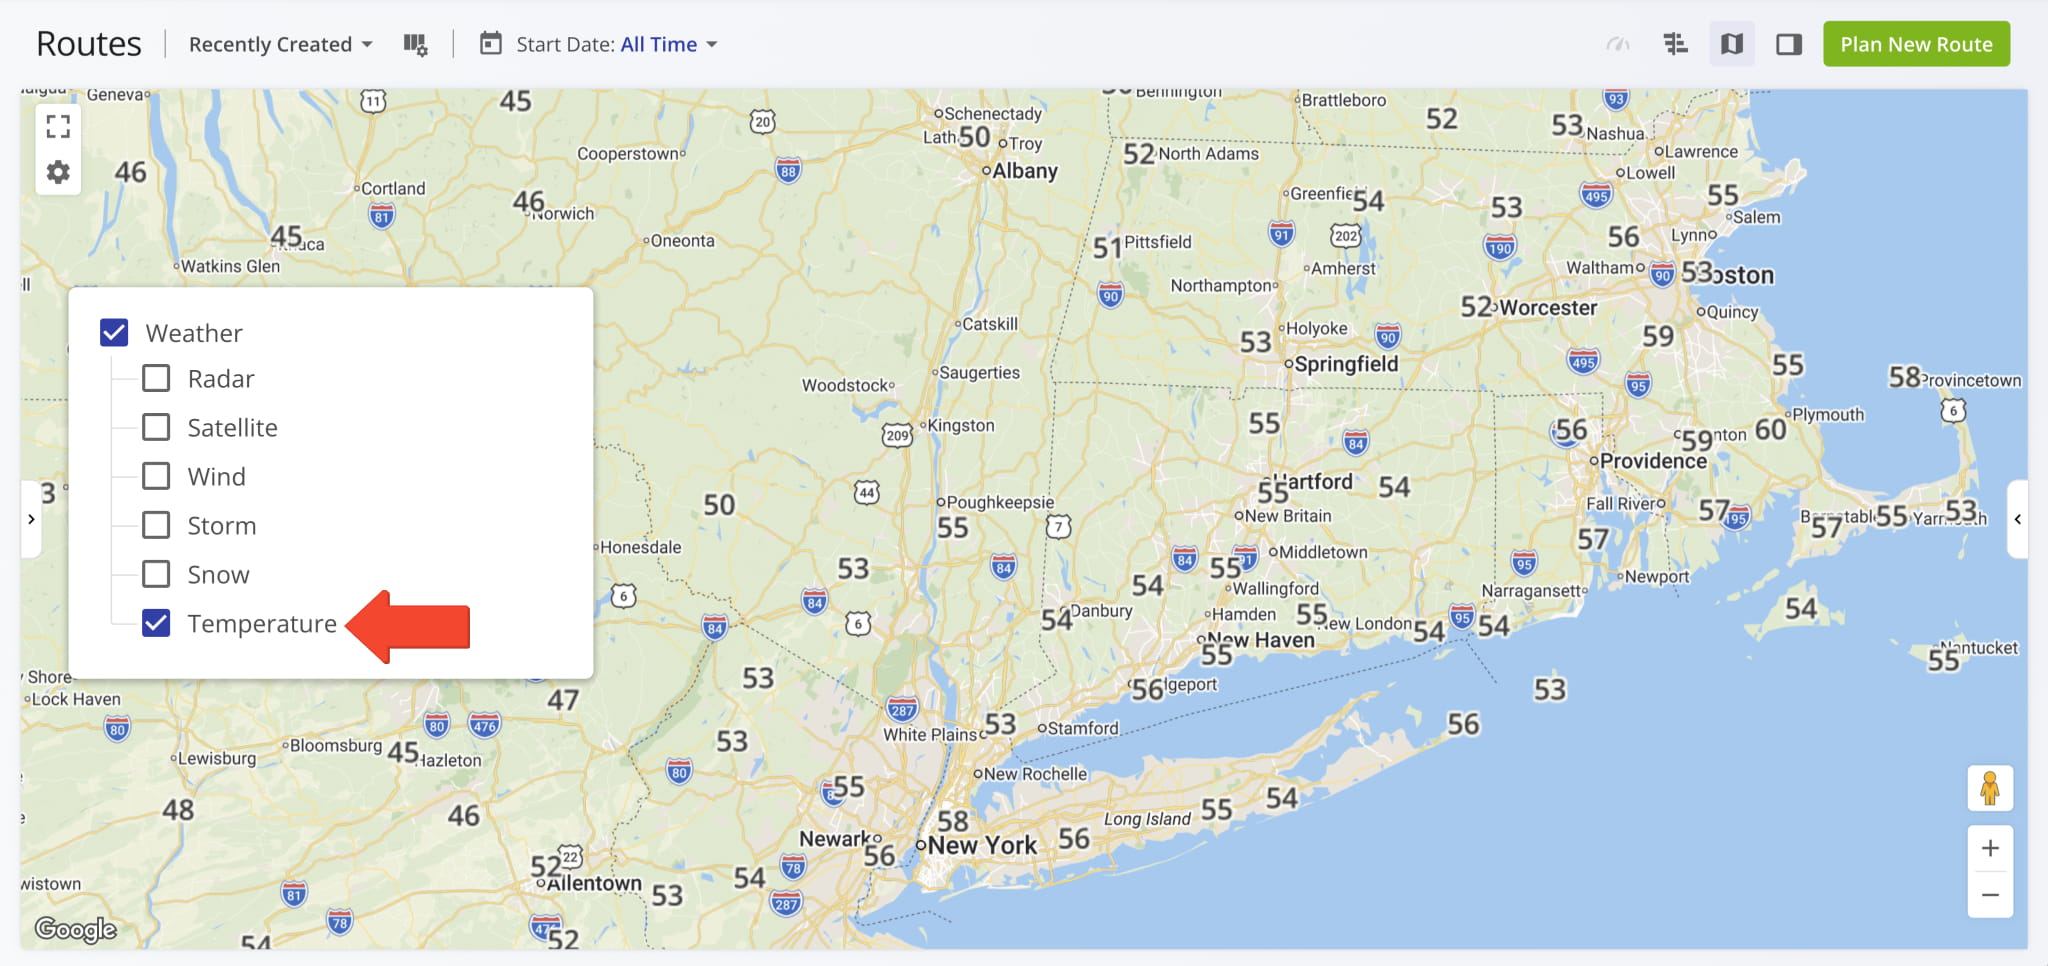
Temperature Forecast Overlay On Routes Map
Enable the “Temperature” option to populate the map with numerical readings of detected and predicted temperature values. This layer is useful for enterprises managing temperature-sensitive cargo, such as pharmaceuticals or perishables. Additionally, weather temperature data can help you determine optimal locations for driver breaks during heatwaves.
Visit Route4Me's Marketplace to Check out Various Modules and Add-Ons:
- Route Optimization
Time Windows
- Operations
Advanced Team Management Add-On
About author: Kristian Andreev
Kristian is a Technical Writer at Route4Me. With over a decade of experience in writing and localization, he's an expert at communicating complex technical data in a clear, concise, and user-friendly way. Passionate about bridging the gap between engineers and users, he specializes in creating documentation to streamline onboarding, enhance product usability, and support global teams on the path to success.