Business Insights – Reporting And Analytics Dashboard With Performance Data And KPIs
Route4Me’s Business Insights dashboard is a powerful reporting tool for enterprise businesses to track field team members, vehicle fleet, and routing activities. You can customize the dashboard to filter, sort, group, and visualize real-time metrics and KPIs, helping you gather actionable last mile intelligence. Compared to the Routing Dashboard in Route4Me’s Web Software, Business Insights offers more in-depth and flexible data filters. Just sign in with your Route4Me account, and the dashboard automatically collects all necessary information. Learn more in this guide.
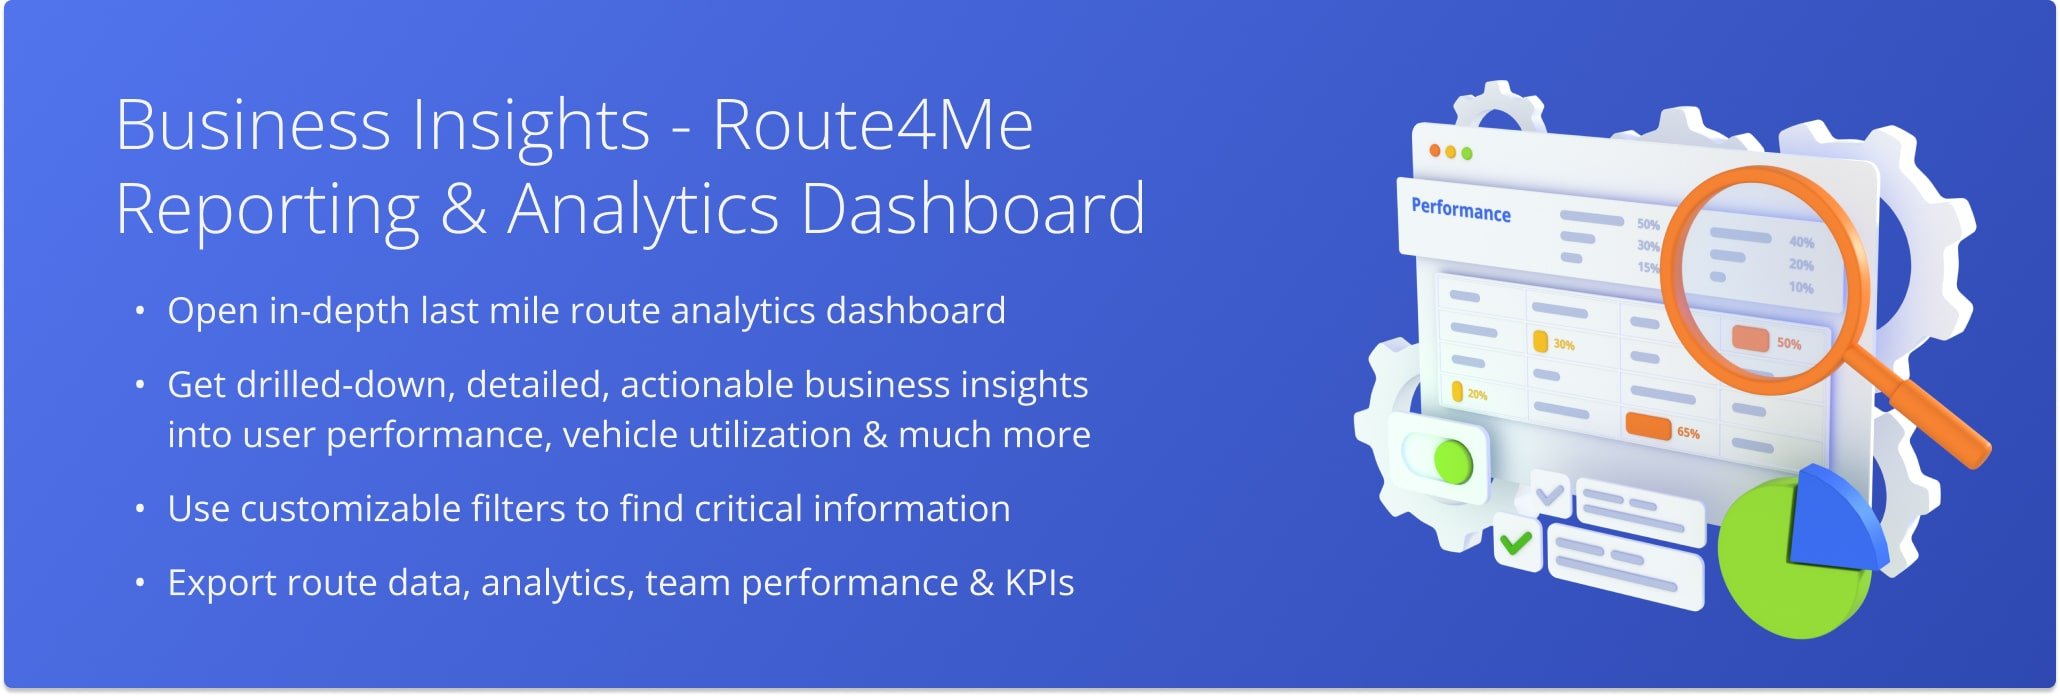
Table of Contents
Business Insights Overview – Open And Use Reporting And Analytics Dashboard
To open the Business Insights dashboard, go to “Business Operations” > “Business Insights” from the Navigation Menu.
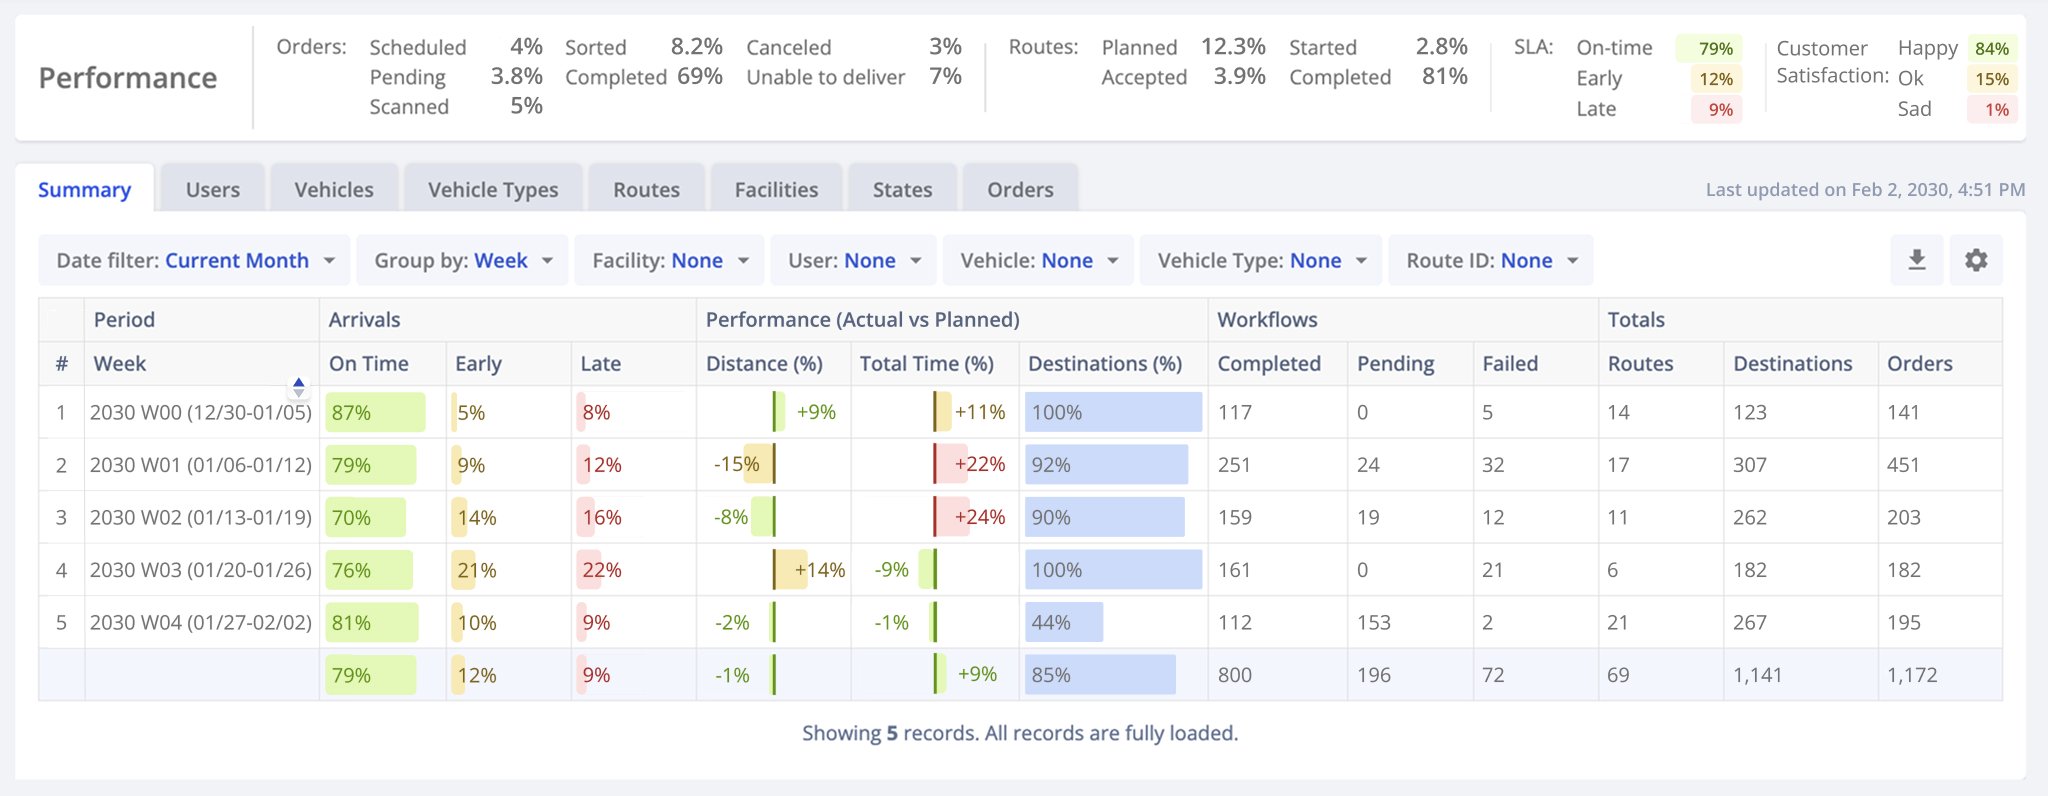
At the top of the dashboard, you can see the Performance Summary panel, which shows aggregate business performance data for the filtered date range. In detail, you can see performance data for order completion, route execution, SLAs, and customer satisfaction. NOTE: Use the scroll bar at the bottom of the Performance Summary to scroll horizontally and view all your aggregate performance statistics.
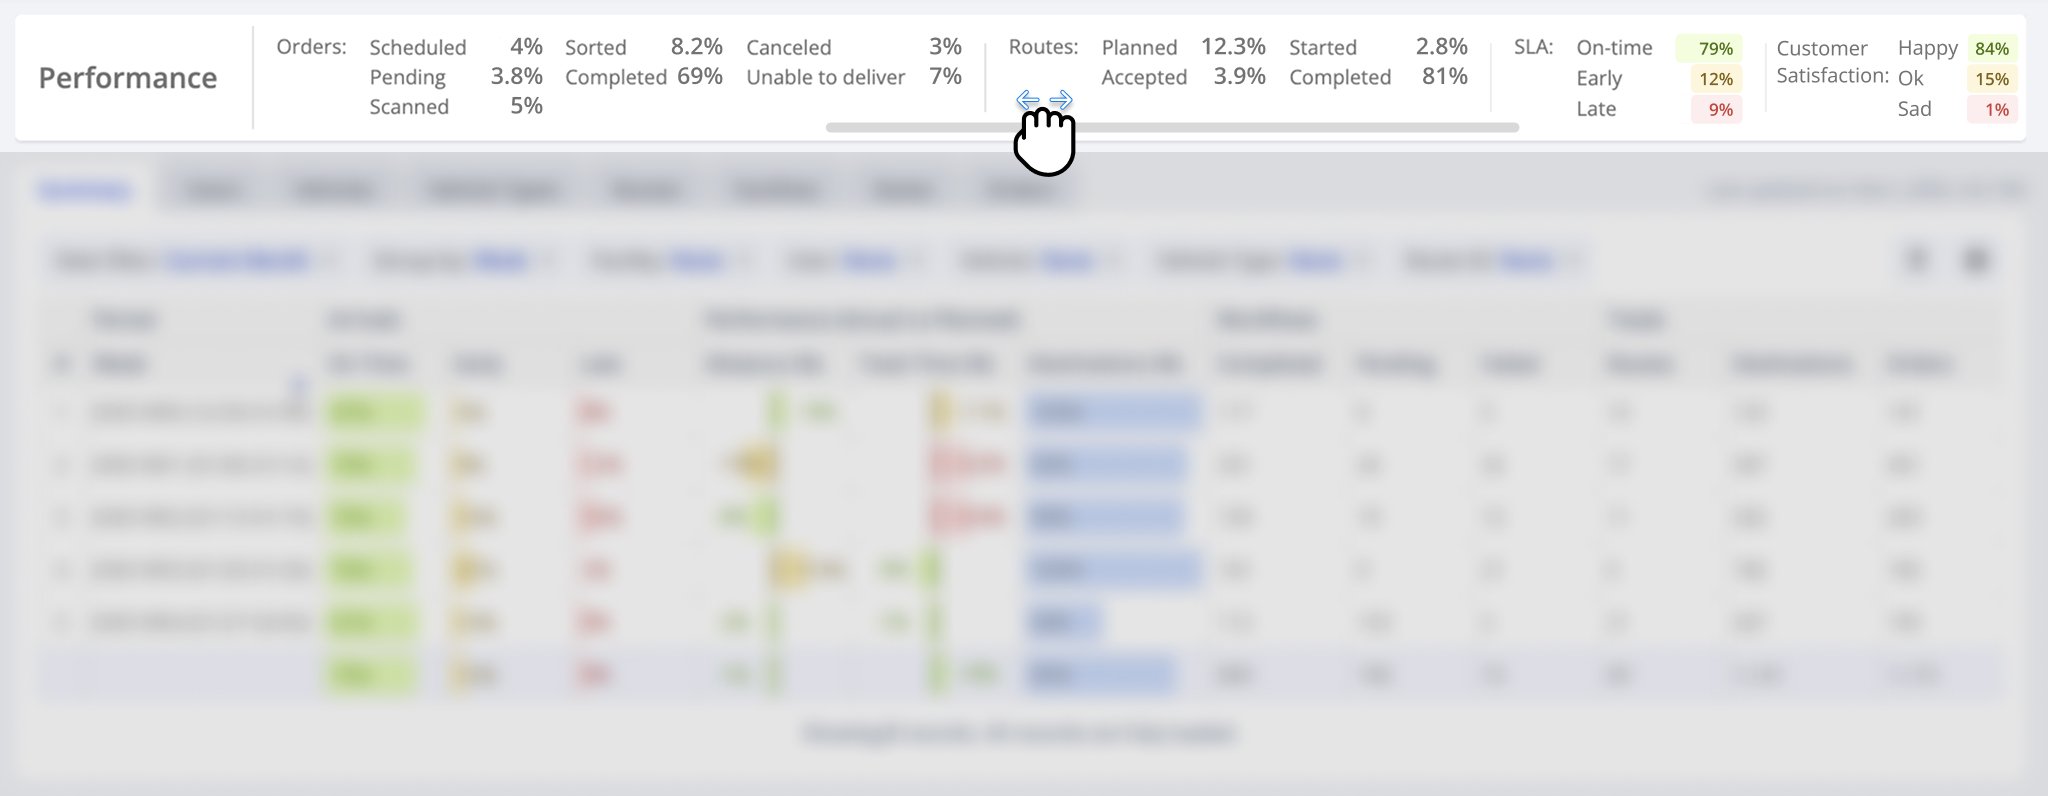
Below that is the main analytics data table, where you can find in-depth data and drill down into statistics about the performance of your business. Just like the Performance Summary, you can scroll horizontally to see all the data in your dashboard.
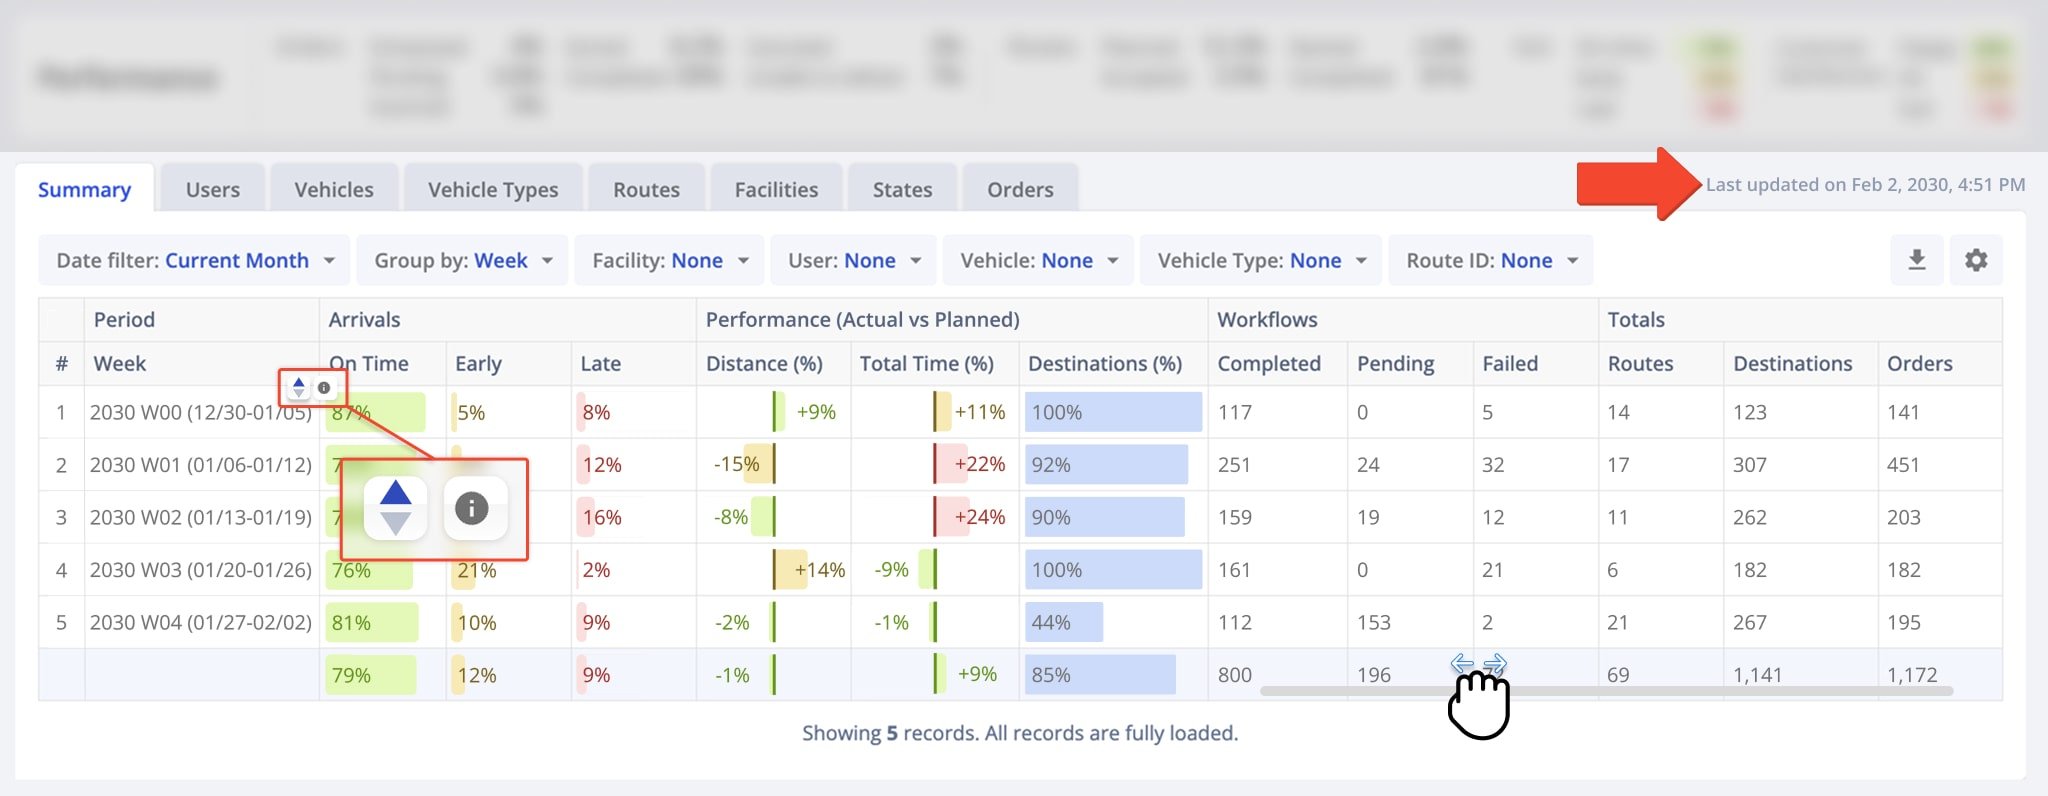
To sort the table by any column, click the corresponding Arrow Icon. Next to it, you can hover over the Information Icon to get a description of the associated data. Additionally, you can see a timestamp of when your Business Insights dashboard data was last synchronized in the top-right of the data table. Learn more about customizing the data table further in this guide.
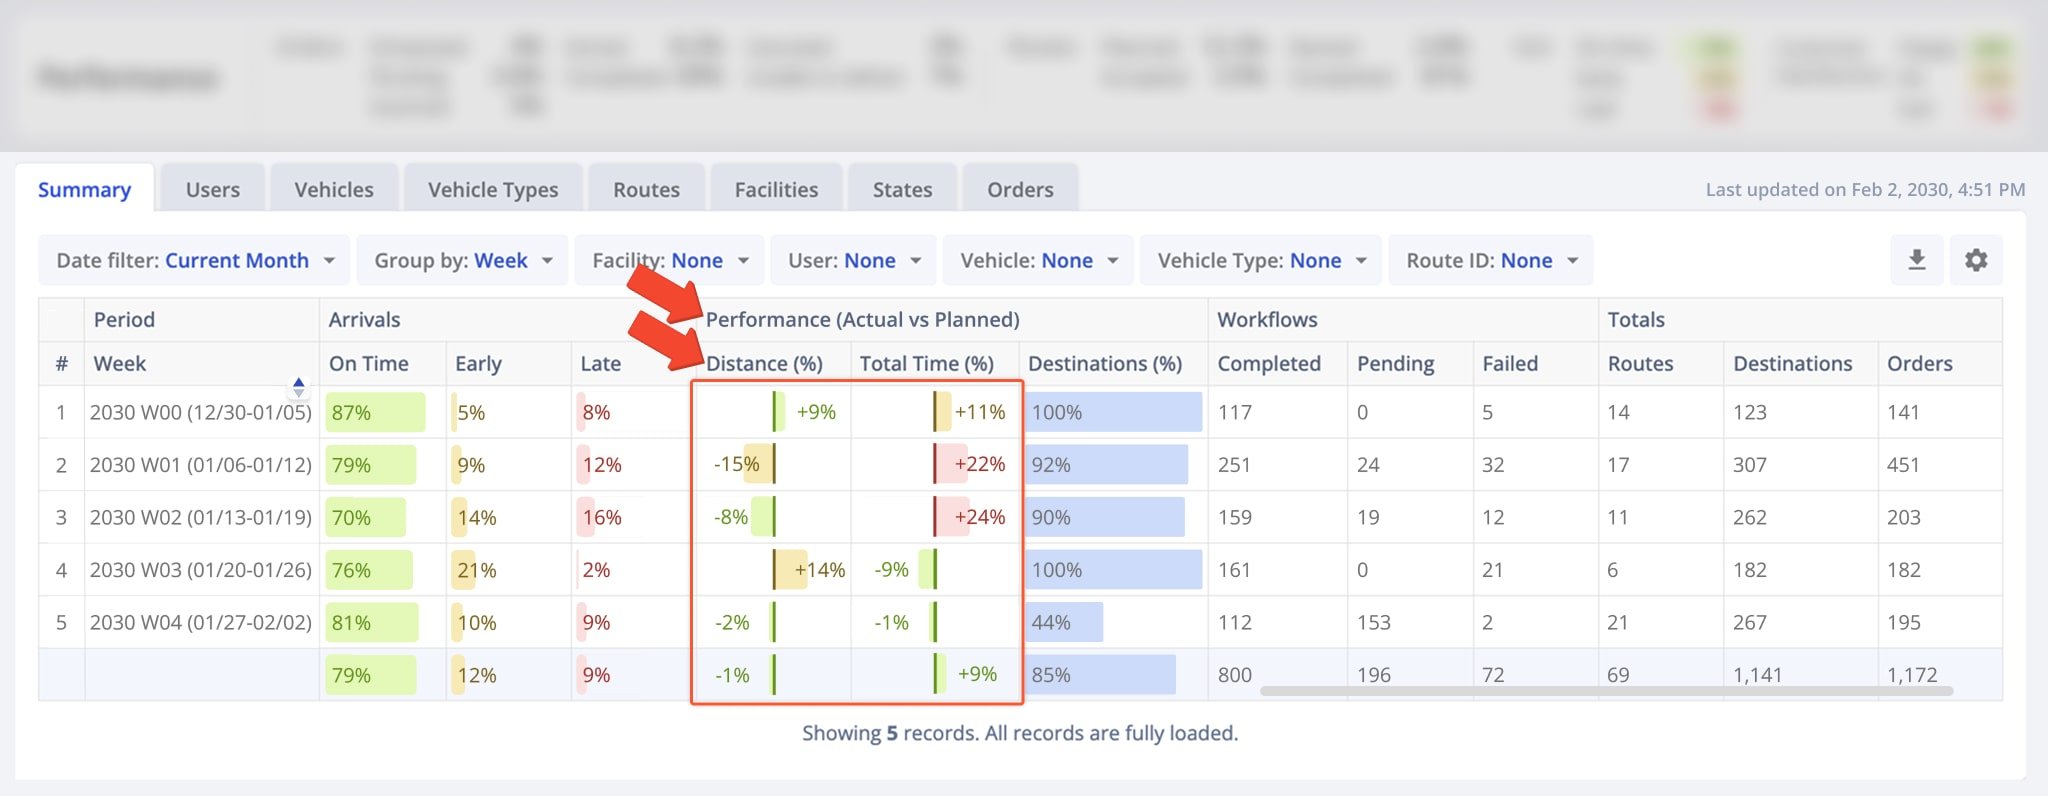
The double header of the data table enables grouping complex data in an easy-to-use way. For example, the “Performance (Actual vs Planned)” header has secondary headers for the percentage of planned and completed distance, route time, destinations, etc. Additionally, the “Performance (Actual vs Planned)” section is where you can track deviations from planned route attributes like distance, duration, etc.
The Middle Divider represent the planned value for a metric, a negative percentage to the left means the actual value is lower than the planned value, and a positive percentage to the right means the actual value is higher than the planned value. Deviations under 10% are colored in green, deviations of 10%–20% are colored yellow, and deviations above 20% are colored red.
Dashboard Filters – Analytics Filter And Grouping Settings
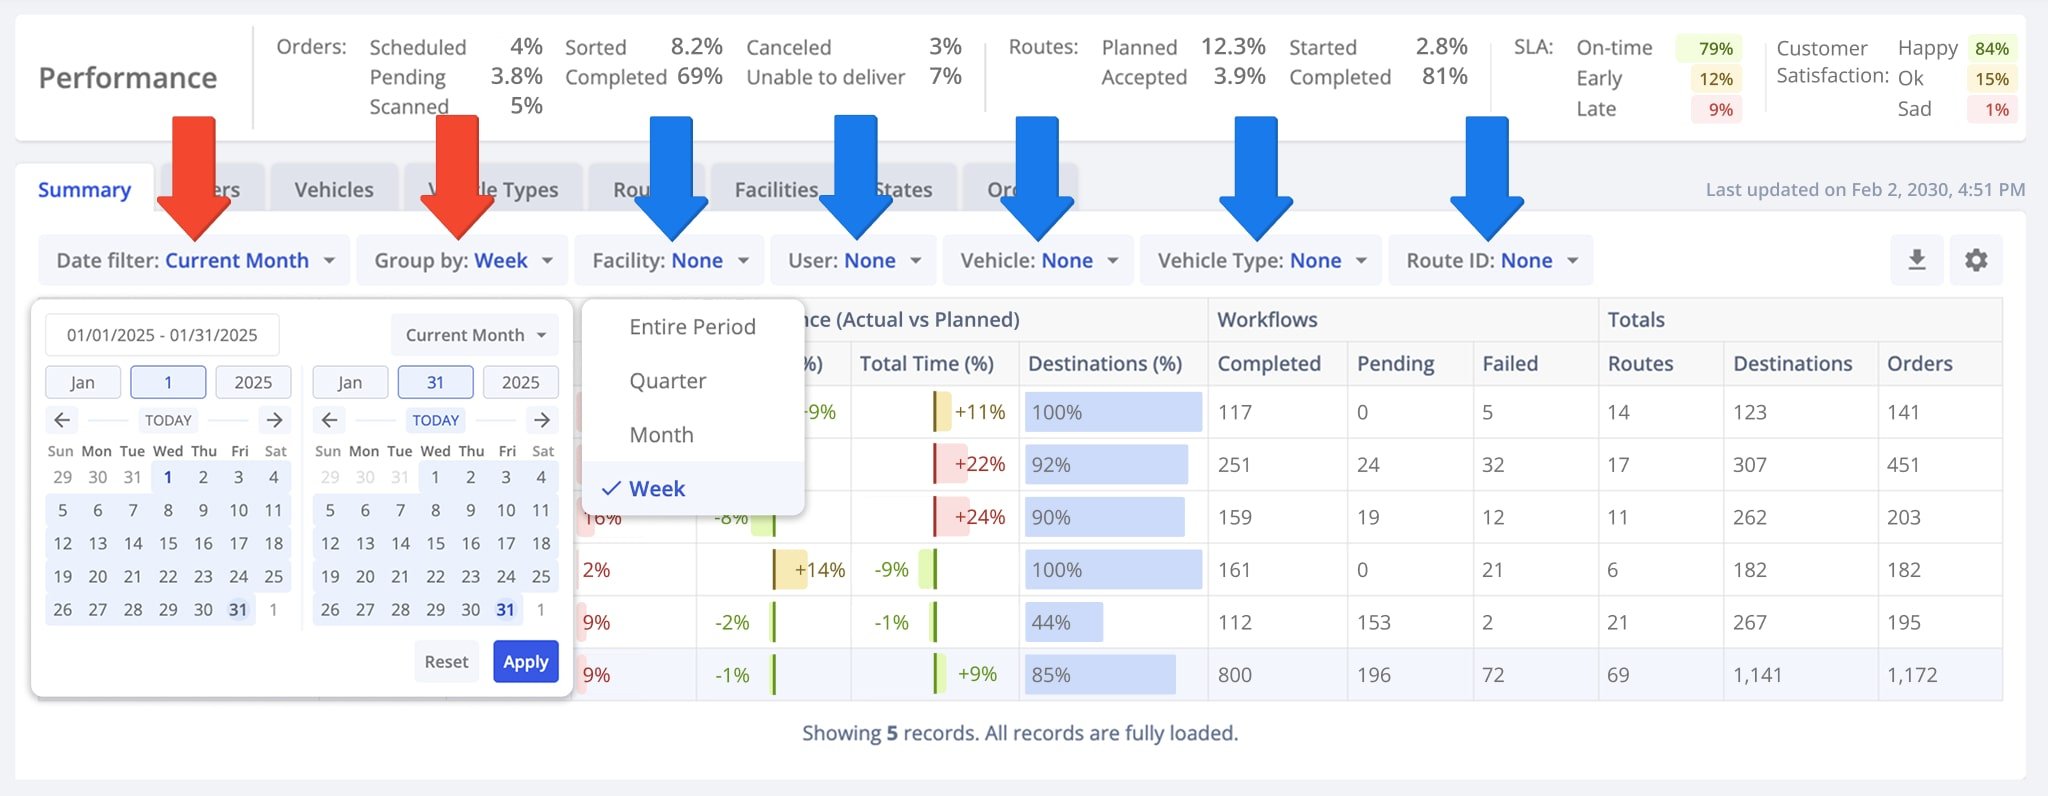
Dashboard filters narrow down and group data according to a specific timeframe and are always enabled. To make the most of the Performance Summary and analytics data table, adjust filter options for your preferred date range, time frame grouping, associated Facilities, Users, Vehicles, Vehicle Types, and Route ID. Learn more in the table below.
To do so, click the “Date filter” button and select the preferred date range by entering it manually in the respective field, selecting dates on the calendar, or selecting a pre-defined date range type from the dropdown menu. Then, click “Group by” and select how you’d like to group data on your analytics dashboard. NOTE: The “Trailing…” date range filter specifies a range up to the current date, i.e. “Trailing year” will show data up to the current date from the same date from the previous year.
| Filter | Description |
|---|---|
| Date filter | Select a date range or date range type. |
| Group by | Select a time frame grouping option. Data table rows will correspond to the specific time frames you select. |
| Facility | Search for and select specific Facilities on your Route4Me account to filter the Business Insights dashboard and see data associated only with those Facilities. |
| User | Search for and select specific users on your Route4Me account to filter the Business Insights dashboard and see data associated only with those specific users. |
| Vehicle | Search for and select specific vehicles on your Route4Me account to filter the Business Insights dashboard and see data associated only with those specific vehicles. |
| Vehicle Type | Search for and select specific Vehicle Capacity Profiles on your Route4Me account to filter the Business Insights dashboard and see data associated only with those specific vehicle types. |
| Route ID | Input or search for and select unique Route IDs to filter the Business Insights dashboard and see data associated only with those specific routes. |
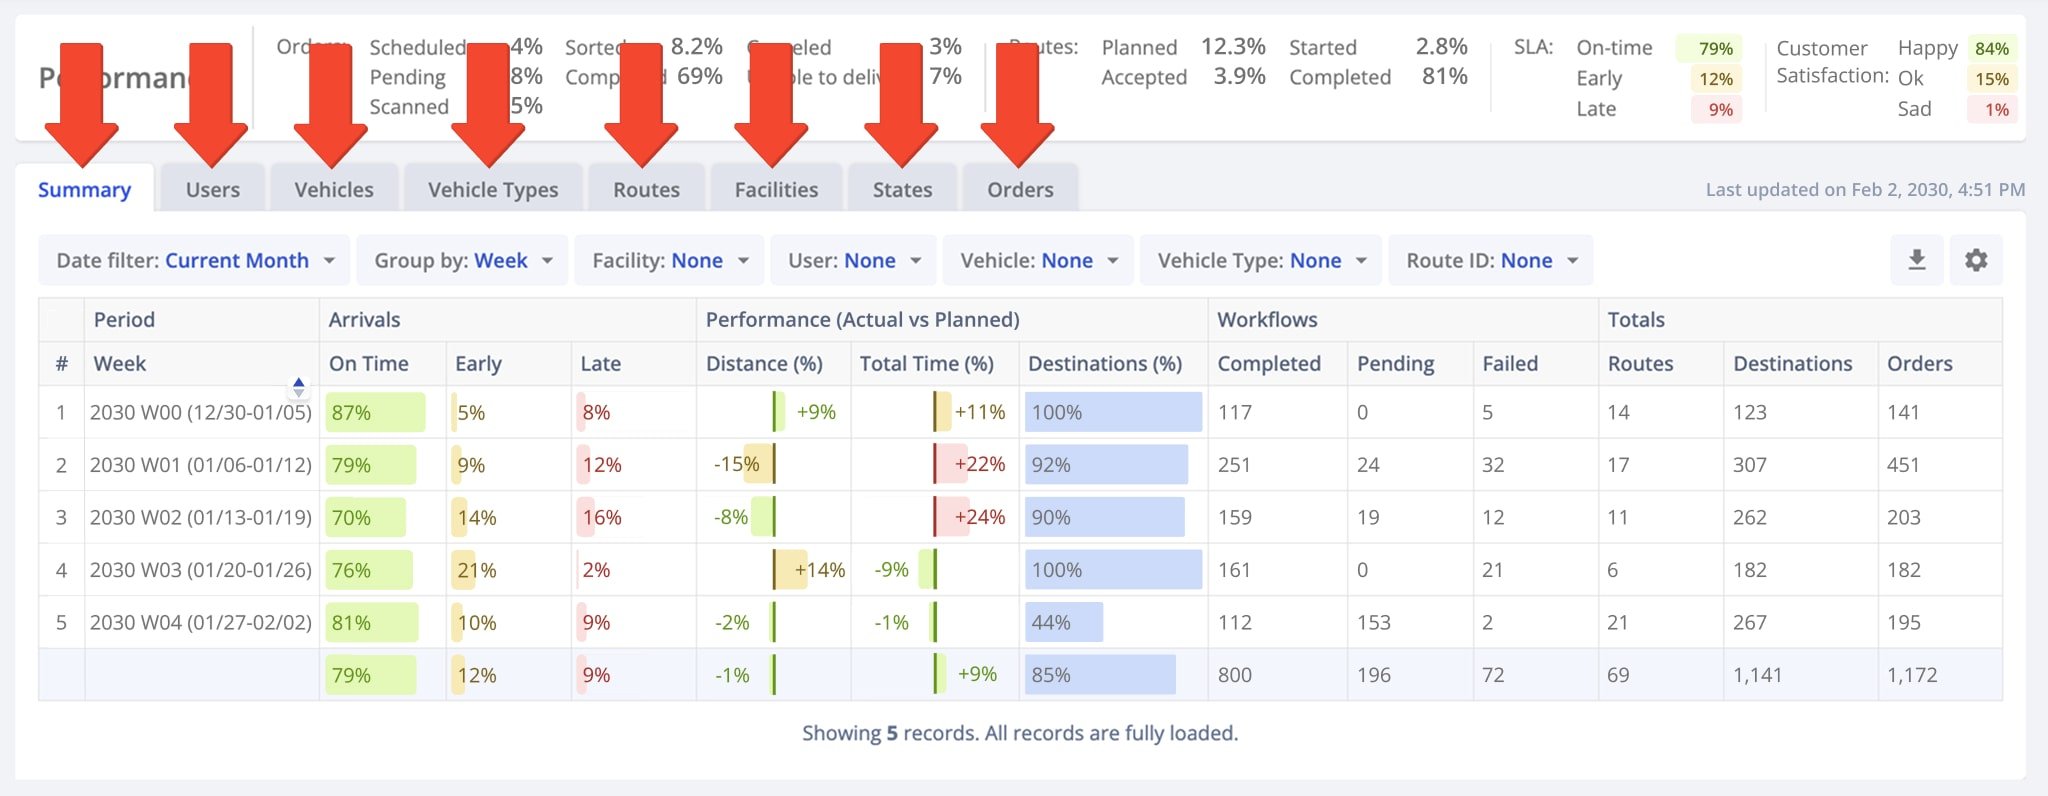
Analytics Categories – Dashboard Data Table Tabs And Sections
For your convenience, the Business Insights dashboard has different tabs corresponding to data categories that enable you to easily see the performance data specific to your last mile business management needs. Specifically, you can see KPIs for your entire organization, last mile routing team, transportation fleet, routes, facilities, orders, and more. You can even see data broken down by the different types of vehicles in your fleet or by state if your business operates across the country. Find more details about the different Business Insights categories in the table below.
| Category | Description |
|---|---|
| Summary | Performance data for your entire organization. |
| User | Performance data associated with individual users and team members. |
| Vehicles | Performance data associated with individual last mile fleet vehicles. |
| Vehicle Types | Performance data associated with transportation vehicle profiles. In detail, vehicle profiles contain specific settings related to vehicle dimensions and usage and are different from capacity profiles which define maximum vehicle capacity. |
| Routes | Performance data associated with individual last mile routes scheduled for the specified date range in the “Date filter“. |
| Facilities | Performance data associated with individual Facilities on your main Route4Me account. Specifically, Facilities are physical locations such as depots, warehouses, offices, etc. |
| States | Performance data for your entire organization broken down by state. |
| Orders | Performance data for your Customer Orders broken down by Order Status. |
Configure Data Table – Custom Analytics Display Columns And Dashboard Settings
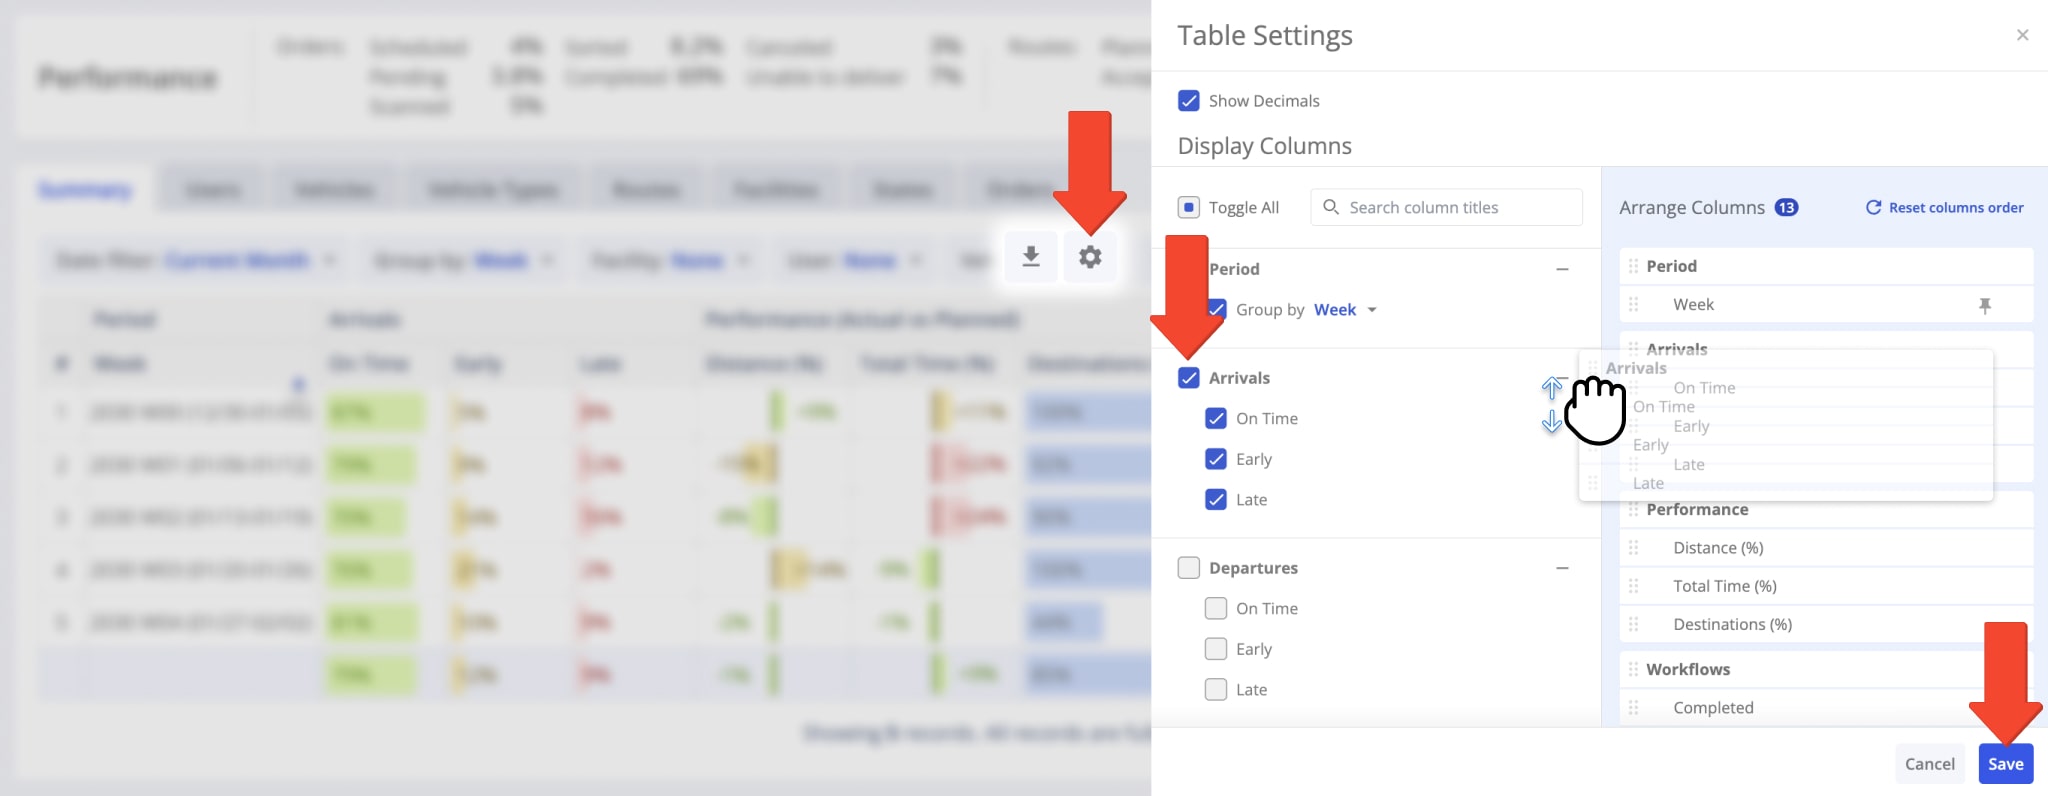
You can customize reporting and analytics data table to show only data relevant to your business use case by customizing columns and table settings. To do so, simply click the Table Settings button (Gear Icon) and check the boxes next to data columns you want to enable. Additionally, drag column names to re-order the data table according to your preferences.
When you’ve adjusted your table settings, click the “Save” button to update the data table. Alternatively, click the “Reset columns order” button to restore the default table settings for the corresponding category. Learn more about available data columns in your Business Insights in the table below.
| Column | Description | |
|---|---|---|
| Arrivals | ||
| On Time | Percentage of Destinations where the assigned User arrived within 5 minutes of the Planned Destination Arrival Time. Destinations are marked as “Arrived” on the Mobile App or detected as arrived through Geofencing. | |
| Early | Percentage of Destinations where the assigned User arrived more than 5 minutes earlier than the Planned Destination Arrival Time. Destinations are marked as “Arrived” on the Mobile App or detected as arrived through Geofencing. | |
| Late | Percentage of Destinations where the assigned User arrived more than 5 minutes later than the Planned Destination Arrival Time. Destinations are marked as “Arrived” on the Mobile App or detected as arrived through Geofencing. | |
| Departures | ||
| On Time | Percentage of Destinations the assigned User departed within 5 minutes of the Planned Destination Departure Time. Destinations are detected as departed through Geofencing. | |
| Early | Percentage of total Destinations the assigned User departed more than 5 minutes earlier than the Planned Destination Departure Time. Destinations are detected as departed through Geofencing. | |
| Late | Percentage of total Destinations the assigned User departed more than 5 minutes later than the Planned Destination Departure Time. Destinations are detected as departed through Geofencing. | |
| Performance (Actual vs Planned) | ||
| Distance (%) | Percentage of actual Route Distance from the total Planned Route Distance. Actual Route Distance is the distance traveled by the assigned User between starting and ending the route on the Mobile App. | |
| Total Time (%) | Percentage of actual Route Time from the total Planned Route Time. Actual Route Time is the time between the assigned User starting and ending the route on the Mobile App. | |
| Service Time (%) | Percentage of actual Service Time from the total Planned Service Time. Actual Service Time is the combined total time the assigned User or Vehicle spent inside Destination Geofences as detected by Geofencing. | |
| Destinations (%) | Percentage of Completed Destinations from the total number of Planned Destinations. Destinations are Completed when marked as Done, Skipped, or Failed by the assigned User using the Mobile App. Optionally, a Destination can be automatically marked as Complated (Done) when the assigned user enters the Geofence around it. | |
| Time Window Success (%) | Percentage of Destinations visited within their corresponding Time Windows. | |
| Missed Time Window (%) | Percentage of Destinations visited outside their corresponding Time Windows. | |
| Average Time Window Drift | Average deviation from specified Time Window at Destinations. This is a positive or negative value depending on whether Destinations were visited earlier or later than their corresponding Time Windows. | |
| Time Window Drift (%) | How much arrival times deviated from Time Windows expressed as a percentage of the Time Window duration. | |
| Utilization | ||
| Cube Planned | Total planned Cube (volume) amount of all Destinations on planned scheduled routes. (Shown only if Vehicle Capacity Profile of assigned Vehicle has Cube value.) | |
| Cube Available | Total available Cube (volume) capacity of assigned Vehicles on planned scheduled routes. Maximum Vehicle Capacity is specified in the associated Vehicle Capacity Profile. | |
| Cube (%) | Percentage of the maximum available Cube (volume) capacity of assigned Vehicles that has been filled (loaded). Maximum Vehicle Capacity is specified in the associated Vehicle Capacity Profile. | |
| Weight Planned | Total planned Weight amount of all Destinations on planned scheduled routes. (Shown only if Vehicle Capacity Profile of assigned Vehicle has Weight value.) | |
| Weight Available | Total available Weight capacity of assigned Vehicles on planned scheduled routes. Maximum Vehicle Capacity is specified in the associated Vehicle Capacity Profile. | |
| Weight (%) | Percentage of the maximum available Weight capacity of assigned Vehicles that has been filled (loaded). Maximum Vehicle Capacity is specified in the associated Vehicle Capacity Profile. | |
| Pieces Planned | Total planned Pieces amount of all Destinations on planned scheduled routes, in number of units. (Shown only if Vehicle Capacity Profile of assigned Vehicle has Weight value.) | |
| Pieces Available | Total available Pieces capacity of assigned Vehicles on planned scheduled routes, in number of units. Maximum Vehicle Capacity is specified in the associated Vehicle Capacity Profile. | |
| Pieces (%) | Percentage of the maximum available Pieces capacity of assigned Vehicles that has been filled (loaded), in number of units. Maximum Vehicle Capacity is specified in the associated Vehicle Capacity Profile. | |
| Totals | ||
| Routes | Total number of planned routes scheduled for the specified timeframe. | |
| Destinations | Total number of Destinations included in planned routes scheduled for the specified timeframe. | |
| Orders | Total number of Orders scheduled for the specified timeframe regardless of their current Order Status. | |
| Users | Total number of Users assigned to routes scheduled for the specified timeframe. | |
| Vehicles | Total number of Vehicles assigned to routes scheduled for the specified timeframe. | |
| Cube | Total Cube (volume) of planned routes scheduled for the specified timeframe. (Vehicle Capacity Profile doesn’t effect this this value) | |
| Weight | Total Weight value of planned routes scheduled for the specified timeframe. (Vehicle Capacity Profile doesn’t effect this this value) | |
| Pieces | Total number of Pieces on planned routes scheduled for the specified timeframe, in number of units. (Vehicle Capacity Profile doesn’t effect this this value) | |
| Cost per Destination | Average cost per Destination across all routes scheduled for the specified timeframe. | |
| Cost per Hour | Total cost of all Destinations divided by the total Route Duration across all routes scheduled for the specified timeframe. | |
| Projected Time | ||
| Service Time | Total planned Service Time of all Destinations across all routes scheduled for the specified timeframe. | |
| Travel Time | Total planned Travel Time across all routes scheduled for the specified timeframe. | |
| Total Time | Total Planned Route Duration = Total Travel Time + Total Service Time + Wait Time + Breaks | |
| Projected Distance | ||
| Total | Total Planned Travel Distance across all routes scheduled for the specified timeframe. | |
| Actual Time | ||
| Smartphone | Actual Route Duration is calculated based on the received Mobile App GPS data. Duration is measured from when the route was started to when the route was ended by the assigned User on the Mobile App. | |
| Telematics | Actual Route Duration is calculated based on the received Telematics GPS data. | |
| Merged | Actual Route Duration is calculated based on the received Mobile App and Telematics GPS data. | |
| Travel Time | Actual Travel Time traveled by assigned Users across routes scheduled for the specified timeframe. Actual Travel Time is calculated based on the on-road Travel Time between Destinations and does not include time spent inside Geofences (Actual Service Time). | |
| Service Time | Actual Service Time of all Destinations across routes scheduled for the specified timeframe. Actual Service Time is the time assigned Users spend inside Destination Geofences. | |
| Actual Distance | ||
| Smartphone | Actual Travel Distance traveled by assigned Users across routes scheduled for the specified timeframe. Actual Travel Distance is calculated based on the on-road Travel Distance between Destinations and does not include distance traveled inside Geofences. | |
| Telematics | Actual Travel Distance traveled by assigned Users across routes scheduled for the specified timeframe. Actual Travel Distance is calculated based on the on-road Travel Distance between Destinations and does not include distance traveled inside Geofences. | |
| Merged | Actual Travel Distance traveled by assigned Users across routes scheduled for the specified timeframe. Actual Travel Distance is calculated based on the on-road Travel Distance between Destinations and does not include distance traveled inside Geofences. | |
| Emissions CO2 | The CO₂ Emissions of assigned Vehicles across routes scheduled for the specified timeframe. Emissions are calculated based on the Vehicle Fuel Type and Fuel Consumption settings. If no Fuel Type is specified in the Vehicle Profile, gasoline is used for the calculation; if no Fuel Consumption is specified, 10mpg is used for the calculation. | |
| Compliance | ||
| Notes | Total number of Notes attached to Destinations across routes scheduled for the specified timeframe. Normally, Notes are attached to Destinations by the assigned User using the Mobile App. | |
| Signatures | Total number of customer signatures attached to Destinations across routes scheduled for the specified timeframe. Normally, customer signatures are captured by and attached to Destination Notes by the assigned User using the Mobile App. | |
| Images | Total number of images (photos) attached to Destinations across routes scheduled for the specified timeframe. Normally, images are captured by and attached to Destination Notes by the assigned User using the Mobile App. | |
| Forms | Total number of Forms attached to Destinations across routes scheduled for the specified timeframe. Normally, Forms are attached to Destination Notes by the assigned User using the Mobile App. | |
| Workflows | ||
| Completed | Percentage of planned Destination Workflows completed across routes scheduled for the specified timeframe. A Workflow is completed when all mandatory tasks are successfully executed and the Destination is marked as “Done” on the Mobile App. | |
| Pending | Percentage of planned Destination Workflows not yet completed across routes scheduled for the specified timeframe. A Workflow is completed when all mandatory tasks are successfully executed and the Destination is marked as “Done” on the Mobile App. | |
| Failed | Percentage of failed Destination Workflows across routes scheduled for the specified timeframe. A Workflow is failed when any mandatory tasks are not successfully completed and the Destination is marked as “Failed” on the Mobile App. | |
| Users | ||
| Name | Name of the User associated with the corresponding data or asset. | |
| Email address of the Userassociated with the corresponding data or asset. This is also the email address used by the user to sign in to Route4Me’s Web Software. | ||
| Vehicle | ||
| Name | Alias or name of the vehicle associated with the corresponding asset or data. Can be used to easily find vehicles in the Vehicles List and other interfaces. | |
| Type | Vehicle’s dimensions and usage settings, as well as any specialized regulations or restrictions associated with the vehicle. | |
| License Plate | Vehicle’s unique license plate number, issued for identification. | |
| VIN | Vehicle Identification Number, a unique code used to identify the vehicle. | |
| Vehicles | Total number of vehicles with the corresponding Vehicle Type. This column is only available in the Vehicle Types category. | |
| Route | ||
| Name | Alias or name of the route associated with the corresponding asset or data. Can be used to easily find routes in the Routes List and other interfaces. | |
| Scheduled for | Date the respective route is scheduled for (Planned Route Start Date). | |
| User | User assigned to the respective route. | |
| Vehicle | Vehicle assigned to the respective route. | |
| Facility | ||
| Name | Name or alias of the Facility associated with the corresponding asset or data. | |
| Type | Customizable type of the Facility associated with the corresponding asset or data. | |
| State | ||
| State Name | Name of the state in which the corresponding asset or data is located. | |
| Orders | ||
| Total | Total number of Orders scheduled for the specified timeframe regardless of their current Order Status. | |
| Scheduled | Total number of Orders that currently have the the “Scheduled” status scheduled for the specified timeframe. | |
| Scheduled (%) | Percentage of total Orders that currently have the “Scheduled” status scheduled for the specified timeframe. | |
| Pending | Total number of Orders scheduled for the specified timeframe with a Pending status: New, Possession Scan, Sorted, Loaded, Manually Loaded, Routed, Unrouted, Sorted by Route, Route Started, Pick Up Scan, Hold for Pickup. | |
| Pending (%) | Percentage of total Orders scheduled for the specified timeframe with a Pending status: New, Possession Scan, Sorted, Loaded, Manually Loaded, Routed, Unrouted, Sorted by Route, Route Started, Pick Up Scan, Hold for Pickup. | |
| Sorted | Total number of Orders scheduled for the specified timeframe that currently have or had the “Sorted” status at any point. | |
| Sorted (%) | Percentage of total Orders scheduled for the specified timeframe that currently have or had the “Sorted” status at any point. | |
| Scanned | Total number of Orders scheduled for the specified timeframe that currently have or had the “Scanned” status at any point. | |
| Scanned (%) | Percentage of total Orders scheduled for the specified timeframe that currently have or had the “Scanned” status at any point. | |
| Completed | Total number of Orders scheduled for the specified timeframe that currently have the “Closed” (Done) status. | |
| Completed (%) | Percentage of total Orders scheduled for the specified timeframe that currently have the “Closed” (Done) status. | |
| Canceled | Total number of Orders scheduled for the specified timeframe that currently have the “Canceled” status. | |
| Canceled (%) | Percentage of total Orders scheduled for the specified timeframe that currently have the “Canceled” status. | |
| Unable to deliver | Total number of Orders scheduled for the specified timeframe that currently have the “Unable to Deliver” status. | |
| Unable to deliver (%) | Percentage of total Orders scheduled for the specified timeframe that currently have the “Unable to Deliver” status. | |
NOTE: The different Dashboard categories support different data columns. You can see which category supports which data column types in the table below. Specifically, see which top headers are available in which data table tabs.
| Column | Summary | Users | Vehicles | Vehicle Types | Routes | Facilities | States | Orders |
|---|---|---|---|---|---|---|---|---|
| Period | ||||||||
| Arrivals | ||||||||
| Departures | ||||||||
| Performance (Actual vs Planned) | ||||||||
| Utilization | ||||||||
| Totals | ||||||||
| Projected Time | ||||||||
| Projected Distance | ||||||||
| Actual Time | ||||||||
| Actual Distance | ||||||||
| Compliance | ||||||||
| Workflows | ||||||||
| User | ||||||||
| Vehicle | ||||||||
| Route | ||||||||
| Facility | ||||||||
| States | ||||||||
| Orders |
Export Analytics – Download Business Performance Data Spreadsheet
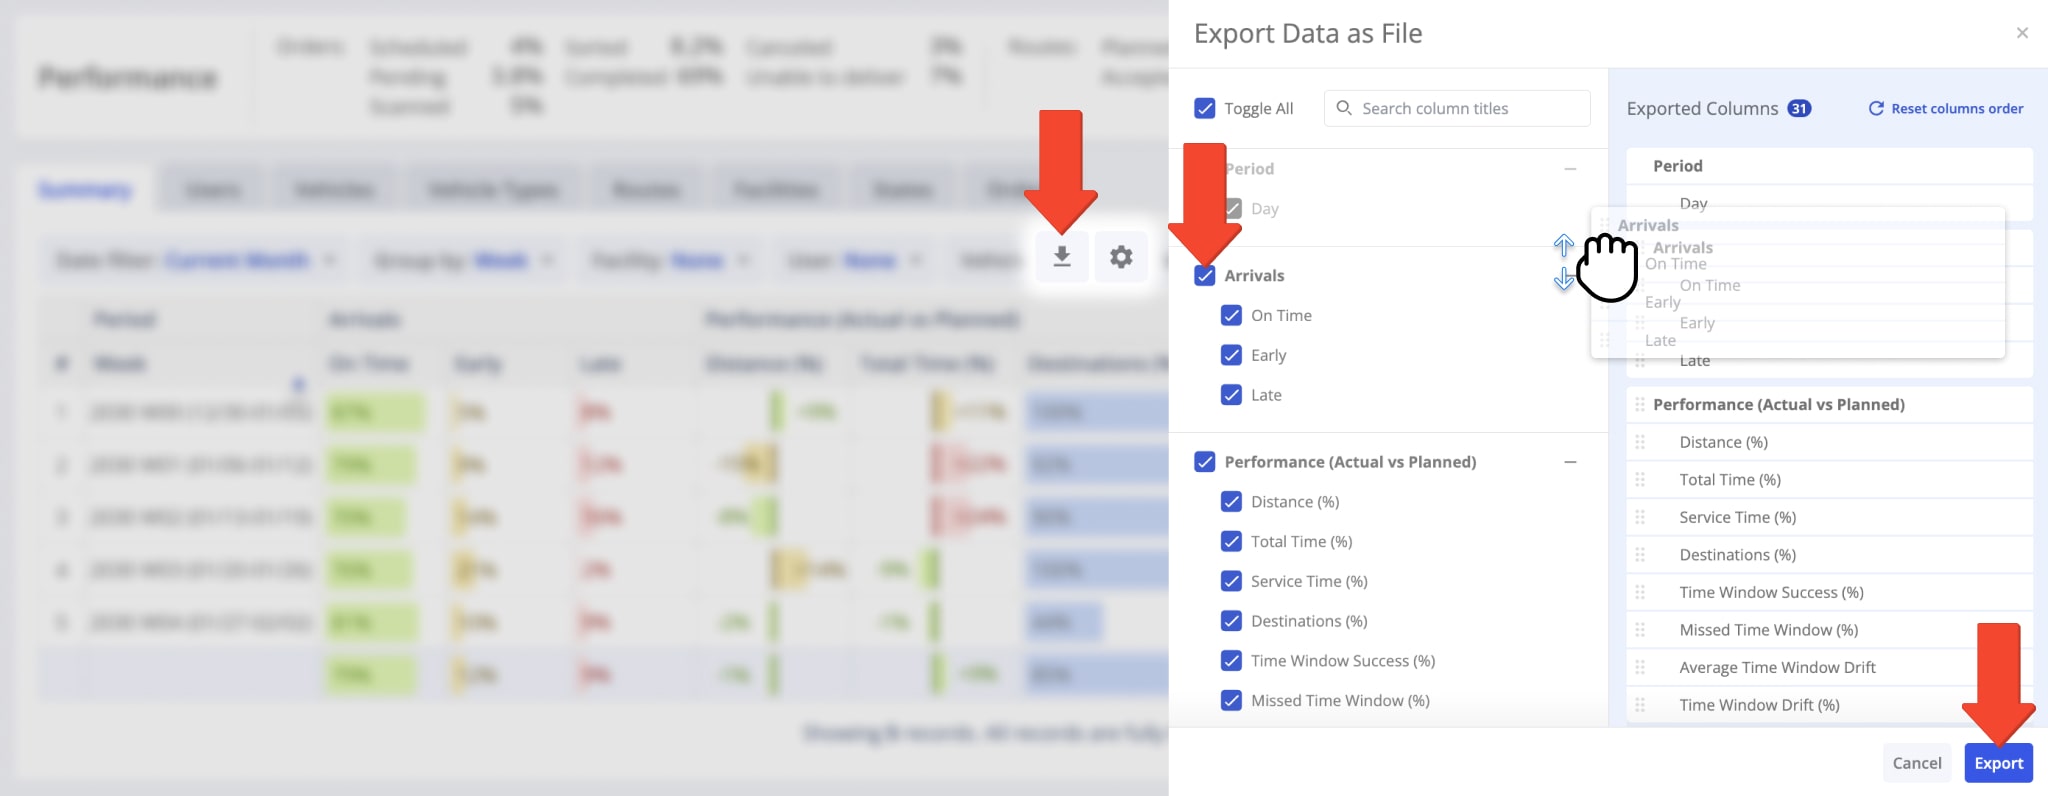
After you’ve filtered and adjusted the Dashboard to your preference, you can easily export a spreadsheet with performance analytics. To do so, simply click the Download Button.
The “Export Data as File” panel will open, where you can customize which KPI data columns you want to include in your exported performance spreadsheet. Enable data columns by checking the boxes next to them and change their order by dragging column names on the right. When done, click the “Export” button to download your customized analytics file.
Visit Route4Me's Marketplace to Check out Associated Modules:
- Operations
Audit Logging and Activity Stream
- Operations
Custom Data Add-On
- Operations
Advanced Team Management Add-On
About author: Alex Yasko
Alex Yasko is the Go-to-Market Product Manager and Information Architecture Manager at Route4Me. With thousands of hours of experience, Alex specializes in breaking down complex last-mile optimization and routing scenarios into simple, actionable instructions, helping last-mile businesses streamline their operations effortlessly.