Route Performance Metrics – Track Route Progress And Efficiency
The Routes Page’s Performance Metrics panel gives enterprise businesses a clear view of route progress and operational efficiency. Learn how to use the panel to review key statistics and compare averages and totals across routes. Using these insights supports last mile route optimization, helping teams quickly assess performance, identify trends, and validate planning decisions.
Table of Contents
Performance Metrics Panel – Open And Navigate The Panel
To begin, open your Routes Page. Go to “Dynamic Routing” > “Routes” from the Navigation Menu or click the button below.
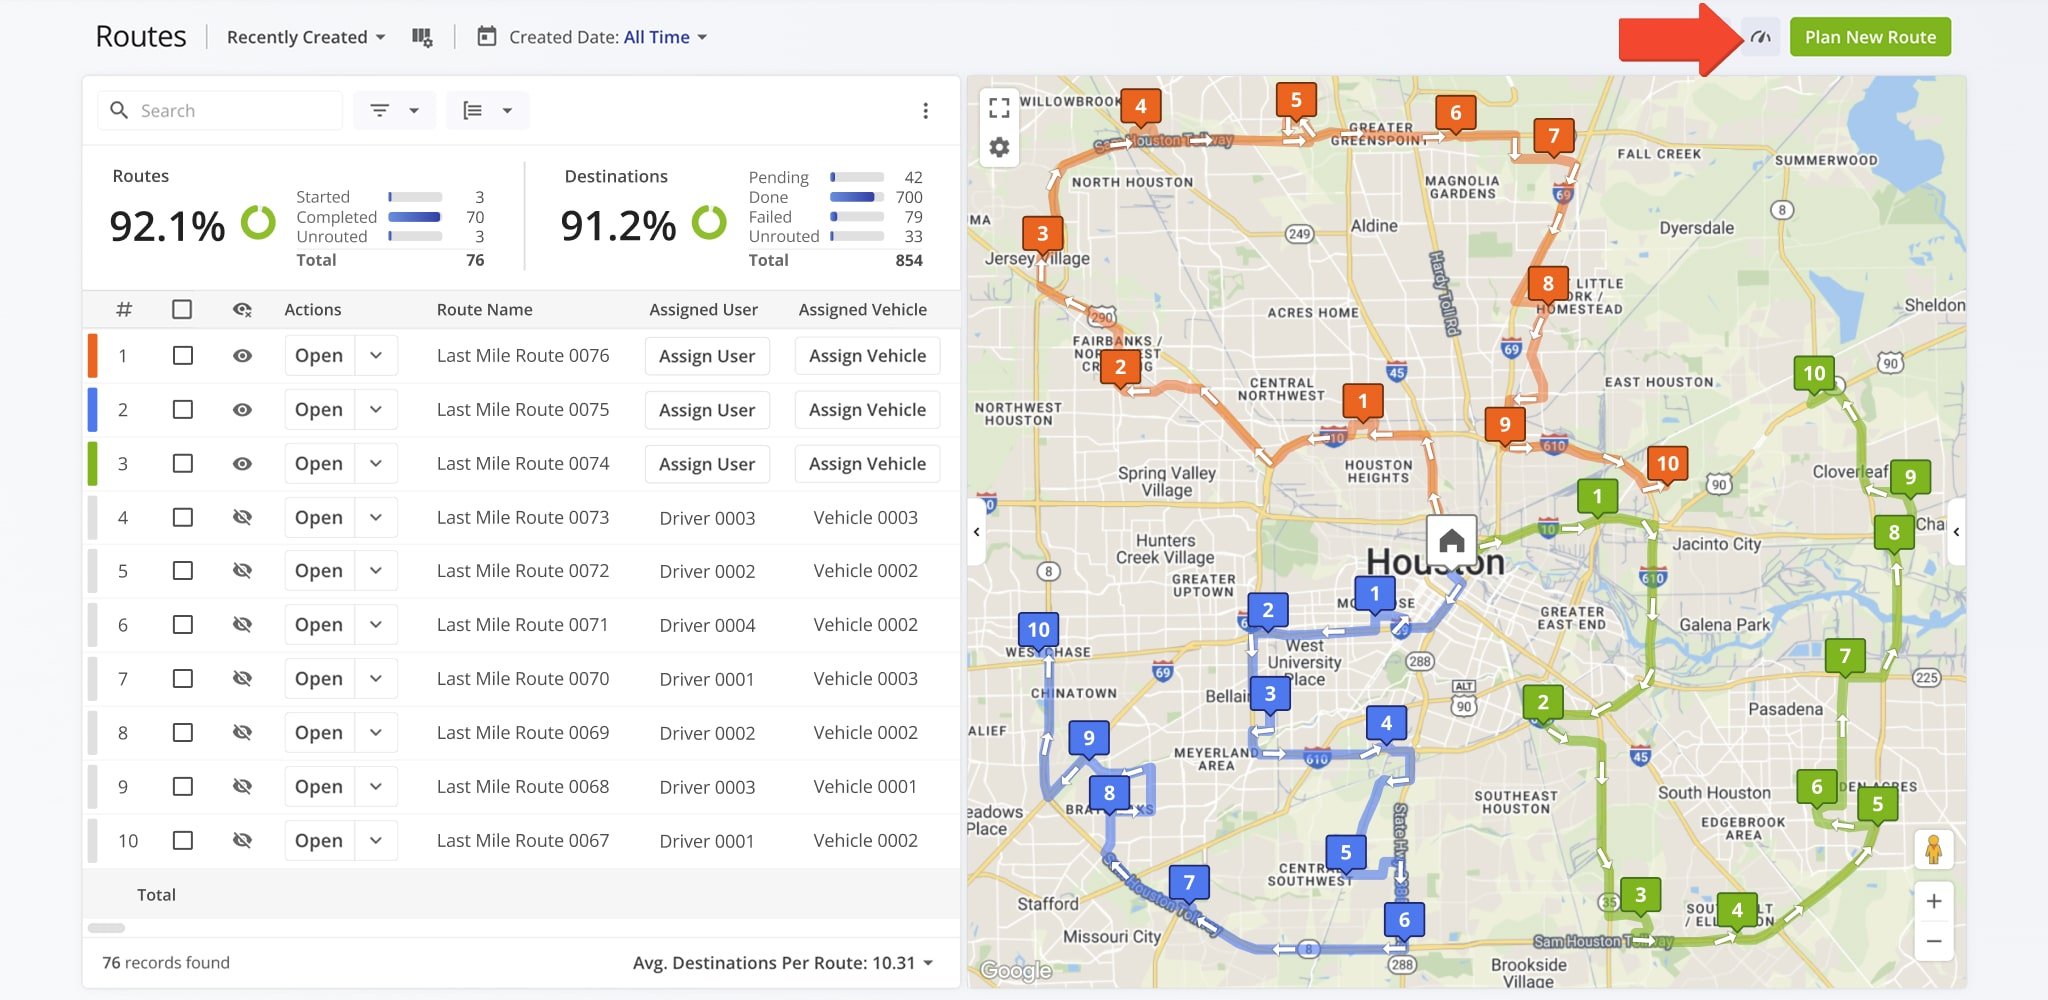
Then, to open the Performance Metrics panel, click the Performance Metrics Icon in the top-right corner of the Routes Page. For convenience, the panel is open by default. To close it, simply click the Icon again.
The panel displays statistics for the routes currently visible on your Routes Page, updating automatically as filters or view modes change. This allows you to see key performance data for the routes you are reviewing without navigating away from the page.
Track Route Progress And Efficiency – Monitor Key Metrics
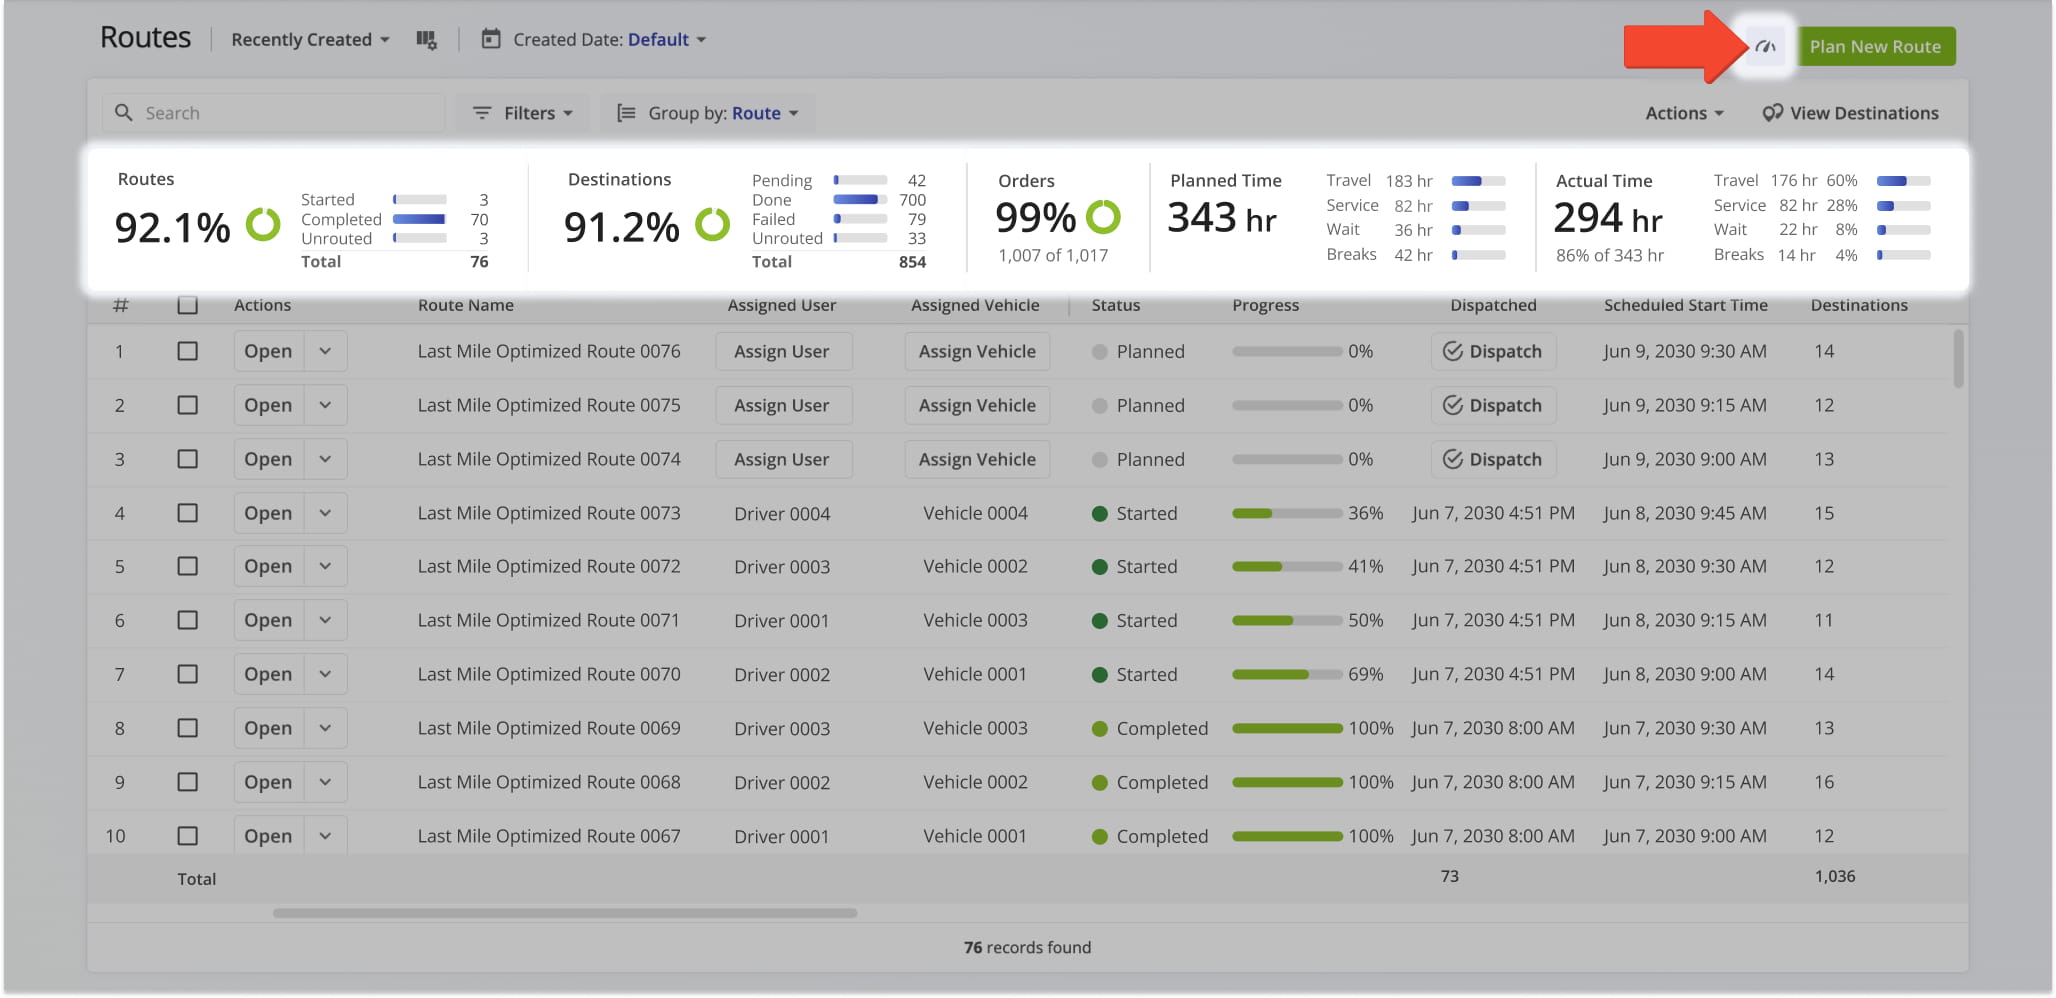
The Performance Metrics panel provides a summary of route performance for the routes displayed on your Routes Page. It helps you quickly monitor progress, track efficiency, and evaluate operational performance across one or multiple routes.
Detailed explanations of each metric are provided in the table below.
| Metric | Description |
|---|---|
| Routes | Displays the total percentage of routes an the number of those routes marked as Started, Completed, and Unrouted. |
| Destinations | Displays the percentage of total destinations and the number of those destinations marked as Pending, Done, Failed, or Unrouted. |
| Orders | Displays the number and percentage of Customer Orders that have been completed. |
| Planned Time | Displays the total planned duration for all routes, along with an hourly breakdown of time allotted for Travel, Service, Wait, and Breaks. |
| Actual Time | Displays the total number and percentage of the actual duration for all routes, along with a breakdown of actual time spent on Travel, Service, Wait, and Breaks. |
Route Performance Analysis – Compare Averages And Totals
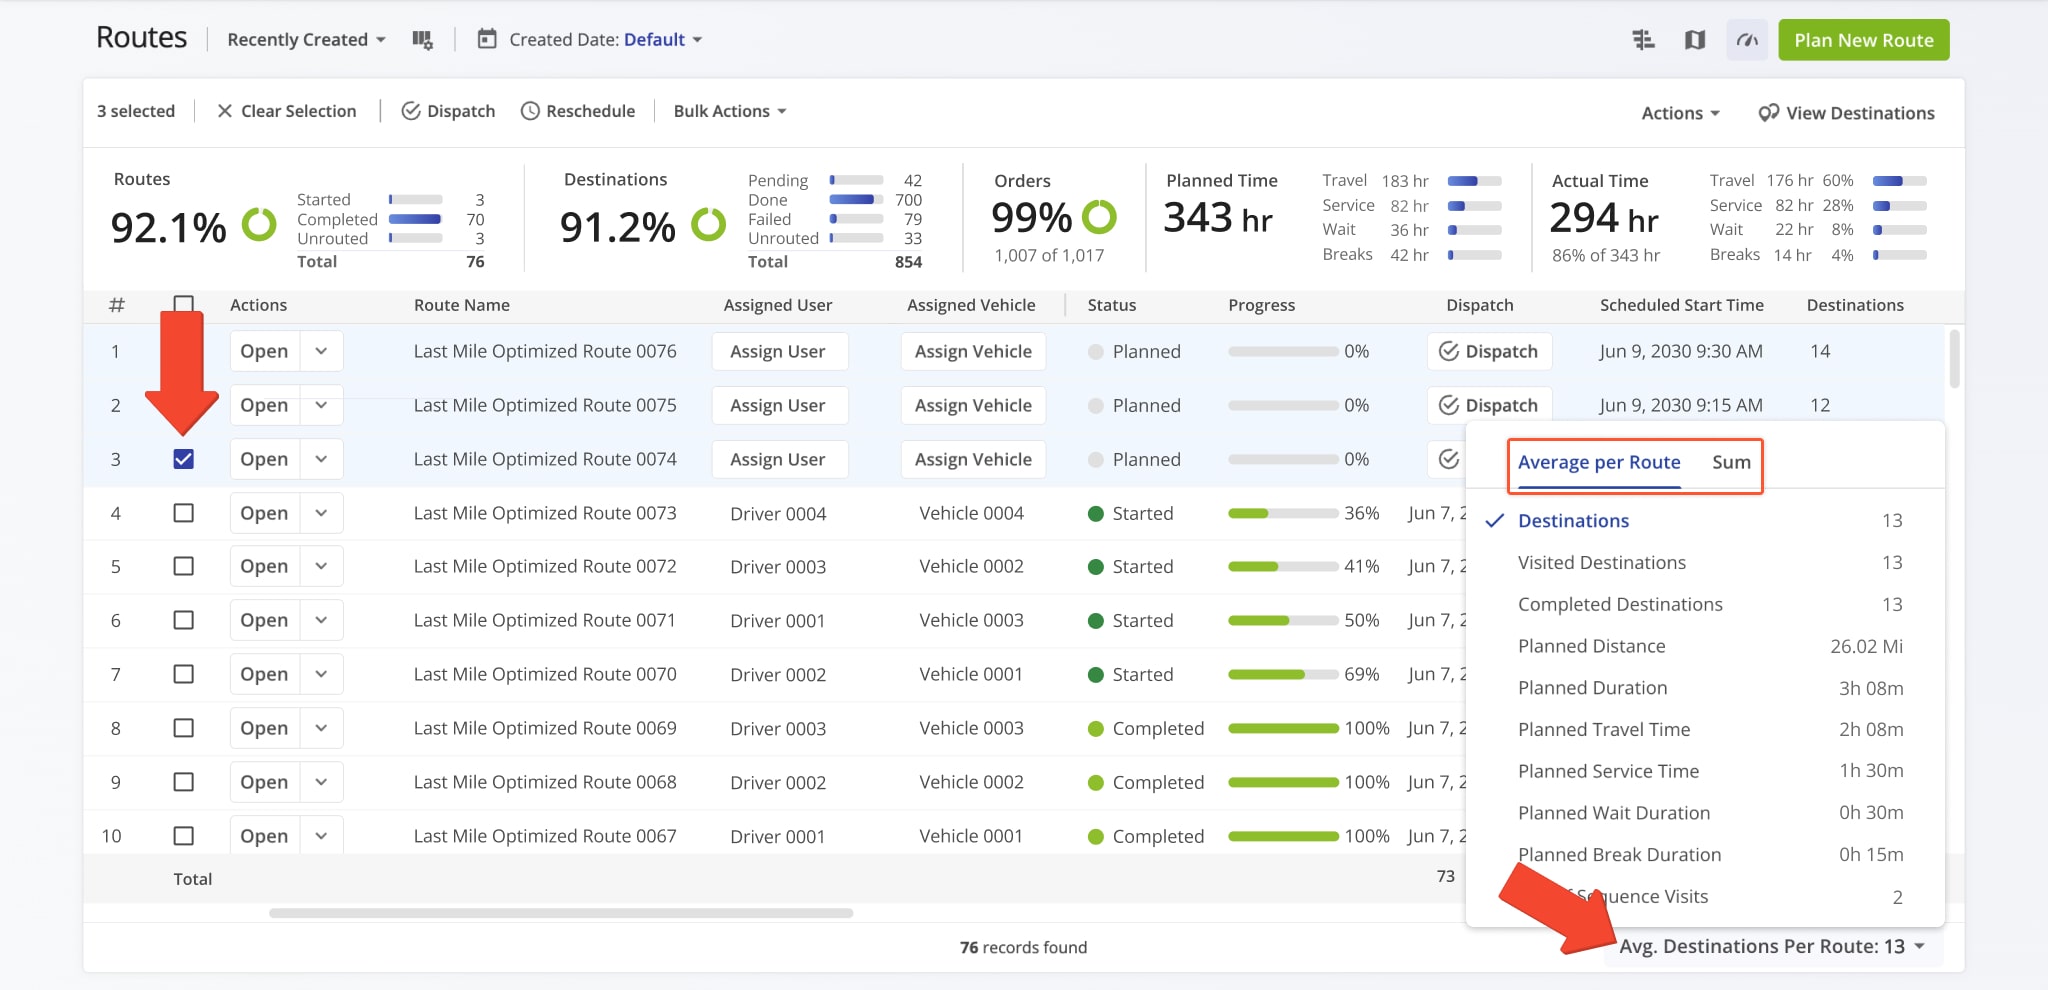
You can view additional performance statistics by selecting one or more routes from your Routes List. When routes are selected, the “Avg. Completed Destinations Per Route” button appears in the bottom-right corner of the screen.
Clicking the button opens two views: the “Average per Route” view, which shows metrics for a single route, and the “Sum” view, which displays combined totals across all selected routes.
These views help you quickly compare individual route performance with overall results. Detailed explanations of each metric are provided in the table below.
| Metric | Description |
|---|---|
| Destinations | Displays the total number of destinations across all statuses: Planned, Scheduled, Started and Completed. |
| Visited Destinations | Displays the number of destinations marked as Completed. |
| Planned Distance | Displays the total distance planned for the selected routes based on their original route plans. |
| Planned Duration | Displays the total planned time required to complete the selected routes. |
| Planned Travel Time | Displays the amount of time planned for driving between destinations. |
| Planned Service Time | Displays the amount of time planned for completing service at destinations. |
| Planned Wait Duration | Displays the amount of time planned for waiting at destinations or between stops. |
| Planned Break Duration | Displays the amount of time planned for breaks. |
| Out Of Sequence | Displays the number of destinations visited in a different order than originally planned. |
Visit Route4Me's Marketplace to Check out Various Modules and Add-Ons:
- Route Optimization
Time Windows
- Operations
Advanced Team Management Add-On