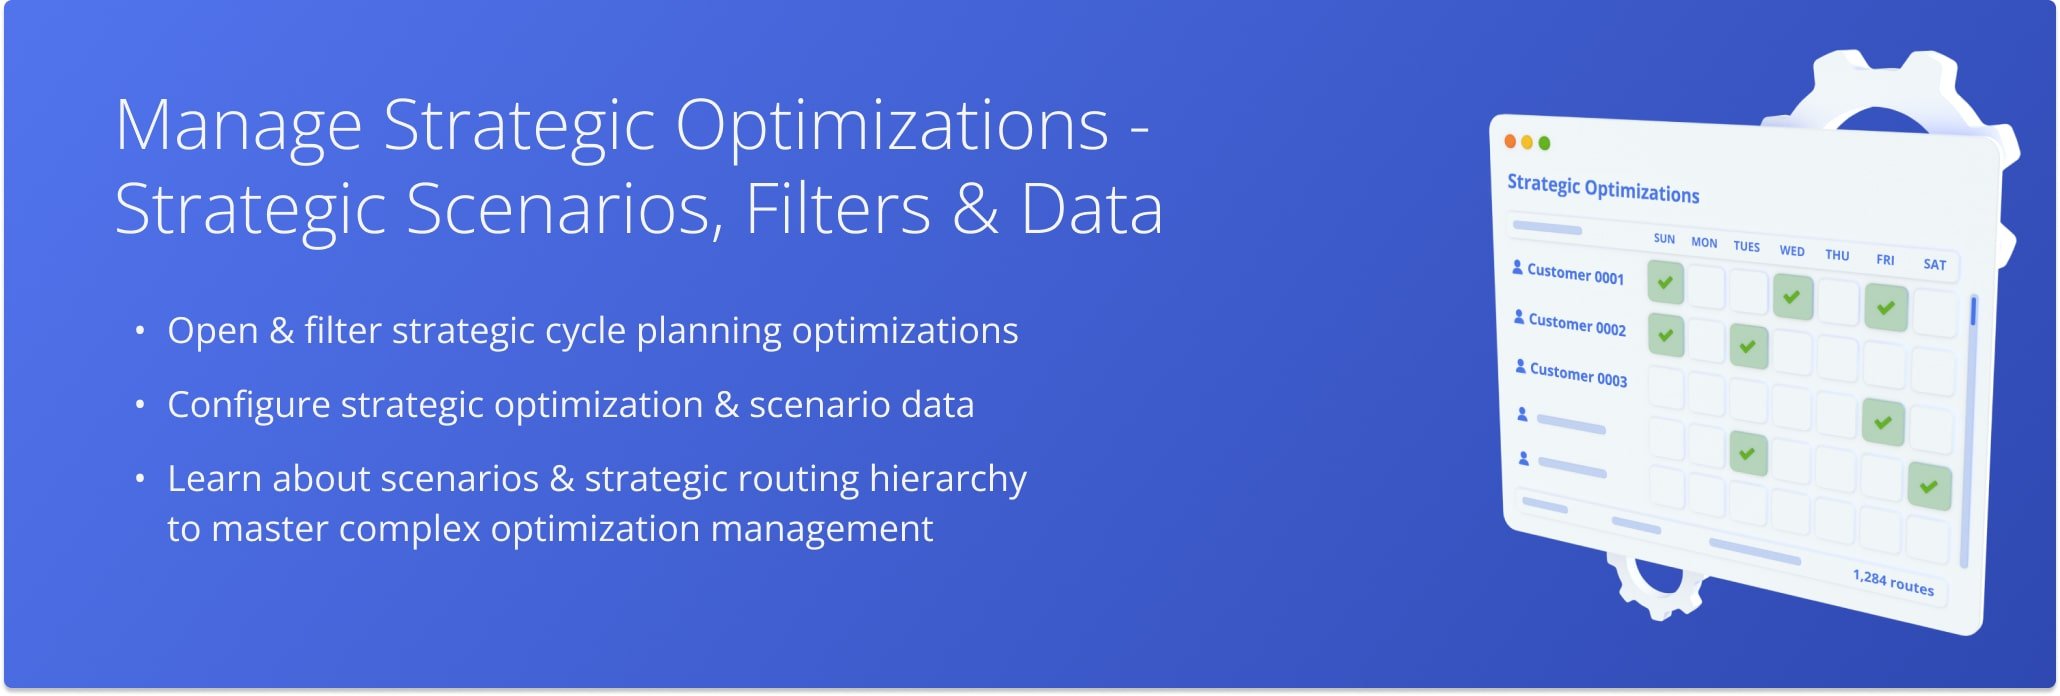
Manage Strategic Optimizations – Automated Strategic Cycle Planning With Recurring Routing
Route4Me’s Strategic Optimizations simplify complex strategic cycle planning for multi-frequency delivery and service schedules over extended planning periods. Sync data via SFTP, upload Customer addresses with schedules, and create recurring route plans for thousands of routes with weekly, bi-weekly, or other visit requirements with one click.
All you have to do is upload your data, and Route4Me’s enterprise route optimization API will handle the rest according to your recurring schedules. In this guide, you’ll learn how to open, filter, and manage your Optimizations.
NOTE: “Cycle” in Recurring Routing with Strategic Optimizations refers to an instance when a specific Recurring Schedule repeats.
Table of Contents
Strategic Optimizations And Scenarios With Recurring Route Schedules
When you create Strategic Optimizations, Route4Me will automatically generate the most efficient recurring route cycles and Scenarios according to your settings. You can find them in your account’s Strategic Optimizations.
Go to “Strategic Routing” > “Scenarios” from the Navigation Menu to manage Strategic Optimizations and their Scenarios.
Open Your Strategic Optimizations
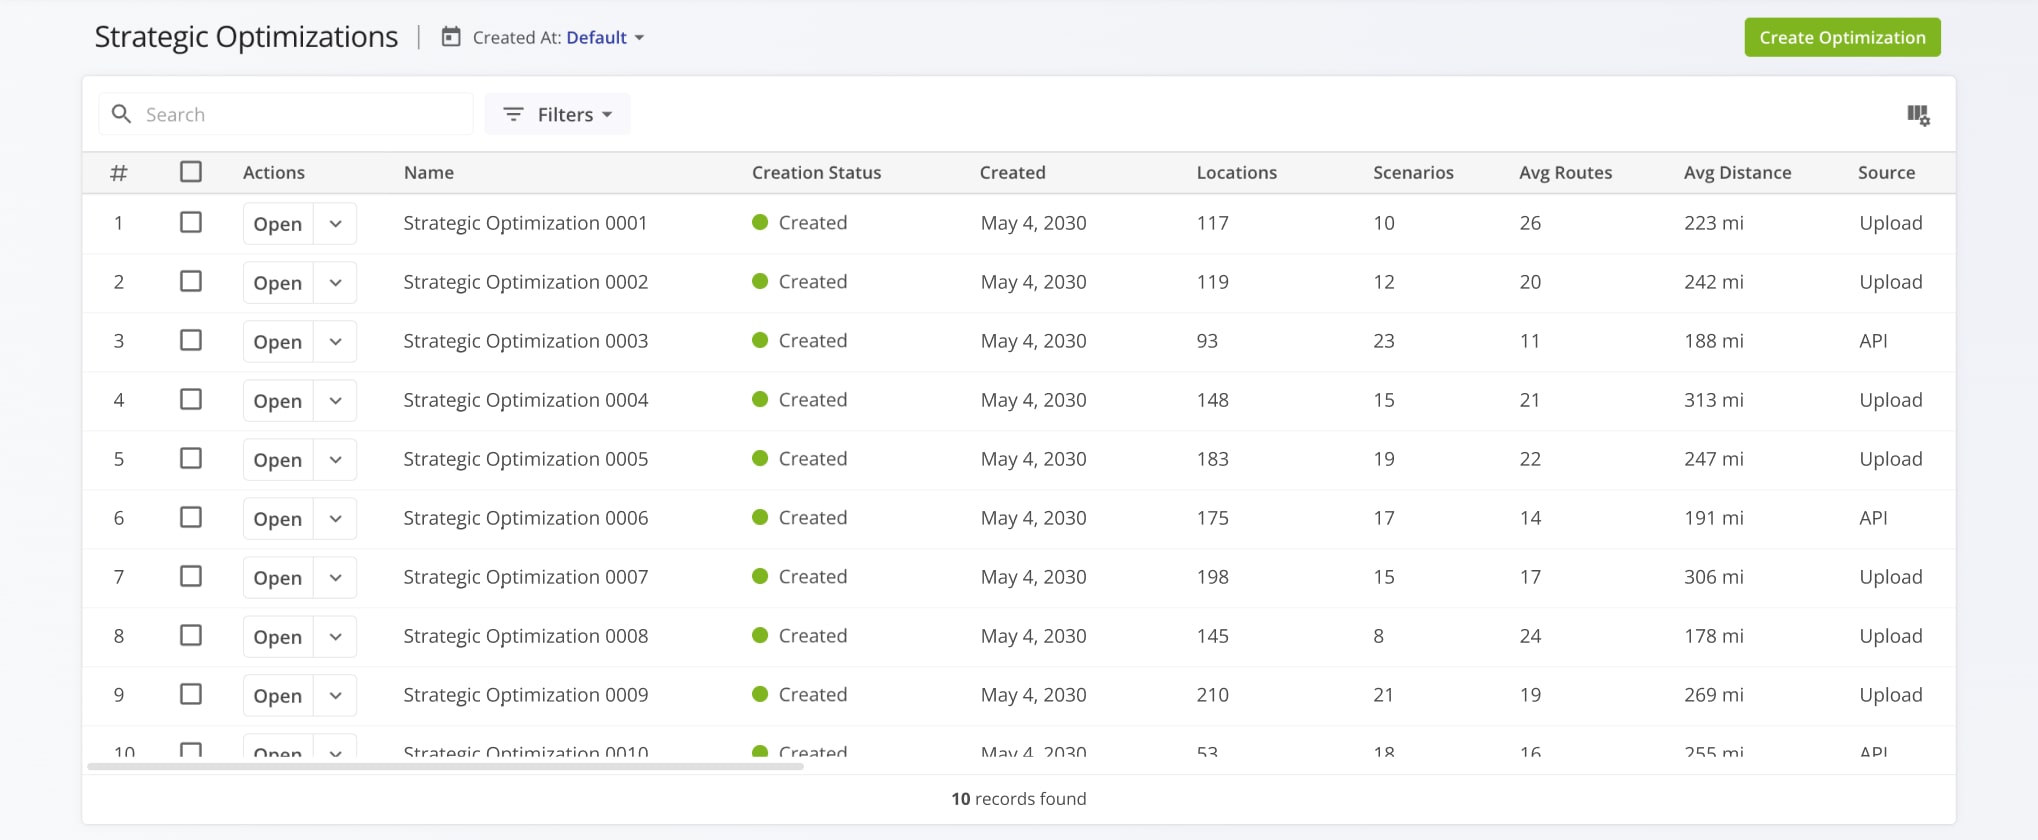
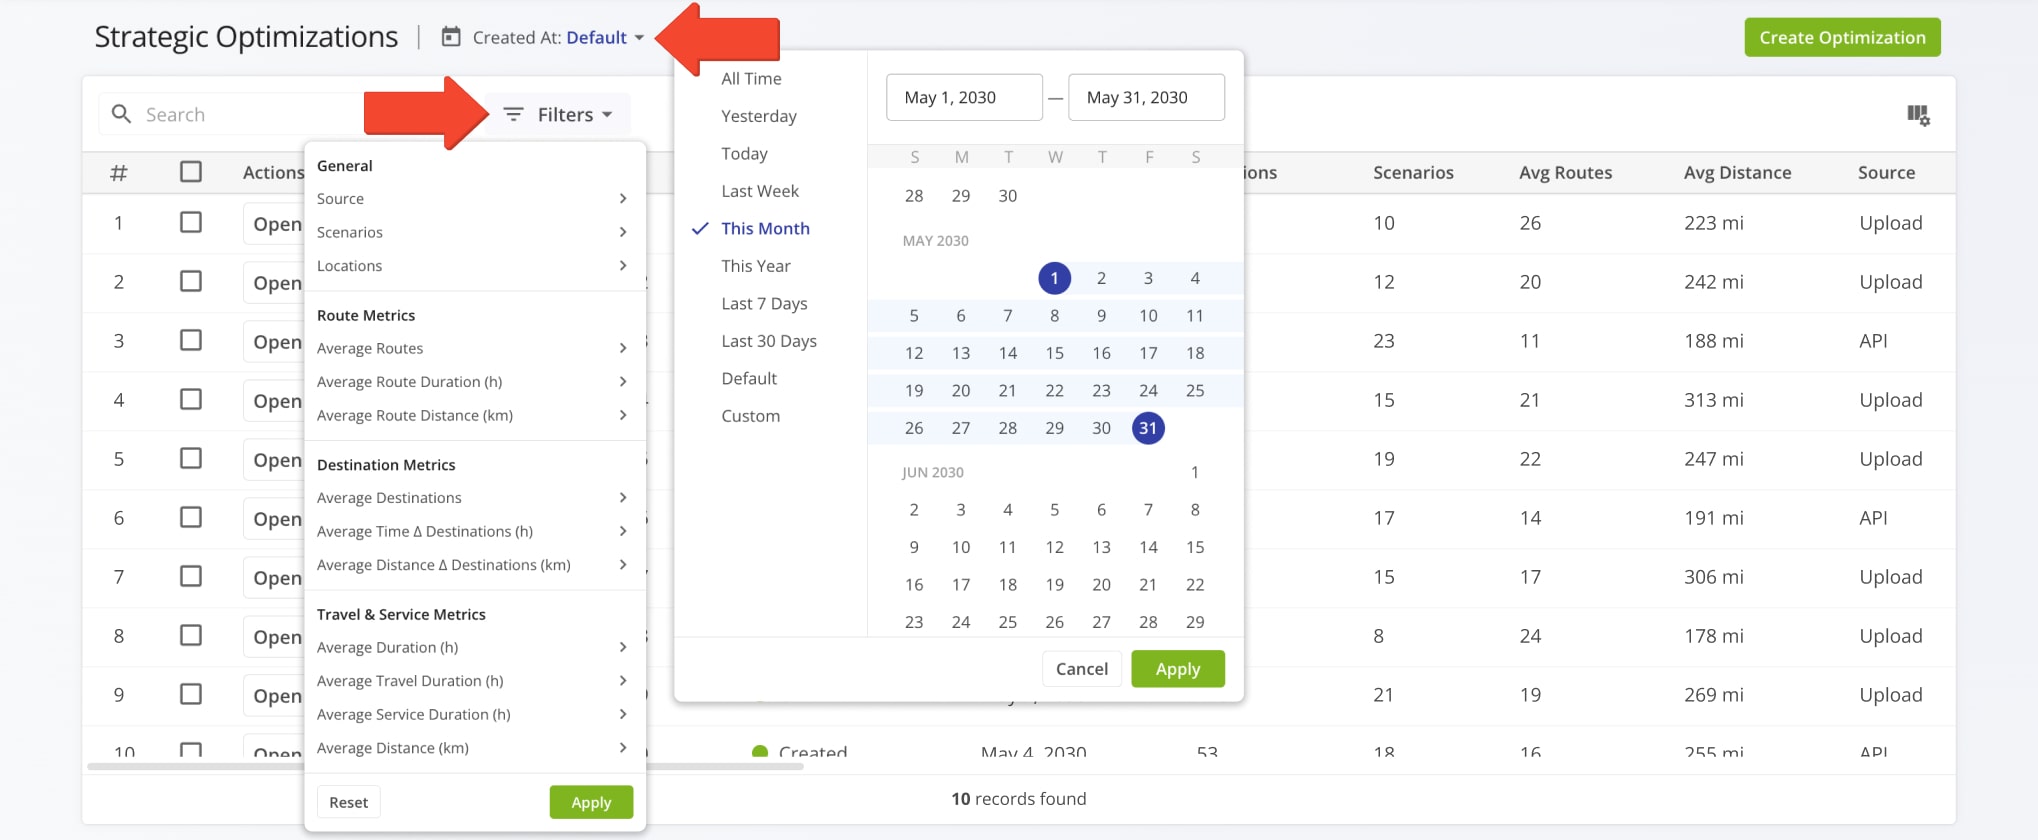
To find a specific Strategic Optimization on your account, you can use custom filters or search by name with the “Search” field. Click the “Created At” button to open the calendar and filter Optimizations by their creation date or time frame. Then, you can further refine the shown list by clicking the “Filters” button.
You can find a full list of Filters in the Strategic Optimizations Data Catalog.
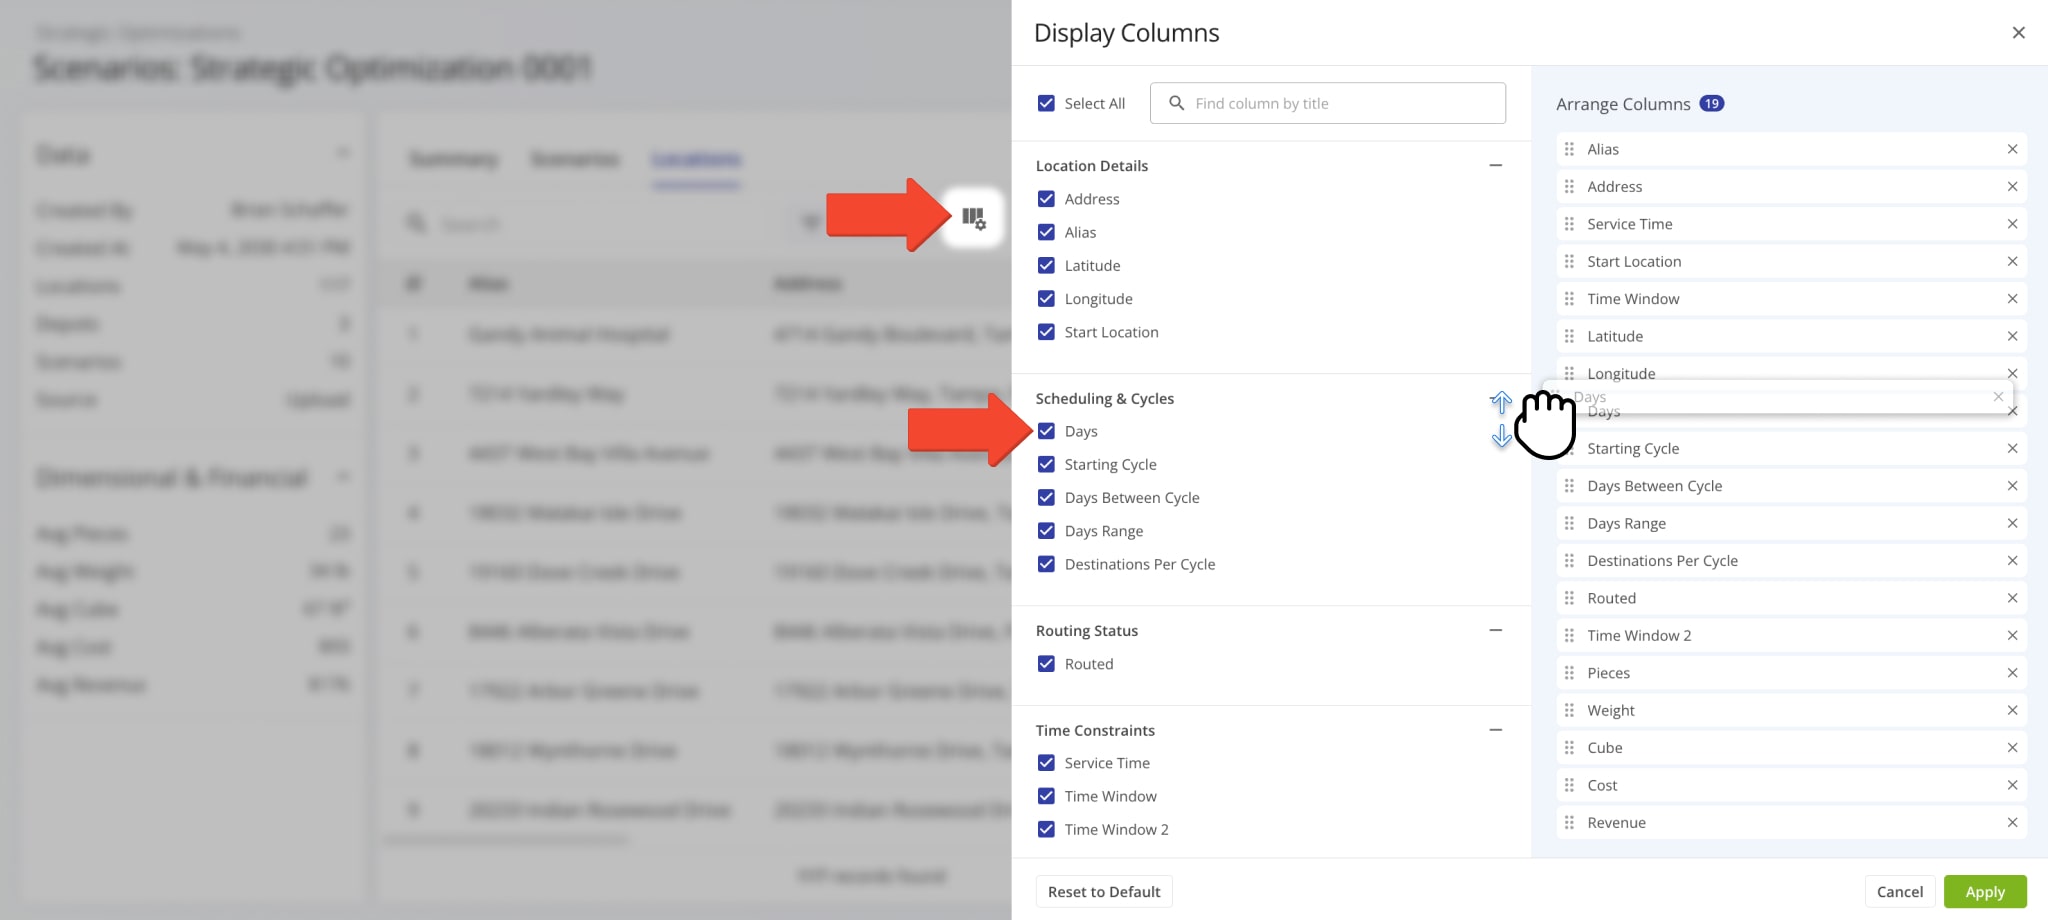
To customize the columns on your Strategic Optimizations page, click the Display Columns Button. Then, check the boxes next to columns you want to enable. You can change their positions by dragging column names. Click “Apply” to save your changes.
See the Strategic Optimizations Data Catalog for more details on the available data values.

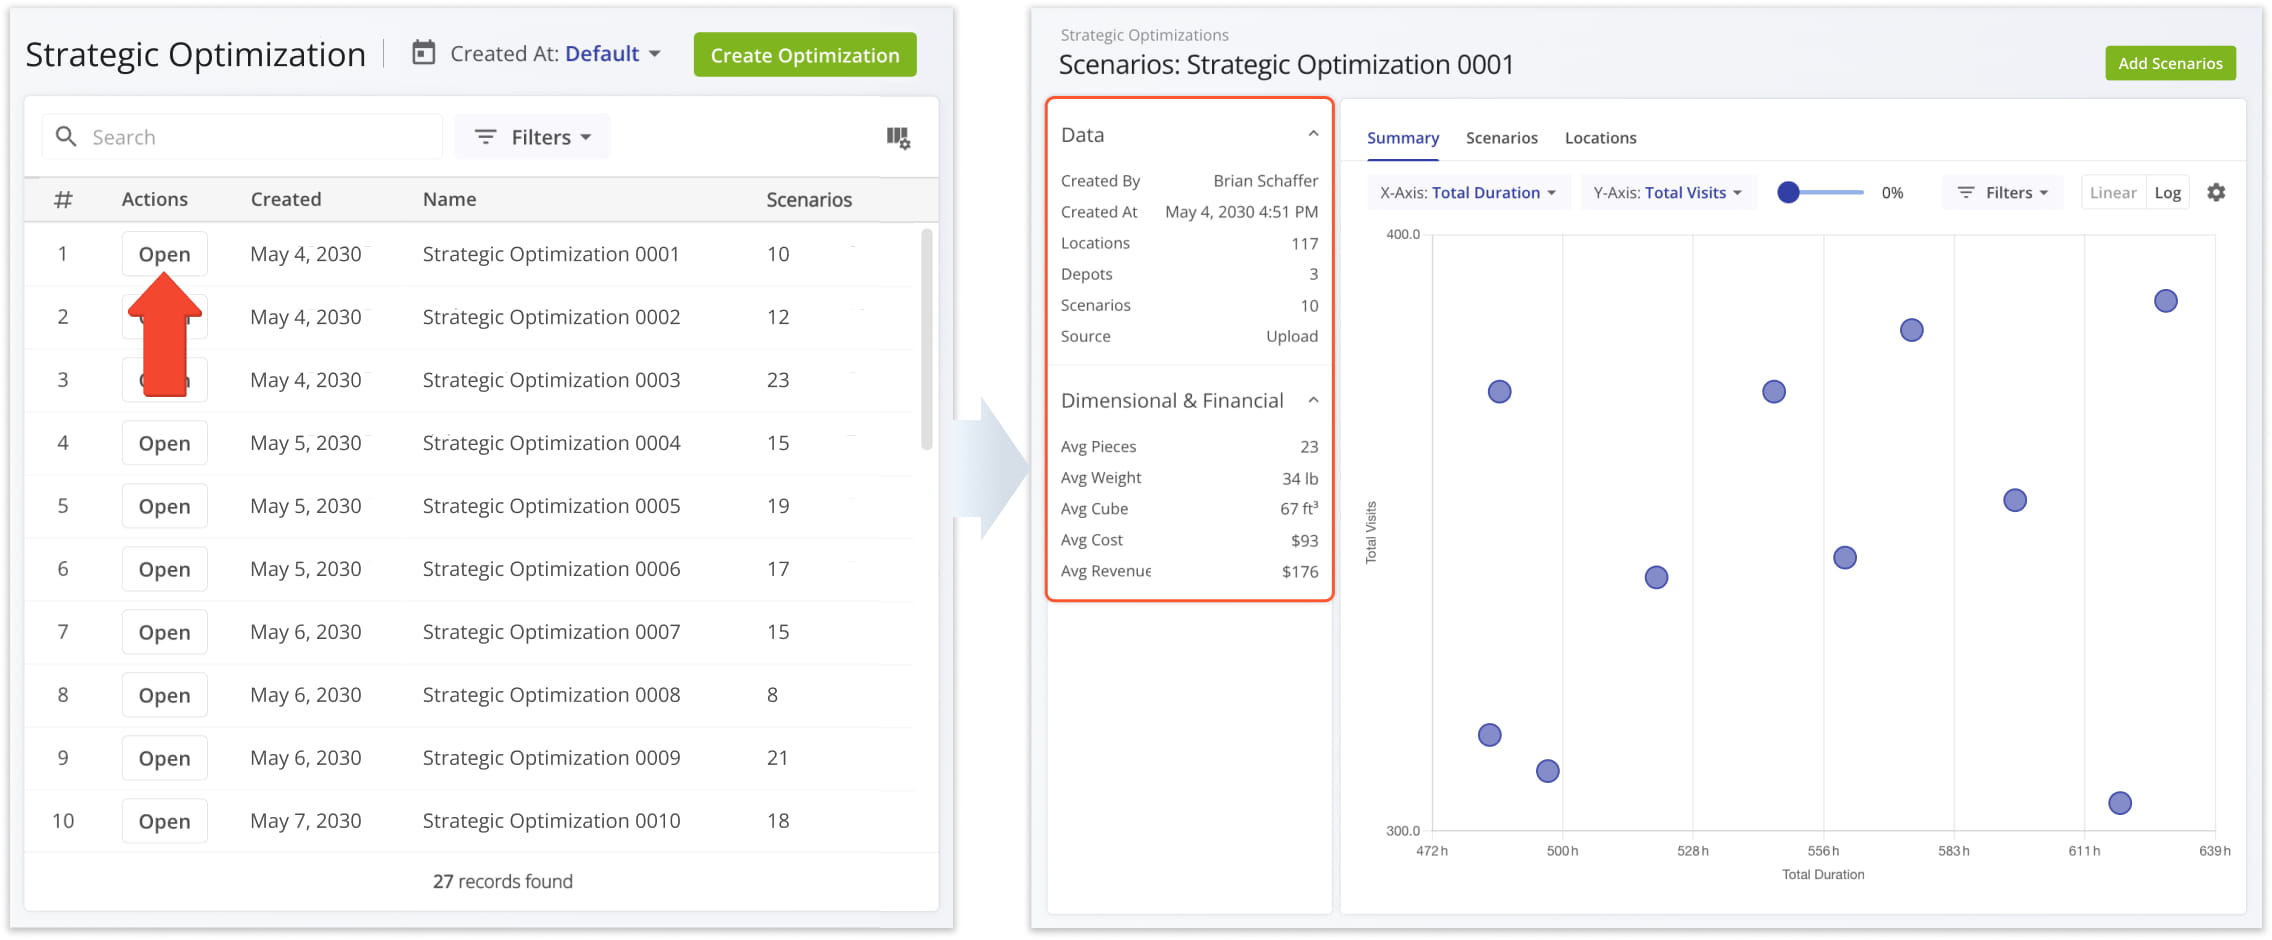
Strategic Optimizations provide an overview of your Recurring Routing Scenarios bundled into Optimizations. To view more detailed data about a specific Optimization and its associated Scenarios, click the “Open” button next to it.
After that, you can see a summary graph of the Scenarios included in the Strategic Optimization with a summary panel on the left that shows the Strategic Optimization’s data and average values for Strategic Route Orders.
Optimization Summary – Customizable Strategic Scenario Data Graph
The “Summary” tab is selected by default when you open a Strategic Optimization. You’ll see a customizable graph that maps the Optimization’s Scenarios according to your settings.
Hover over any point on the graph to see the graph values associated with that Scenario. You can also click the “Open” icon to go directly to that Scenario.
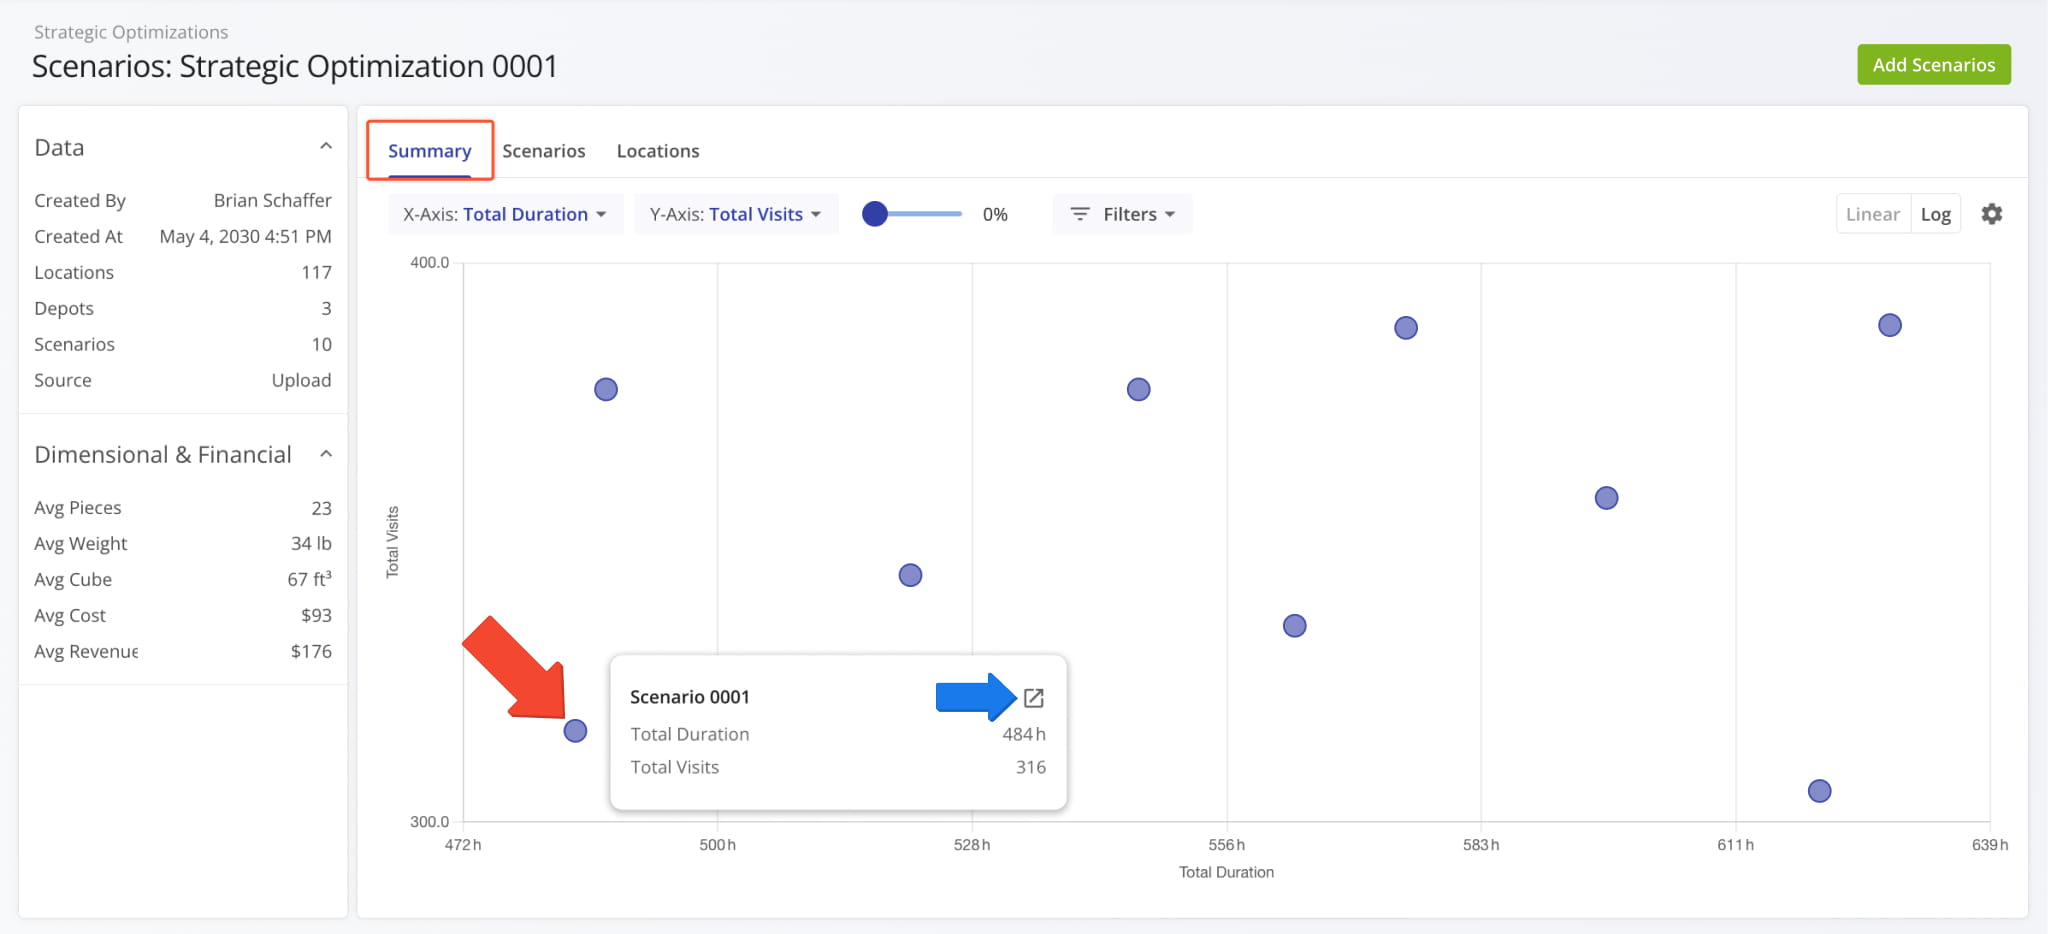
You can use the “X-Axis” and “Y-Axis” dropdown menus to customize the Strategic Optimization Summary. See the table below for a full list of available graph values.
To the right, you’ll find the scale slider which you can use to zoom in and out on the graph. Additional customization options include Scenario filters, linear and logarithmic graph modes, and graph settings. Keep reading to learn more about filtering and customizing your Strategic Optimization data.
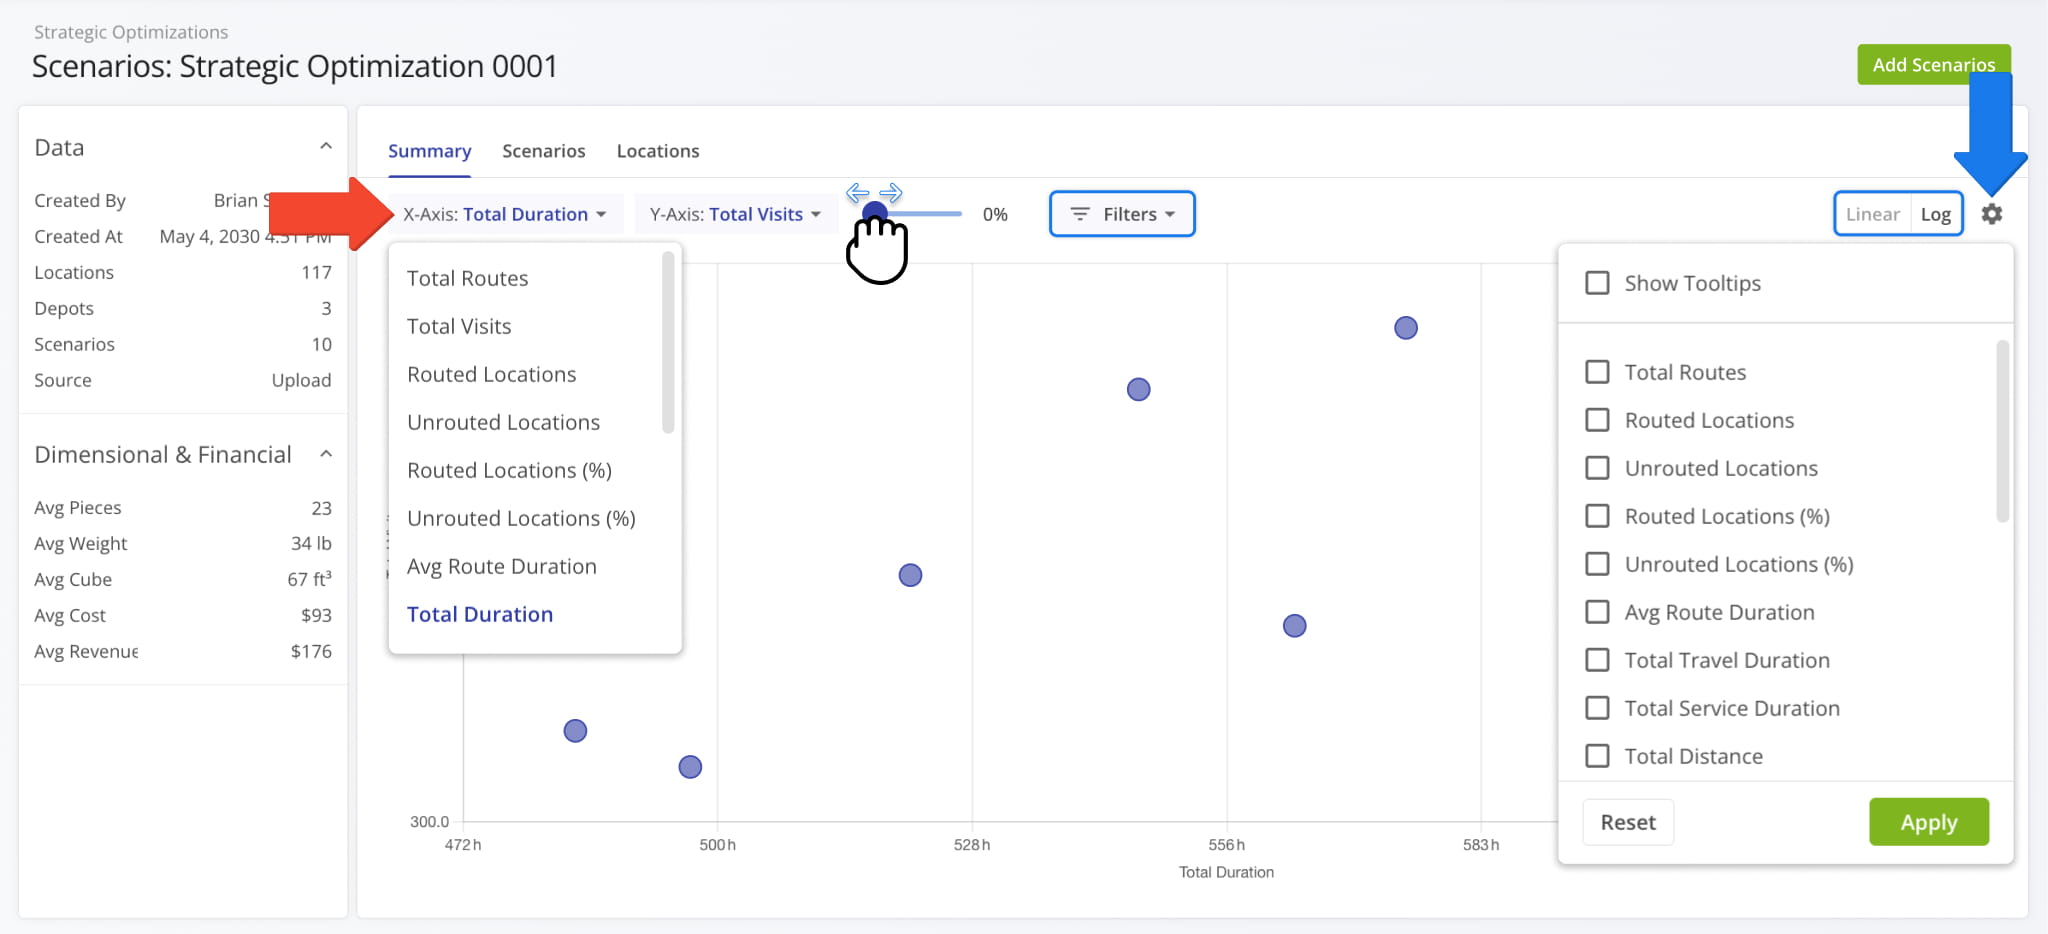
| Data Value | Description |
|---|---|
| Total Routes | Number of routes included in Scenarios. |
| Total Visits | Number of Destination visits included in Scenarios. |
| Routed Locations | Number of Locations used as Destinations in Scenario routes. |
| Unrouted Locations | Number of Locations not included in Scenario Routes. |
| Routed Locations (%) | Percentage of all Locations included in Scenario Routes. |
| Unrouted Locations (%) | Percentage of all Locations not included in Scenario Routes. |
| Avg Route Duration | Average duration of routes in Scenarios. |
| Total Duration | Total duration of routes in Scenarios. |
| Total Travel Duration | Total combined duration of Scenario route travel time. |
| Total Distance | Total combined distance of Scenario routes. |
| Avg Route Distance | Average distance of routes in Scenarios. |
| Days Count | Total number of days on which Scenario Routes are scheduled. |
| Avg Time between Destinations | Average time between destinations on routes included in Scenarios. |
| Avg Distance between Destinations | Average distance between destinations on routes included in Scenarios. |
| Total Travel Duration (%) | Percentage of total Scenario route duration taken up by travel time. |
| Total Service Duration (%) | Percentage of total Scenario route duration taken up by Service Time. |
| Total Weight | Total Weight value of Orders included in Scenario Routes. See the summary table on the left for the average value. |
| Total Cost | Total Cost value associated with in Scenario Routes. See the summary table on the left for the average value. |
| Total Revenue | Total Revenue generated by completing Scenario Routes. See the summary table on the left for the average value. |
| Total Cube | Total Cube value (physical volume) of Orders included in Scenario Routes. See the summary table on the left for the average value. |
| Total Pieces | Total number of Pieces (units) of Orders included in Scenario Routes. See the summary table on the left for the average value. |
Optimization Scenarios – Customizable Strategic Optimization Scenarios Data Table
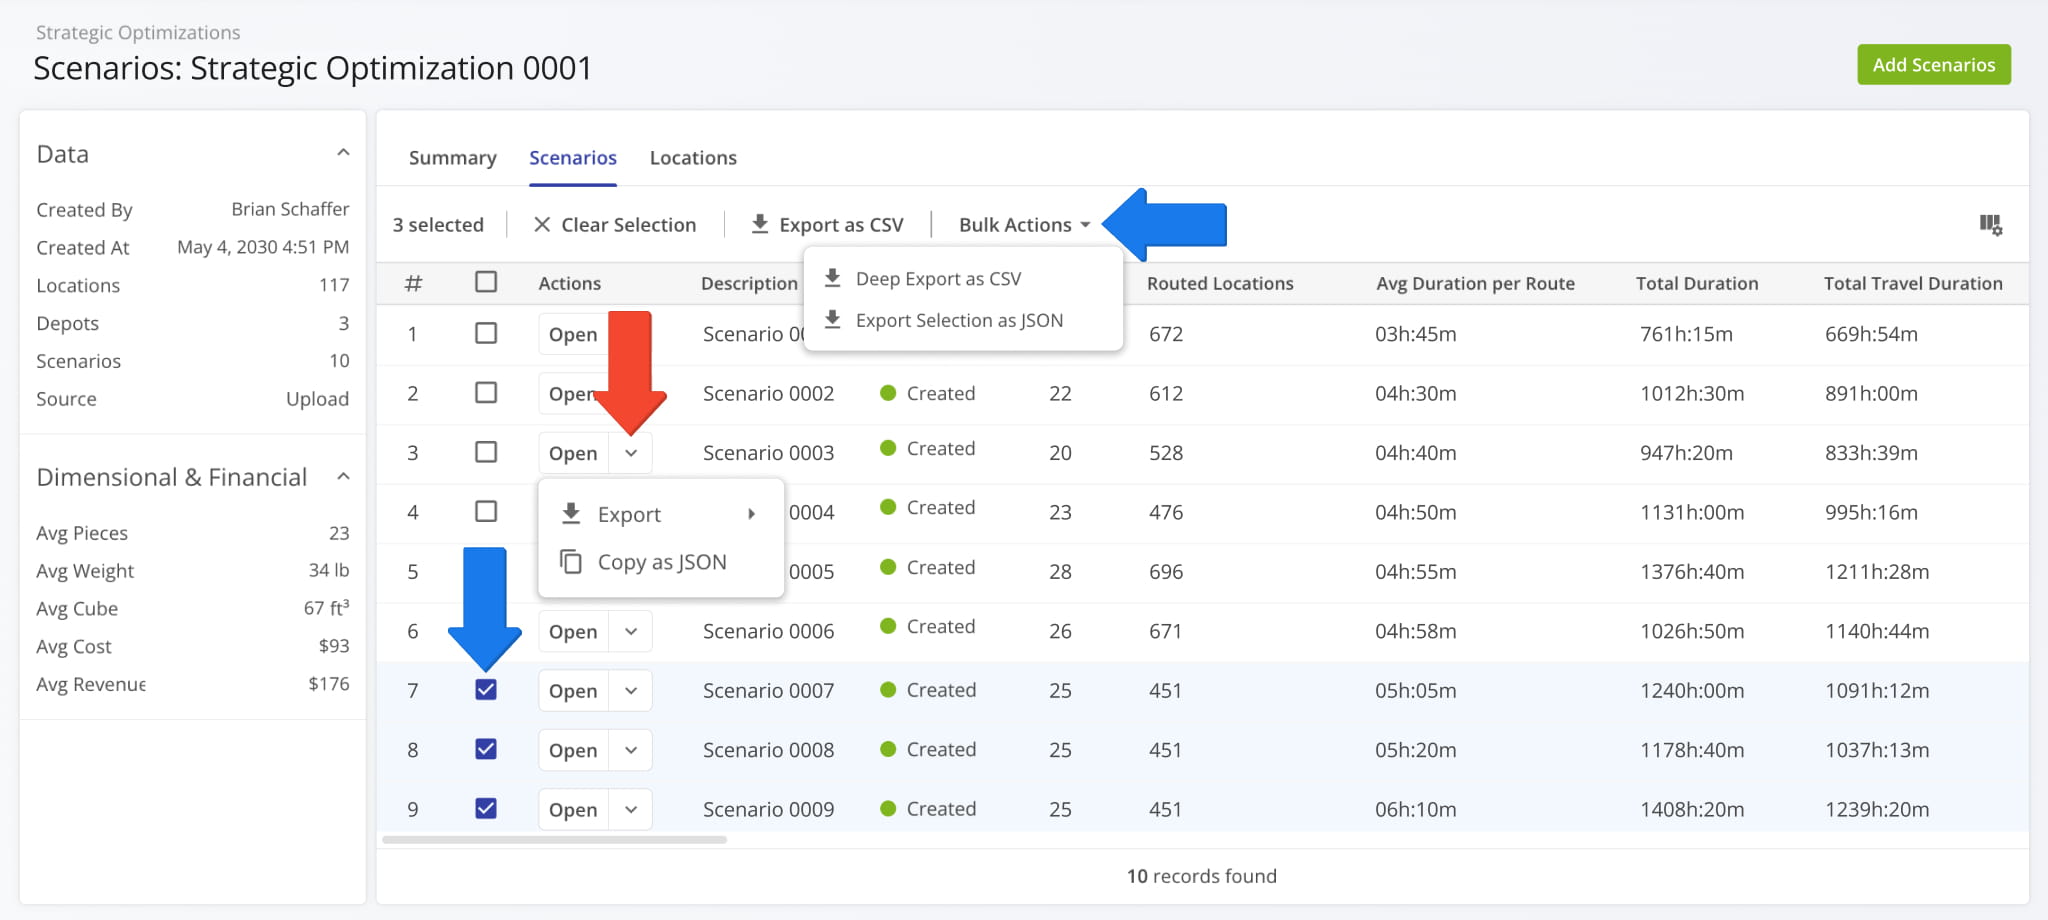
Click the “Scenarios” tab to see a customizable list of all Scenarios included in the open Strategic Optimization.
To filter the list and see only the Strategic Scenarios relevant to your needs, click “Filters” and enable your preferred options. See the Strategic Optimizations Data Catalog for more details.
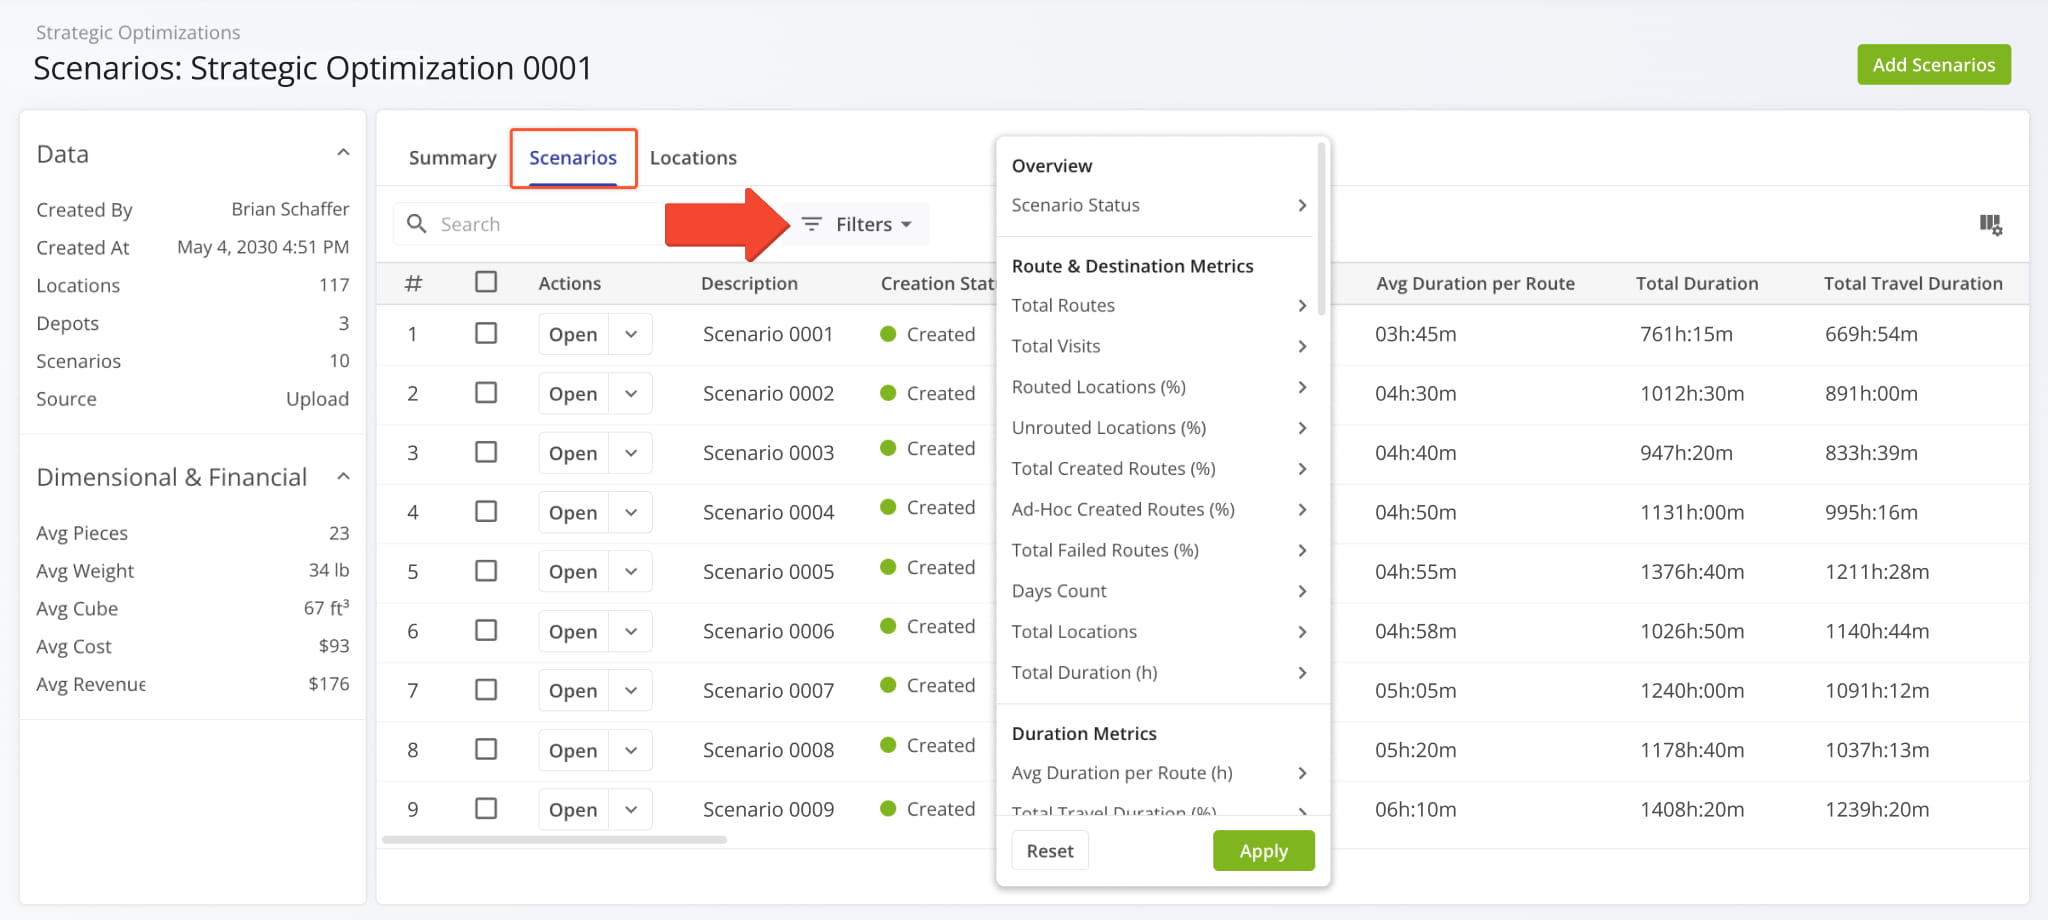
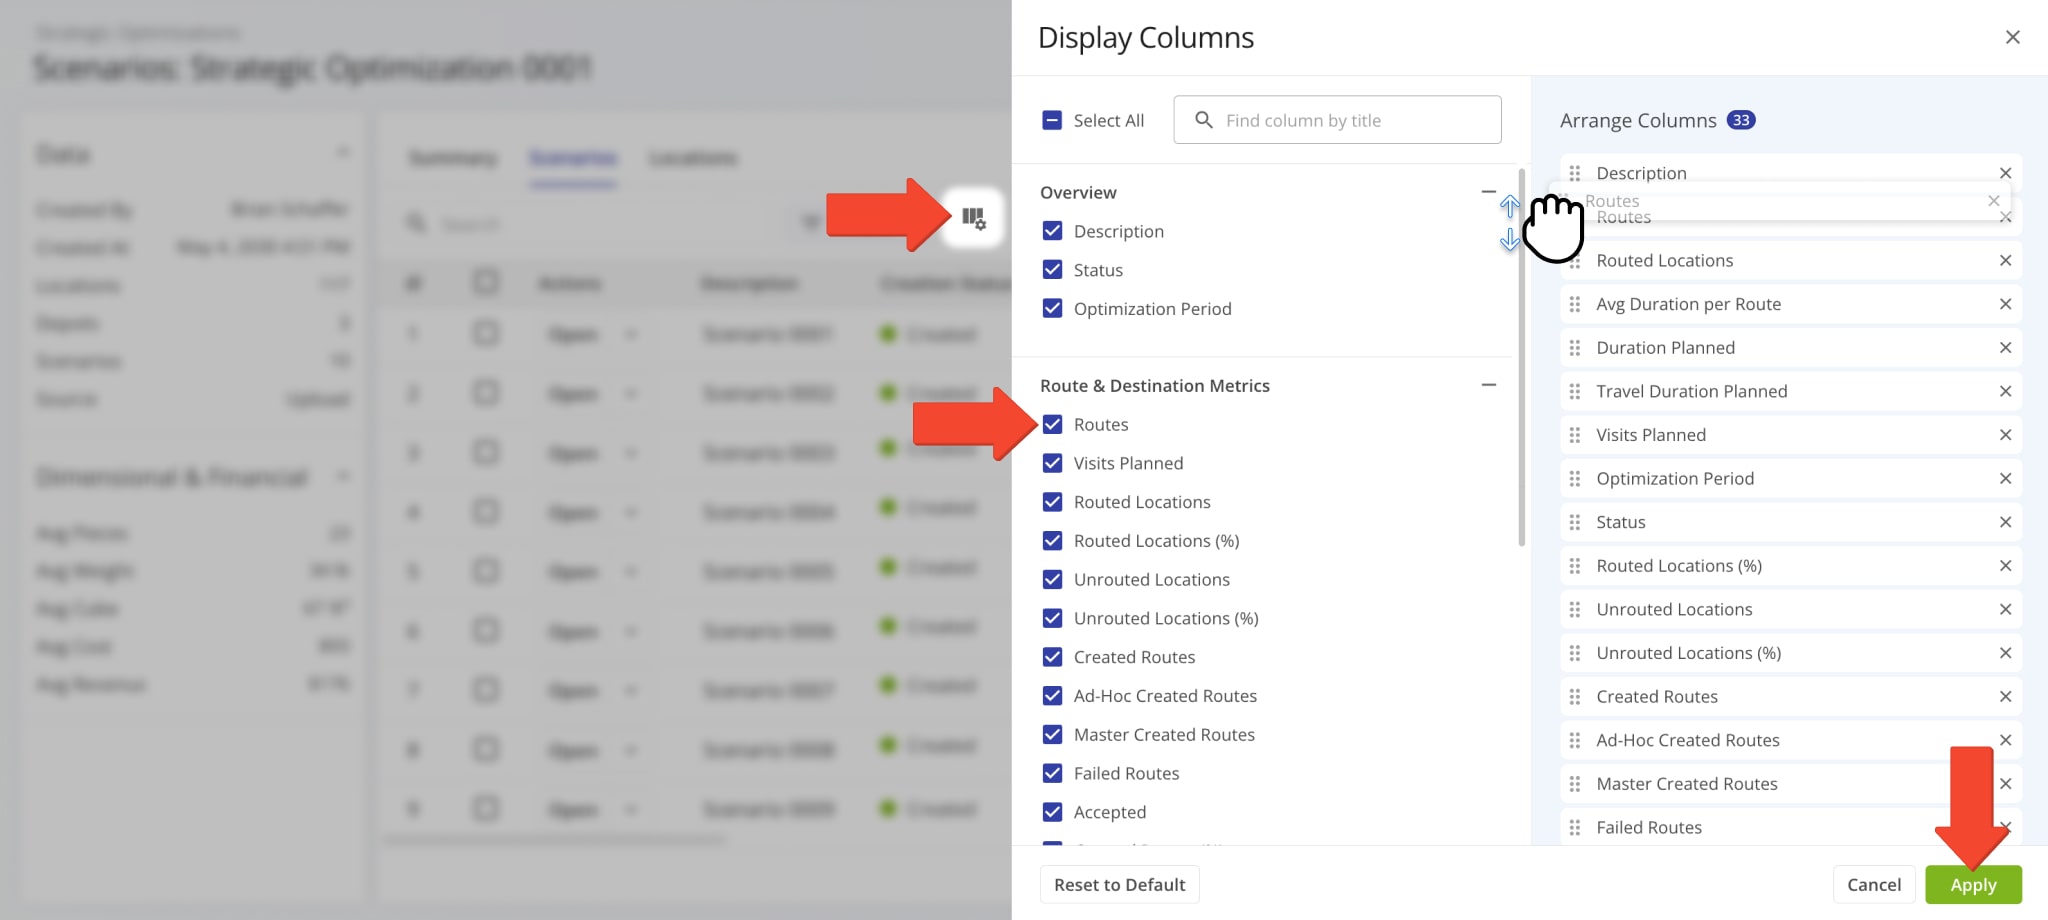
You can also customize the data columns shown in the “Scenarios” section. Click the Display Columns Button, check the boxes next to columns you want to enable, and click “Apply” to save your changes.
To arrange the order of your Display Columns, you can drag column names up or down in the “Arrange Columns” section on the right. See the Strategic Optimizations Data Catalog for more details.
The “Scenarios” section is where you can export Scenarios and Scenario Settings. Click the Down Arrow next to a Scenario to download it or copy its data in the JSON format.
To export multiple Scenarios or copy them as JSON, check boxes next to Scenarios in the list and click “Export as CSV” or “Bulk Actions” from the action menu above the table. Learn more about Strategic Scenario Management and Export.
Optimization Locations – Customizable Strategic Optimization Locations Database
Click the “Locations” tab to see the Locations associated with the Strategic Optimization and its Scenarios. Additionally, this is where you can find data relating to the visit frequency and pattern of each Location. You can also click the Map Icon in the top-right to open the dynamic Locations Map.
To find specific Scenarios or Locations in the Strategic Optimization, you can use custom filters or search by name or attribute with the “Search” field. Click the “Filters” button to refine the data shown on this page. The Data Catalog contains a full list of filters.
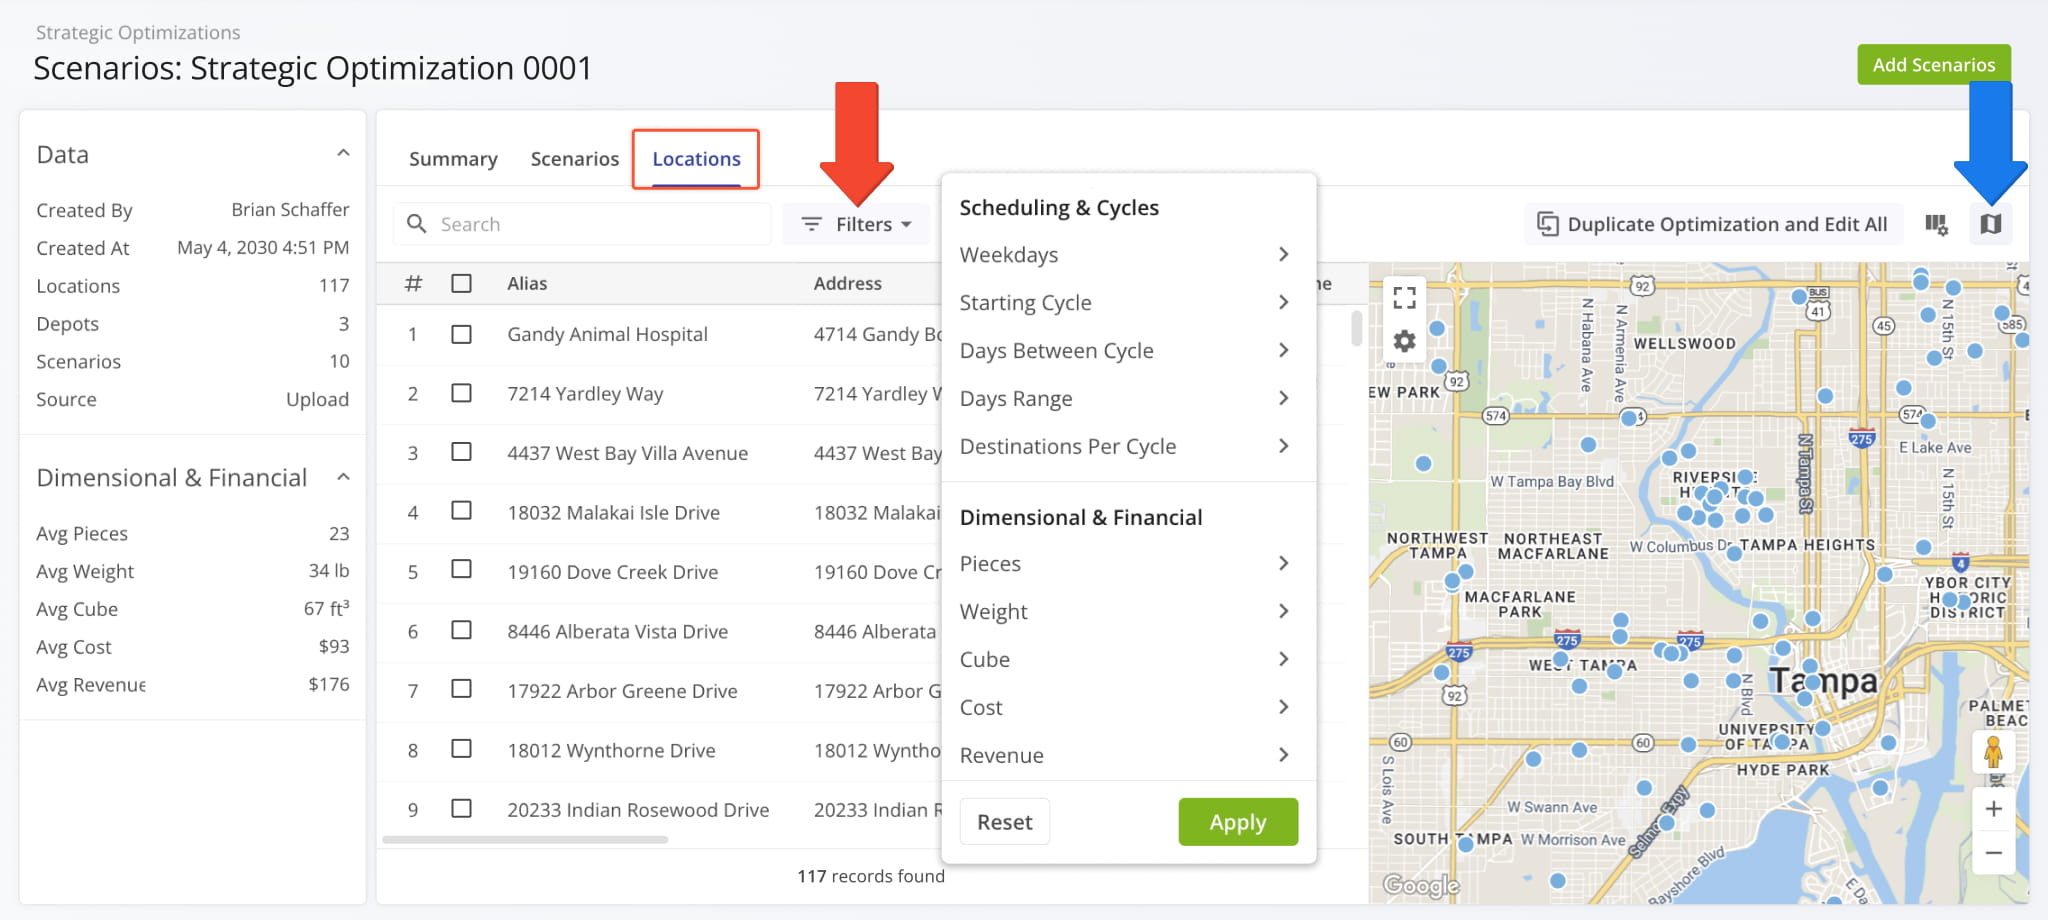
On the Locations Map, you can hover over a Location to view its address and scheduling details in the Strategic Optimization.
Click the Gear Icon on the Locations Map to open the Map Settings. See the table below for more details.
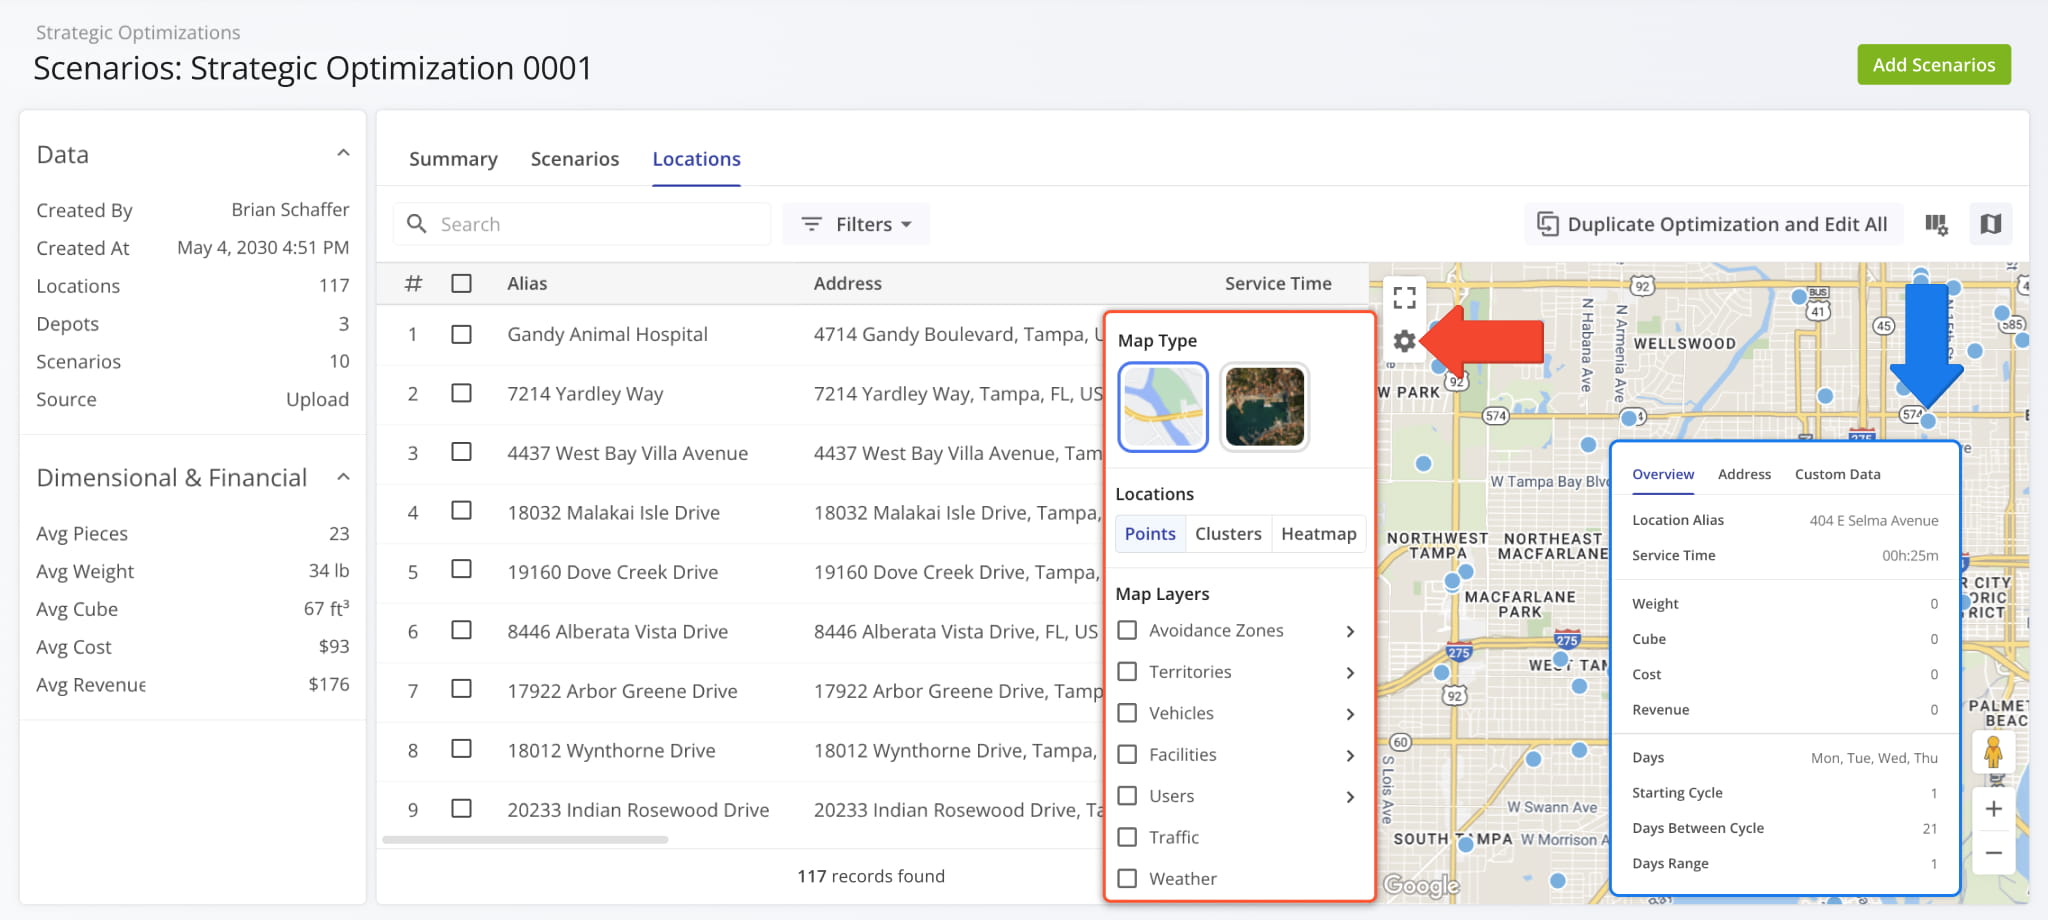
| Map Settings | Description |
|---|---|
| Map Type | Switch between road network and satellite view map modes. |
| Locations | Switch between dispalying Locations as “Points” (individual map markers), “Clusters” (grouped map markers based on proximity), and “Heatmap” (Location density overlay). |
| Avoidance Zones | Enable an overlay showing your Avoidance Zone areas on the map. |
| Territories | Enable an overlay showing your Territory areas on the map. |
| Vehicles | Enable Vehicle location indicators on the map. |
| Facilities | Enable Facility location indicators on the map. |
| Users | Enable User location indicators on the map. NOTE: User tracking is active for Users on routes and shows their last synced location if no route is currently active for a User. |
| Traffic | Enable a live traffic overlay on the map. |
| Weather | Enable a live weather overlay on the map. |
You can easily customize the data shown for your Locations. To do so, click the Display Columns Button and check the boxes next to the columns you wish to enable. You can change their positions by dragging column names on the right. Click “Apply” to save your data column settings. See the Data Catalog for a full list of columns for your Strategic Optimization Locations.
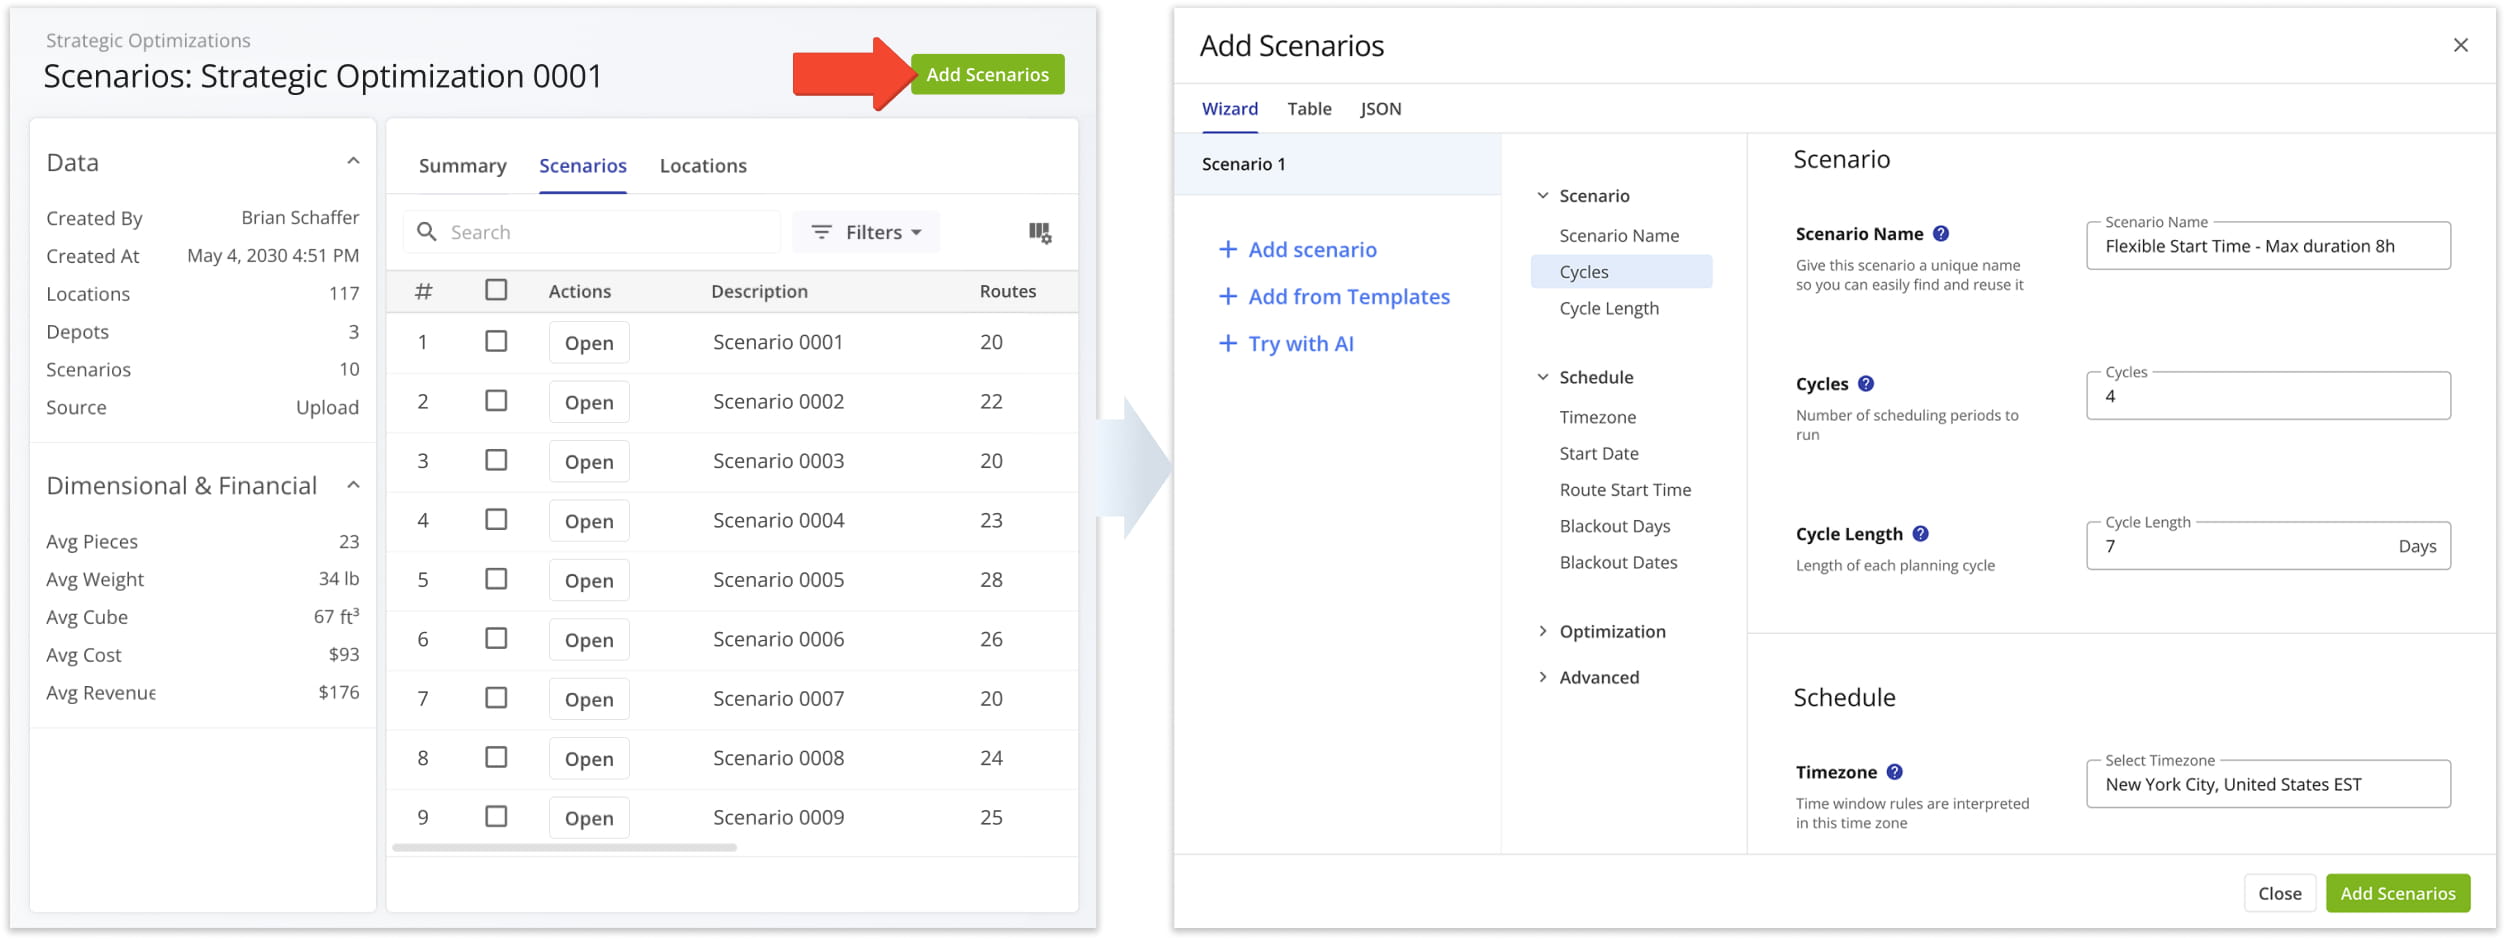
Add Strategic Scenarios – Plan New Scenarios With Optimization Locations
[T]
Export Optimizations – Download Strategic Optimization Data
To download Strategic Optimization data, you can export one or more Strategic Optimizations.
Either click the Down Arrow next to an Optimization or select multiple Optimizations by checking the boxes next to them and use the action bar above the data table to access export options.
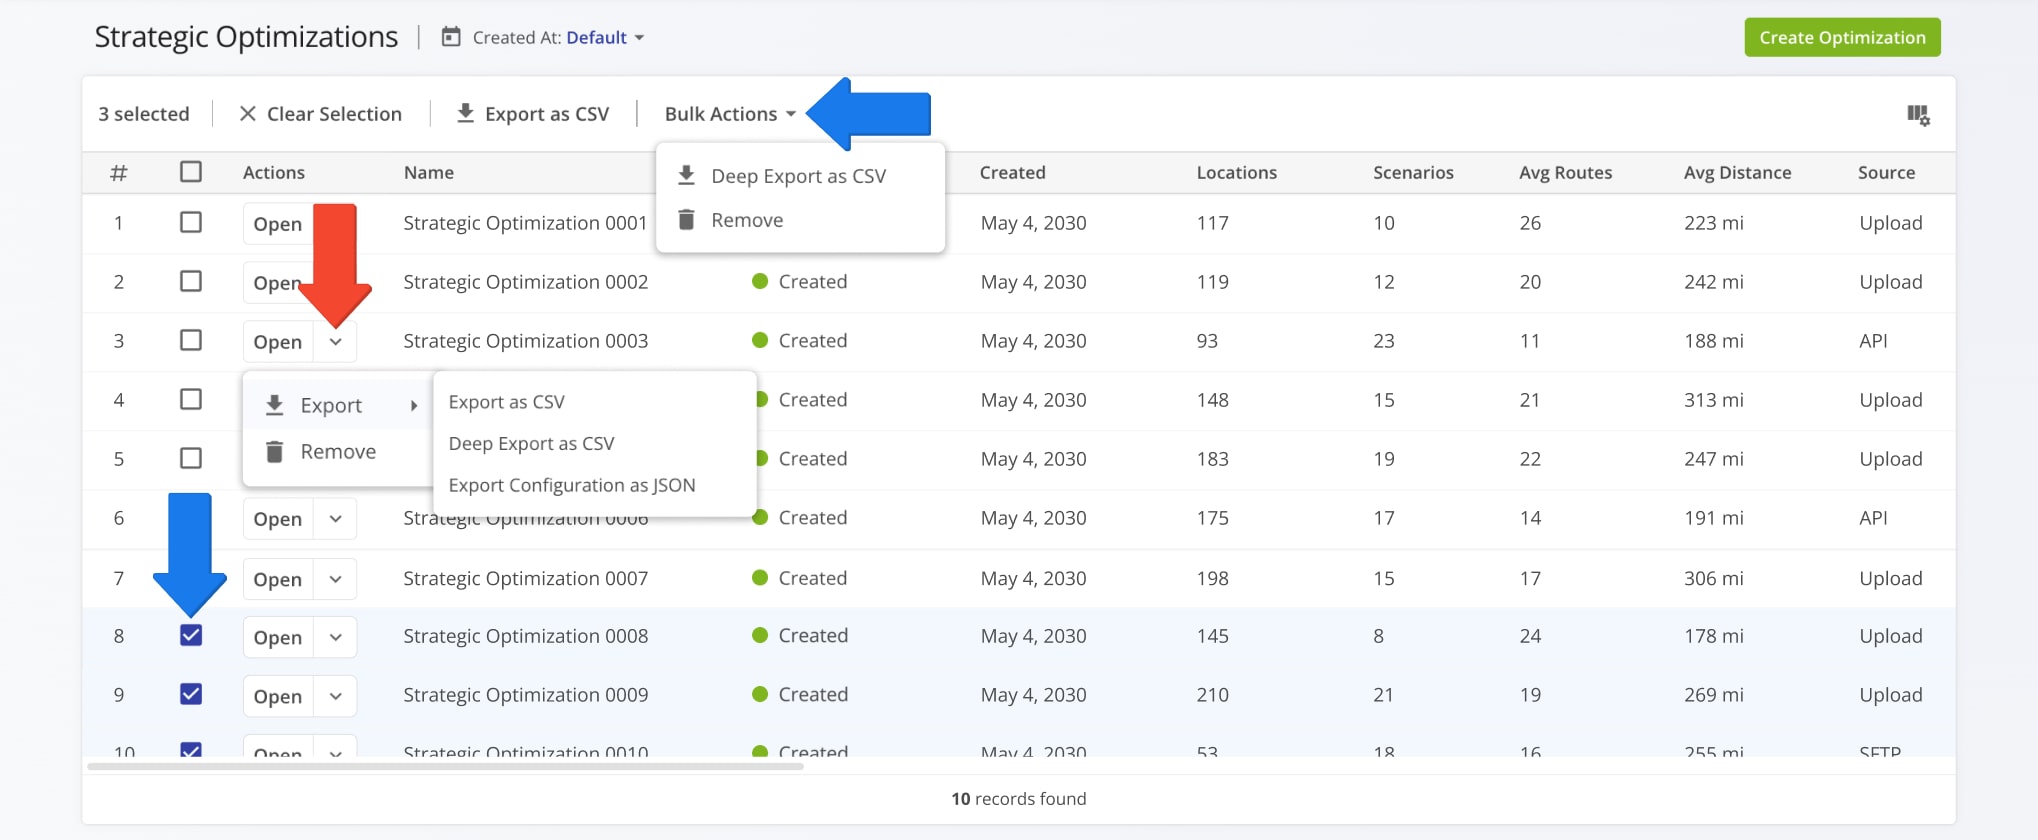
The “Export as CSV” option enables you to customize an export file by checking boxes next to data items you want to include. Just like display columns, you can re-arrange your export columns by dragging their names up or down on the right. After you’ve configured your export file, click “Export” to download a CSV spreadsheet.
You can also save your export settings as a template using the toolbar at the top of the export panel.
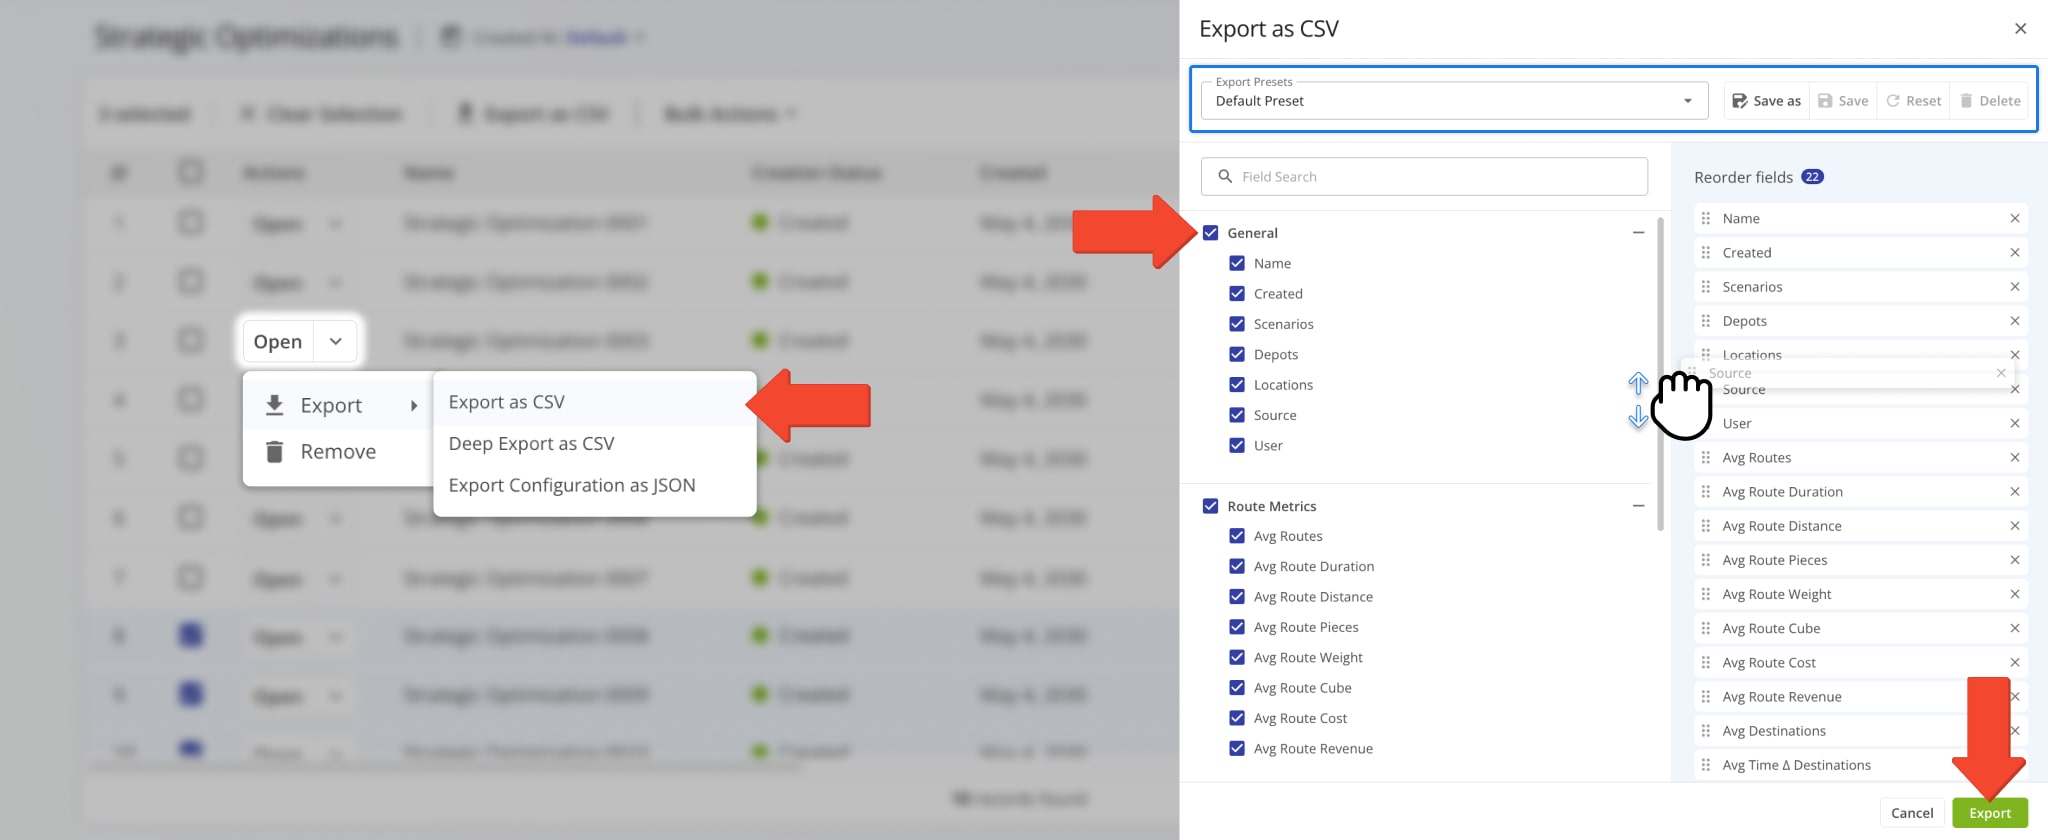
NOTE: Export data column options are the same as Display Column options when selecting “Export as CSV“.
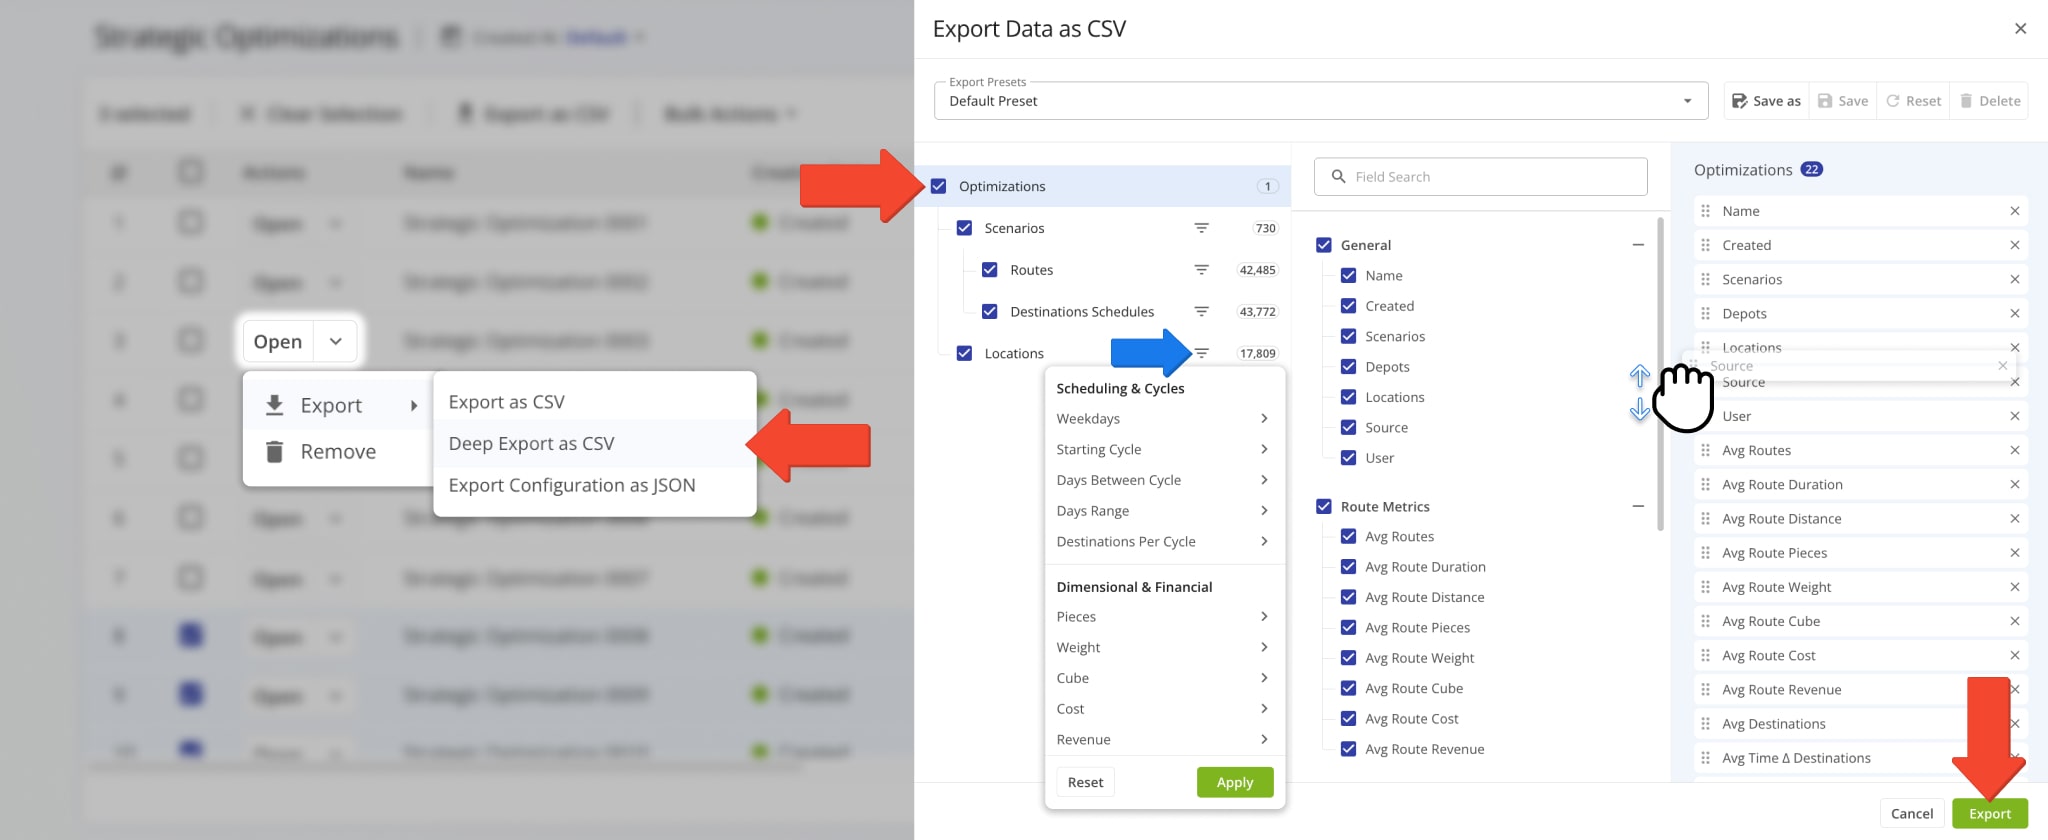
If you need deeper export customization, select “Deep Export as CSV” to access more complex export settings. Deep Export gives you access to all the data items described in this guide, divided into the same Strategic Optimization categories.
In addition to the two familiar sections, you’ll see a hierarchy on the left. It corresponds to the structure of a Strategic Optimization. Each item in the hierarchy is a category with its own data types and filters, which match those of the Strategic Optimization, i.e. the “Locations” export category has the same data and filter options as the “Locations” tab in an Optimization.
Enable and arrange items to customize your export file as usual and click “Export” to download the CSV.
Duplicate Optimizations – Create New Optimizations By Duplicating Locations
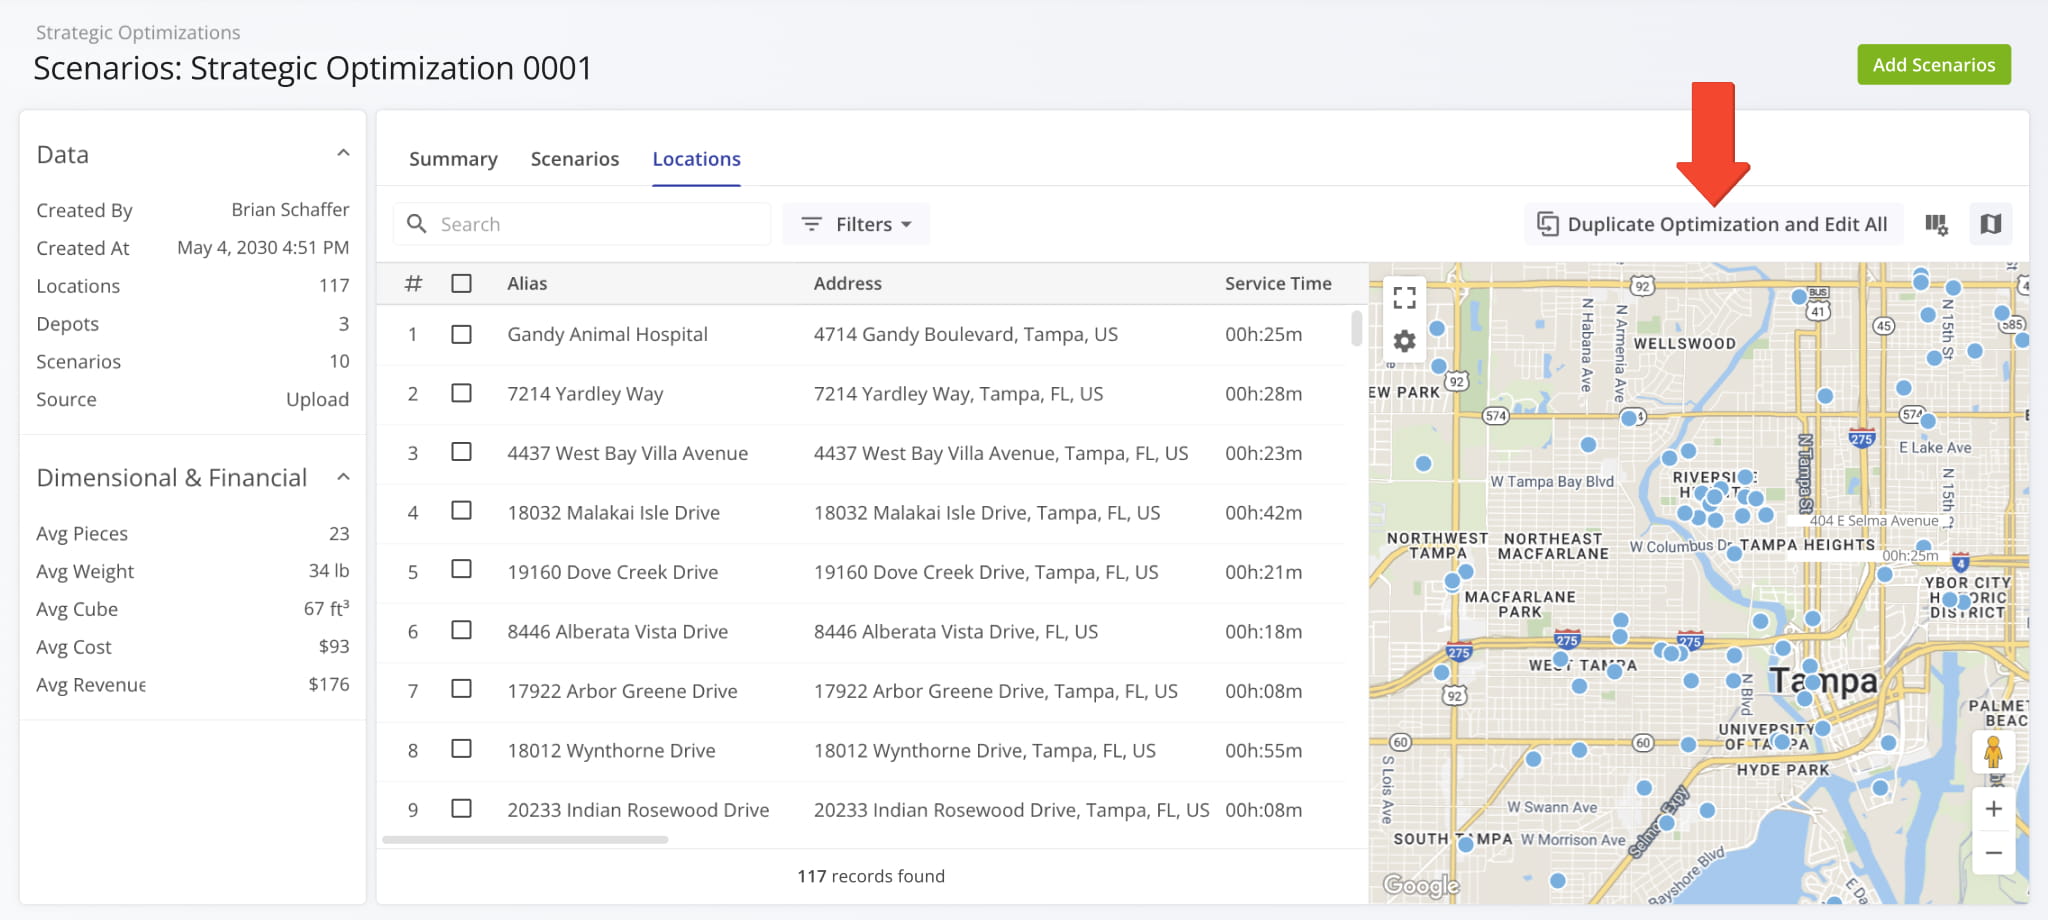
Route4Me enables you to easily duplicate complex Strategic Optimizations. Instead of going through the process of Strategic Optimization Planning, you can go to the “Locations” tab of an open optimization and click the “Duplicate Optimization and Edit All” button. It creates an editable draft based on the current optimization with all its locations and scenarios.
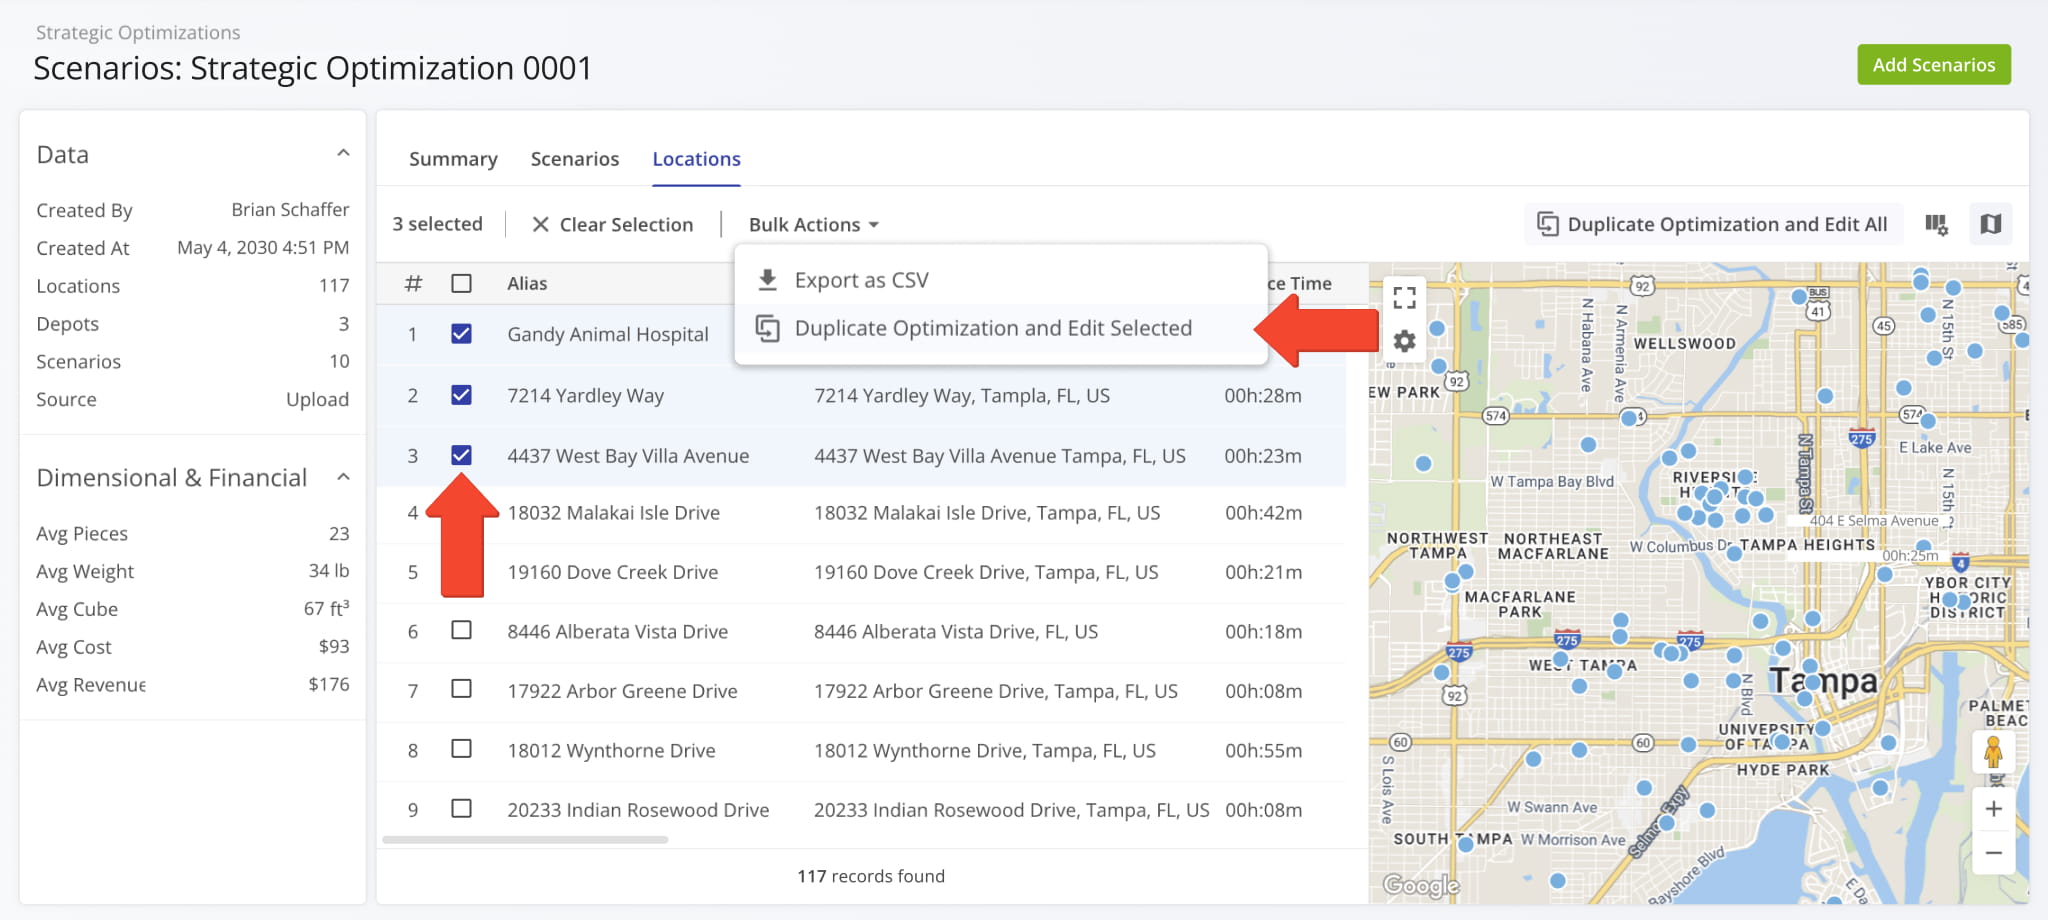
You can also do the same with only specific locations by selecting them and clicking “Bulk Actions” to access the “Duplicate Optimization and Edit Selected” option to create an editable draft based on the current optimization with the selected locations.
Manage Scenarios And Routes In Strategic Optimizations
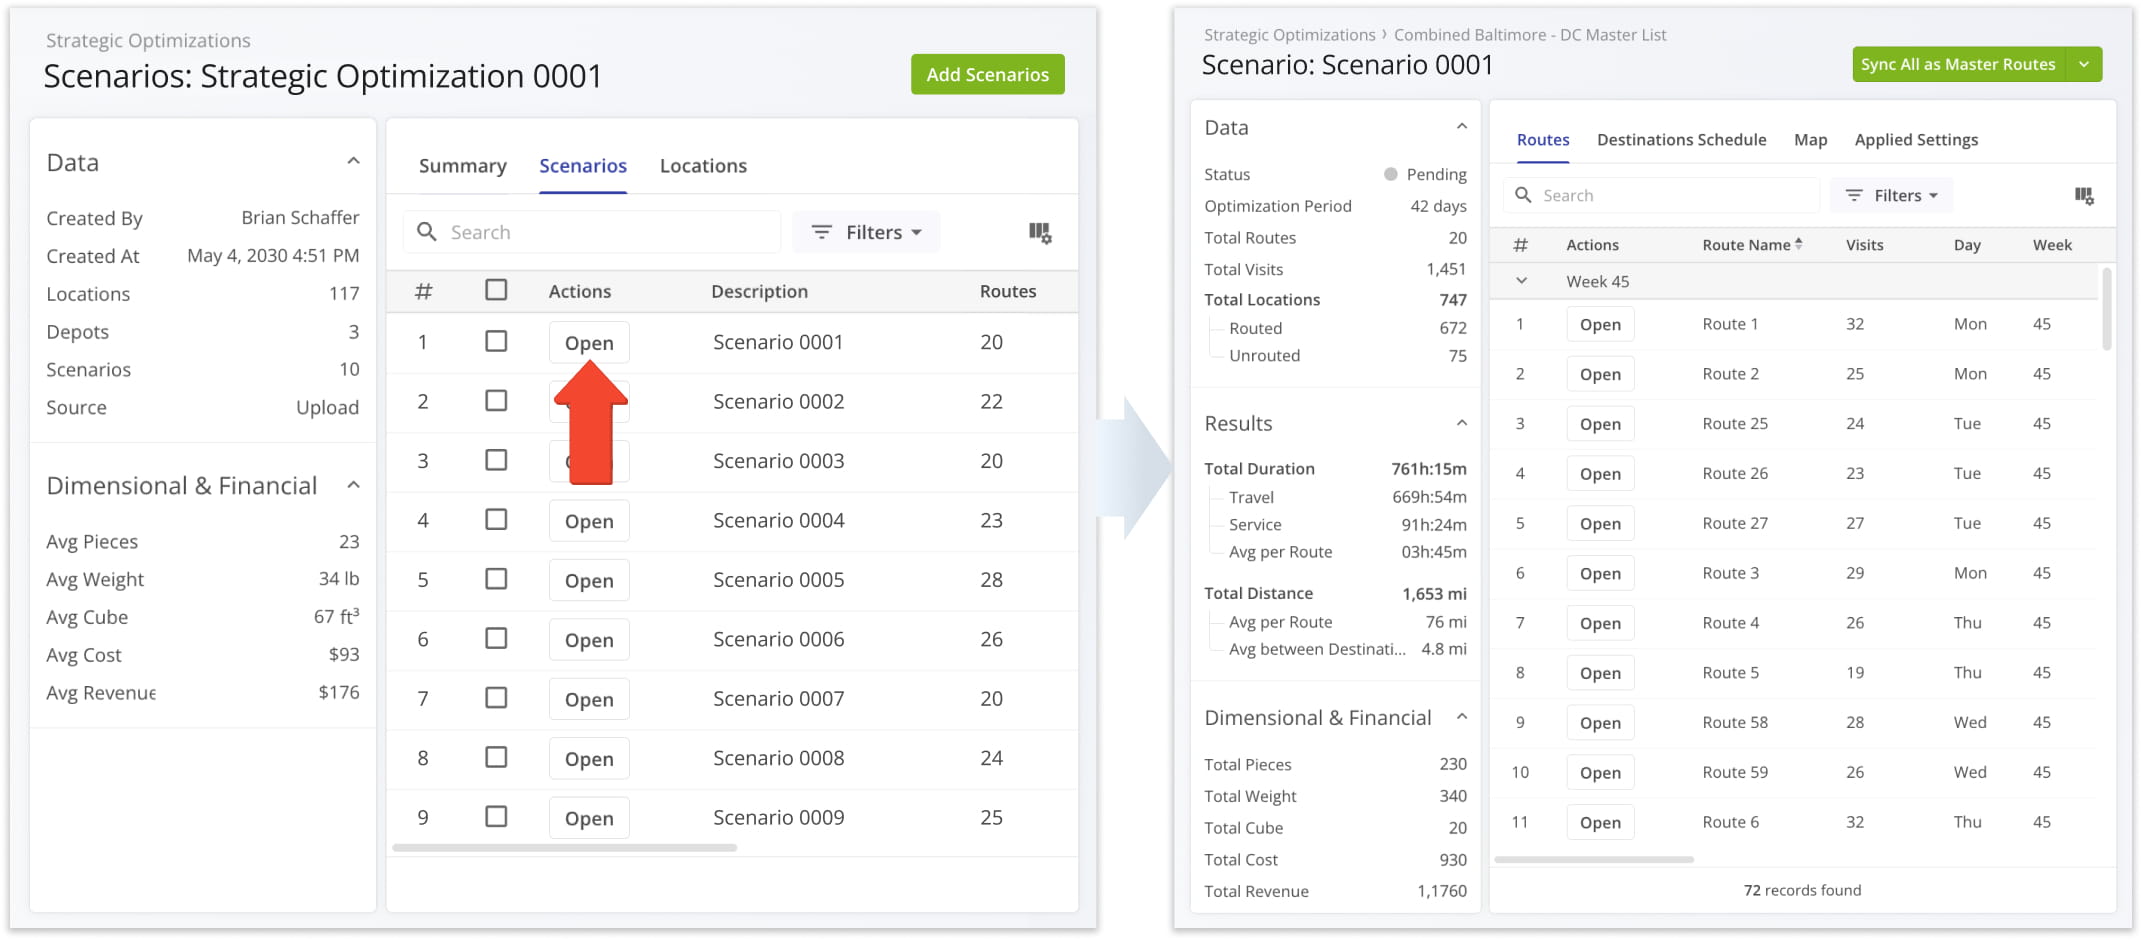
To delve deeper into strategic cycle planning and management, you can view and manage scenarios and scenarios route. Simply click the “Open” button next to a Scenario from an open Strategic Optimization.
The Scenario Page is also where you can see and customize Scenario Routes, view a detailed destination schedule, preview routes on the map, and sync strategic routes for recurring routing. Learn more about Strategic Scenario Management.
Visit Route4Me's Marketplace to Check out Associated Modules:
- Operations
Audit Logging and Activity Stream
- Operations
Custom Data Add-On
- Operations
Advanced Team Management Add-On
About author: Kristian Andreev
Kristian is a Technical Writer at Route4Me. With over a decade of experience in writing and localization, he's an expert at communicating complex technical data in a clear, concise, and user-friendly way. Passionate about bridging the gap between engineers and users, he specializes in creating documentation to streamline onboarding, enhance product usability, and support global teams on the path to success.