Dashboard Settings – Customize Analytics And Reporting Totals And Graphs
Route4Me’s Dashboard is a powerful and flexible analytics and reporting tool. The Route Dashboard enables you to collect, sync, and visualize actionable last mile intelligence and real-time statistics generated by field employees on a centralized control panel. Compare scheduled destinations to visited addresses, monitor drivers in real-time, check KPI deviations, and more. Moreover, you can customize the Dashboard to get an overview of data specifically relevant to your organization. The data can first be filtered for a preferred date range, grouped by one or multiple team members, and then exported as a CSV file at the touch of a button. You can then share exported Dashboard reports with your team, use them to audit your organization’s performance, log into your CRM or other enterprise delivery routing software, compare weekly or monthly KPIs, and more.
Table of Contents
Dashboard Overview – Route Data Totals And Planned VS Actual Graphs
To open your Route4Me Dashboard, go to “Analytics” and then “Dashboard” from the Navigation Menu. The Dashboard is divided into two main sections. For your convenience, the “Total” section provides a summarized and customizable overview of your entire organization’s real-time or historical performance or separate team members.
Click To Open Your Route4Me Dashboard
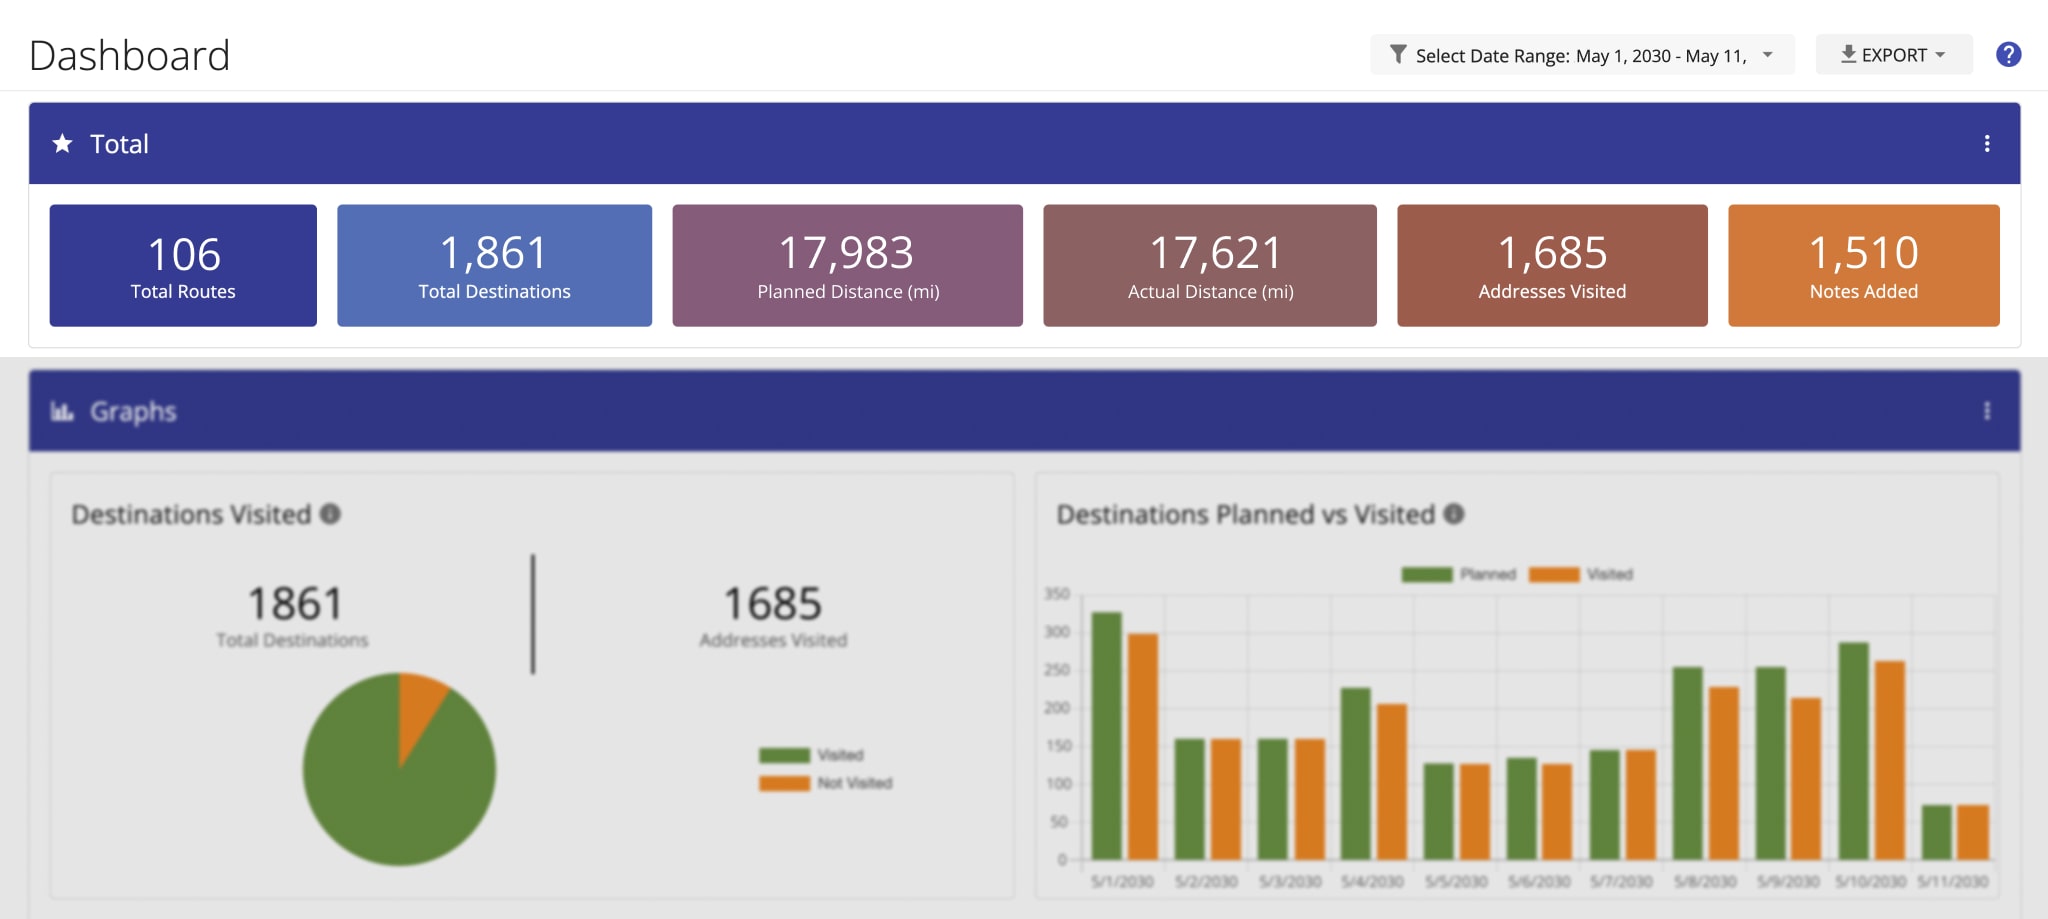
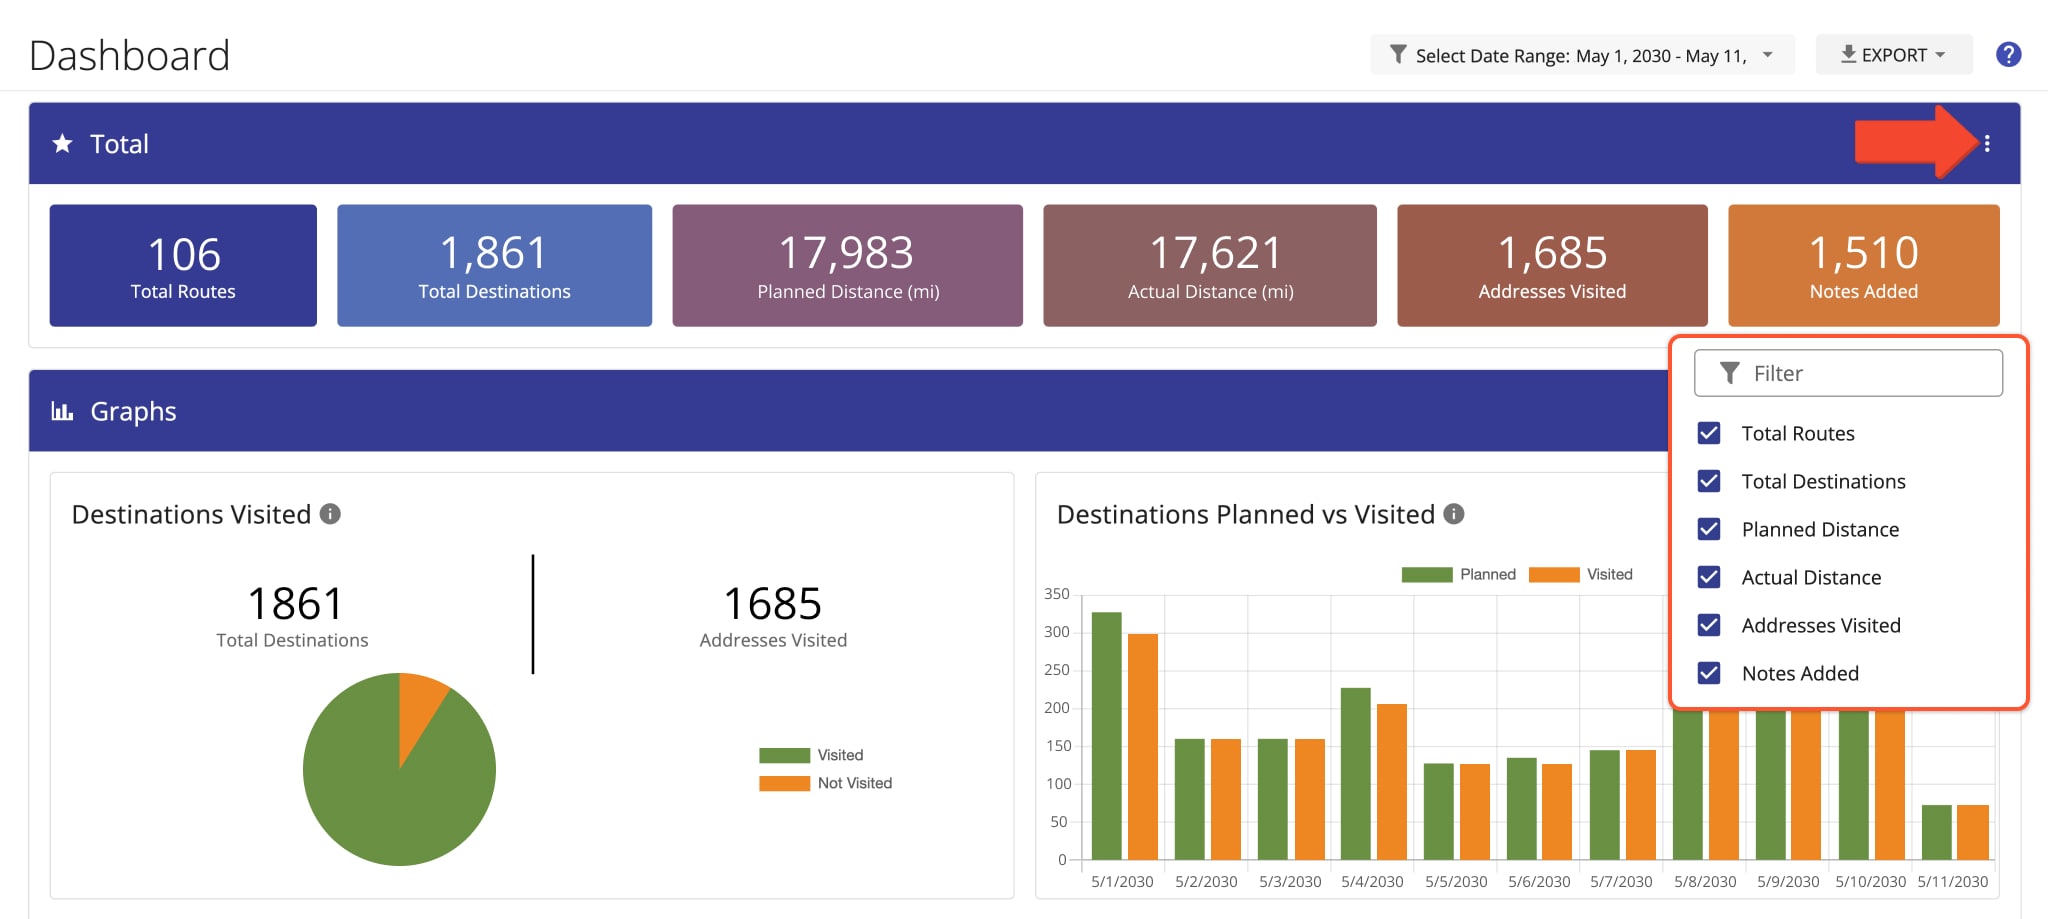
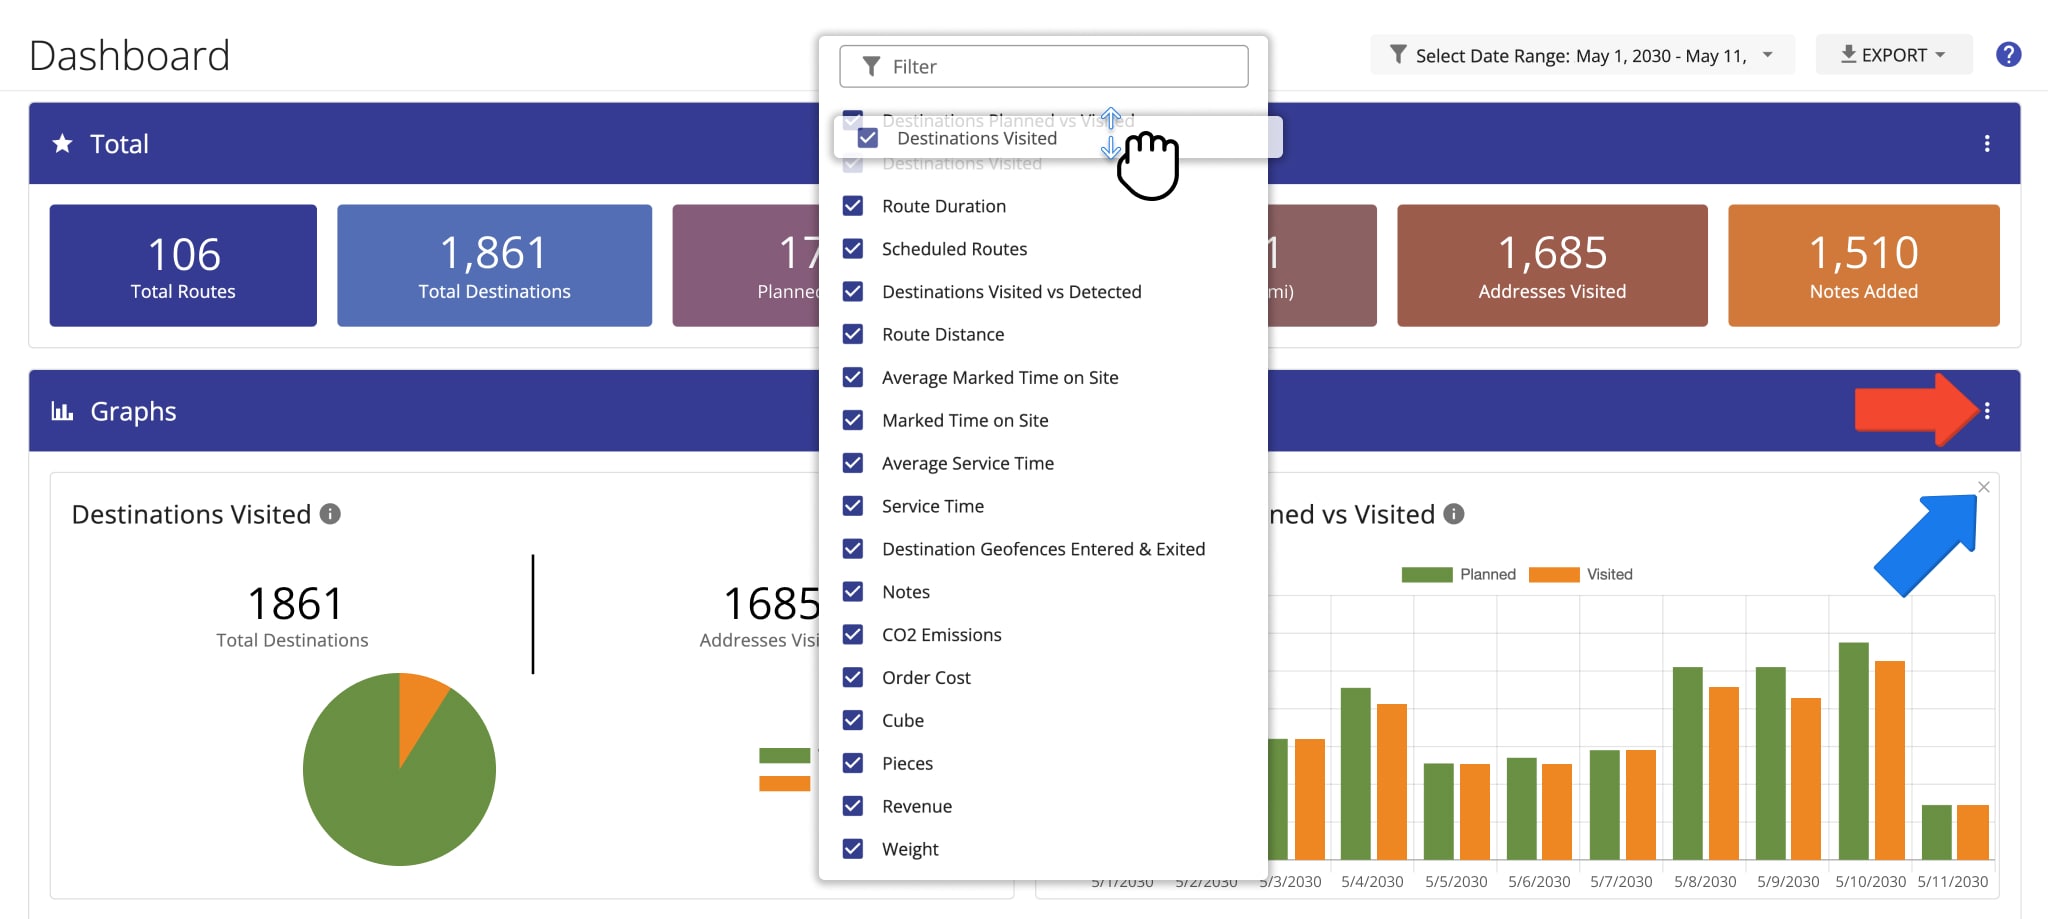
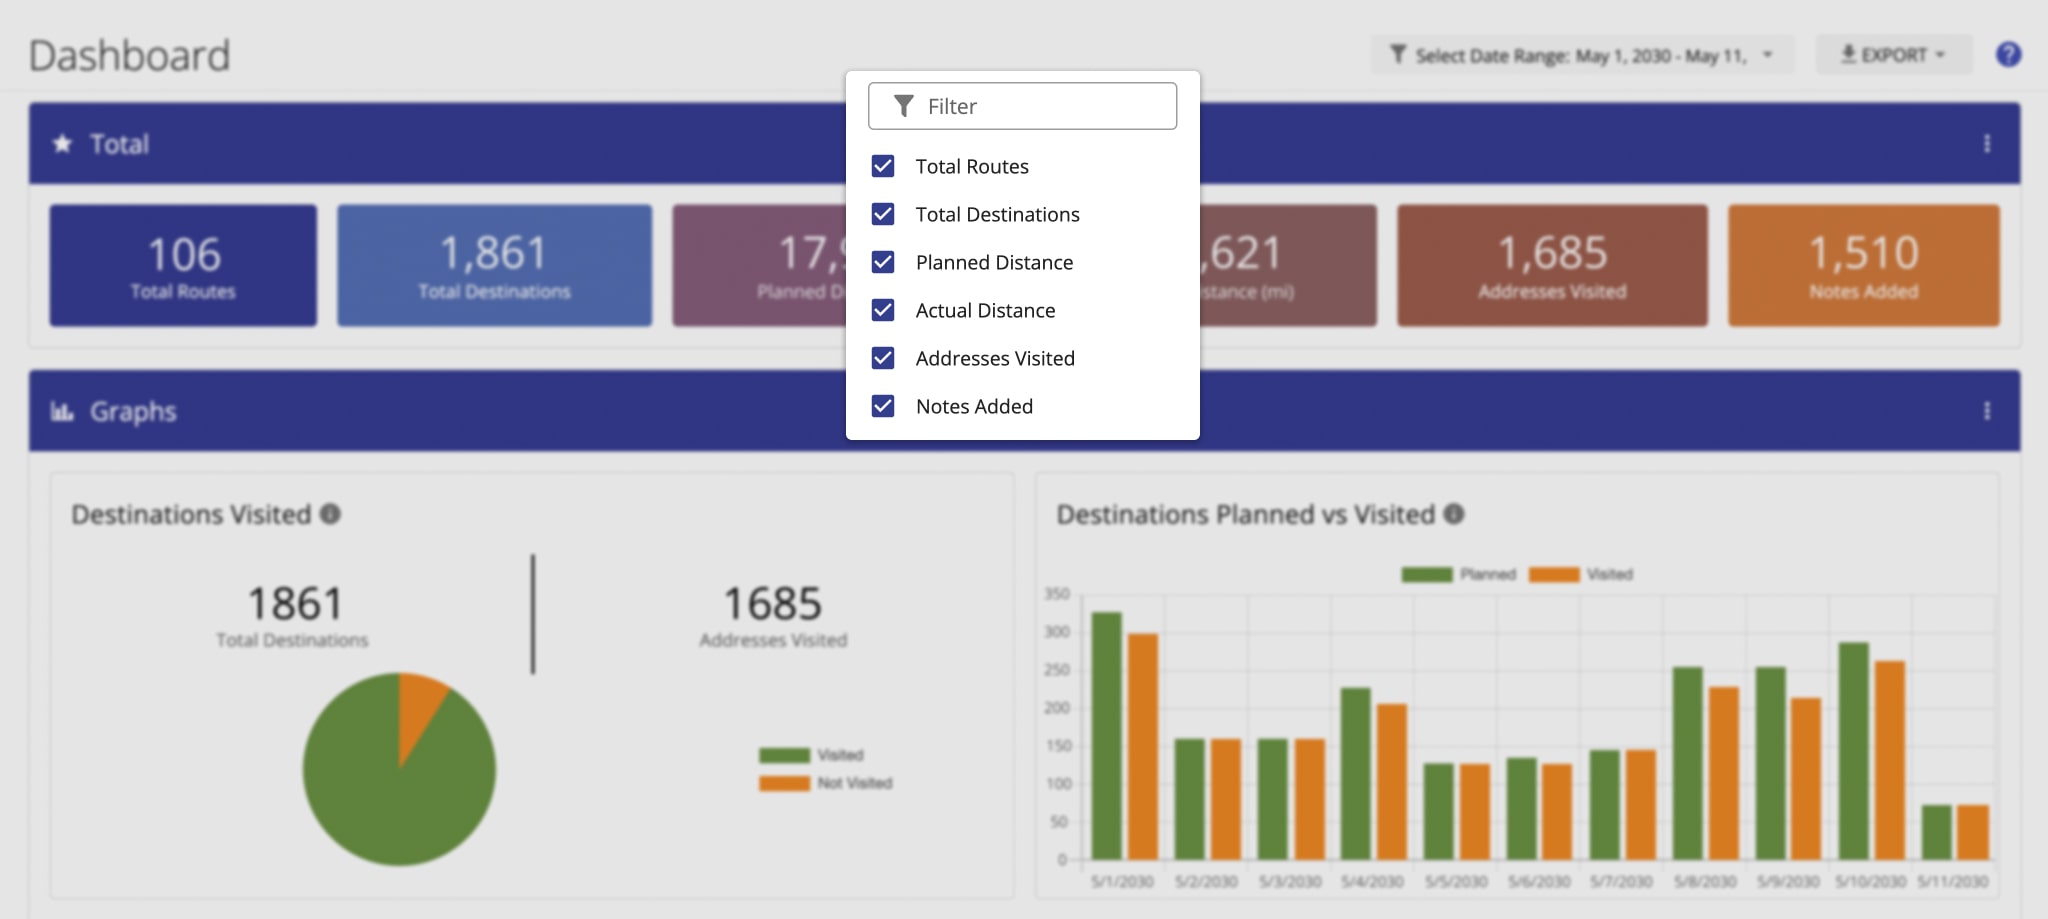
Specifically, the “Total” section of the Dashboard can be customized to display your preferred data. To customize the data displayed in the “Total” section, click the Three-dot Icon and check the boxes next to your preferred items to enable them. The “Total” section displays the top-level route progress for the selected date range and team members.
Additionally, the “Graphs” section enables you to select what data is displayed and provides a visual and numeric comparison of planned and actual route data.
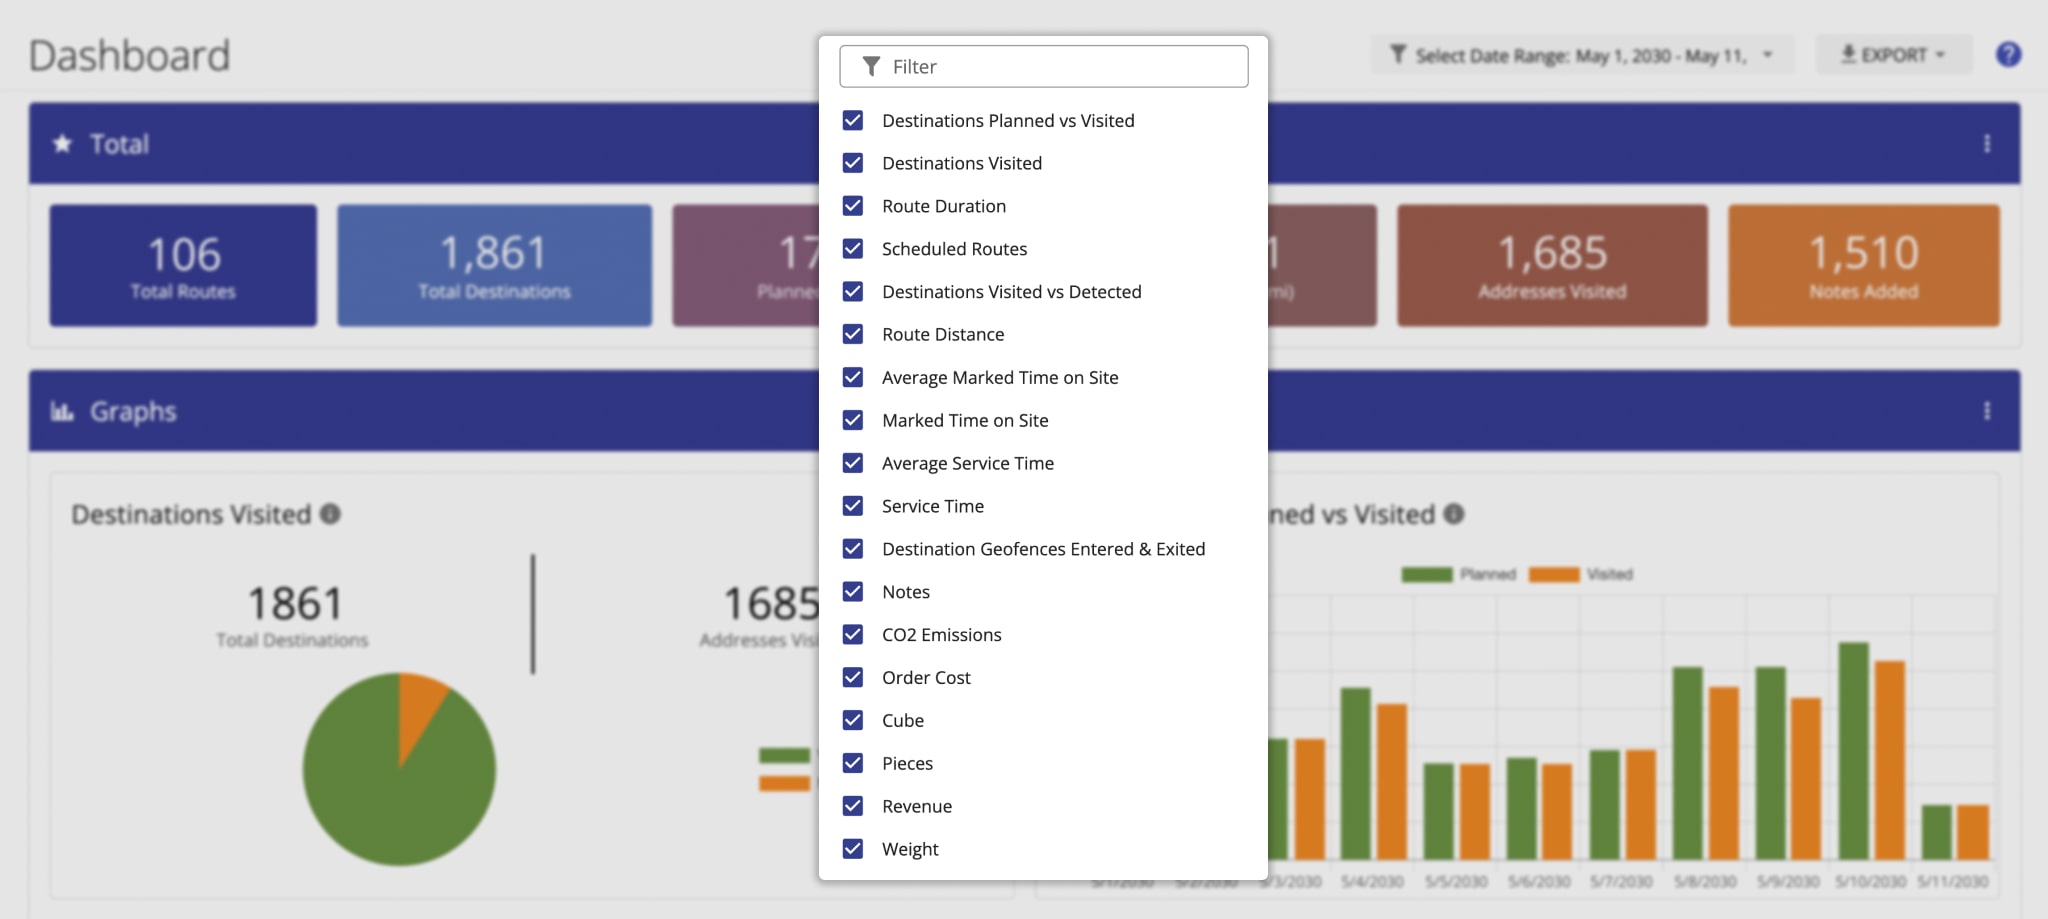
Further, to enable data items in the “Graphs” section, click the Three-dot Icon and check the boxes next to your preferred items to enable them. Additionally, you can click the “Add Graph” panel to enable data graphs. To turn off graphs, hover over the graph panel you want to disable and click the X Icon in the top right corner. To re-arrange the order of graphs, click and drag the preferred graph to the desired position in the list.
Filter Dashboard – Display Route Data By Date Range, Users And More
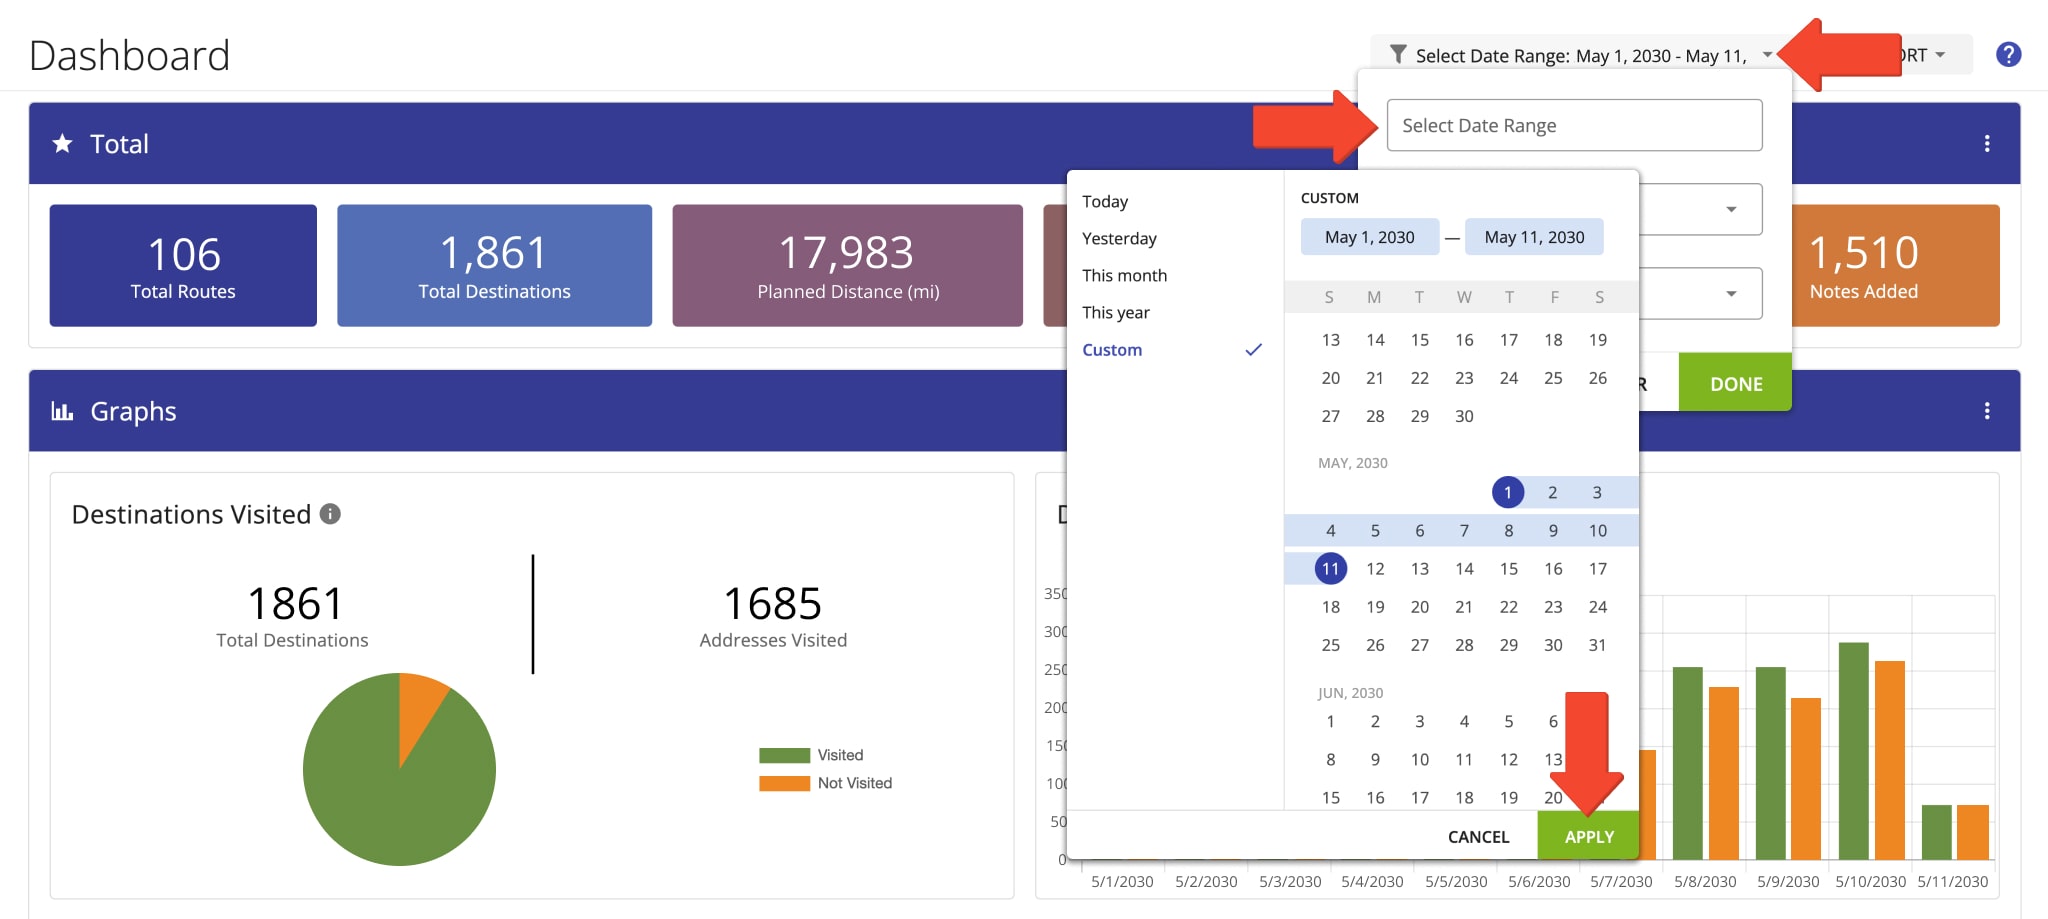
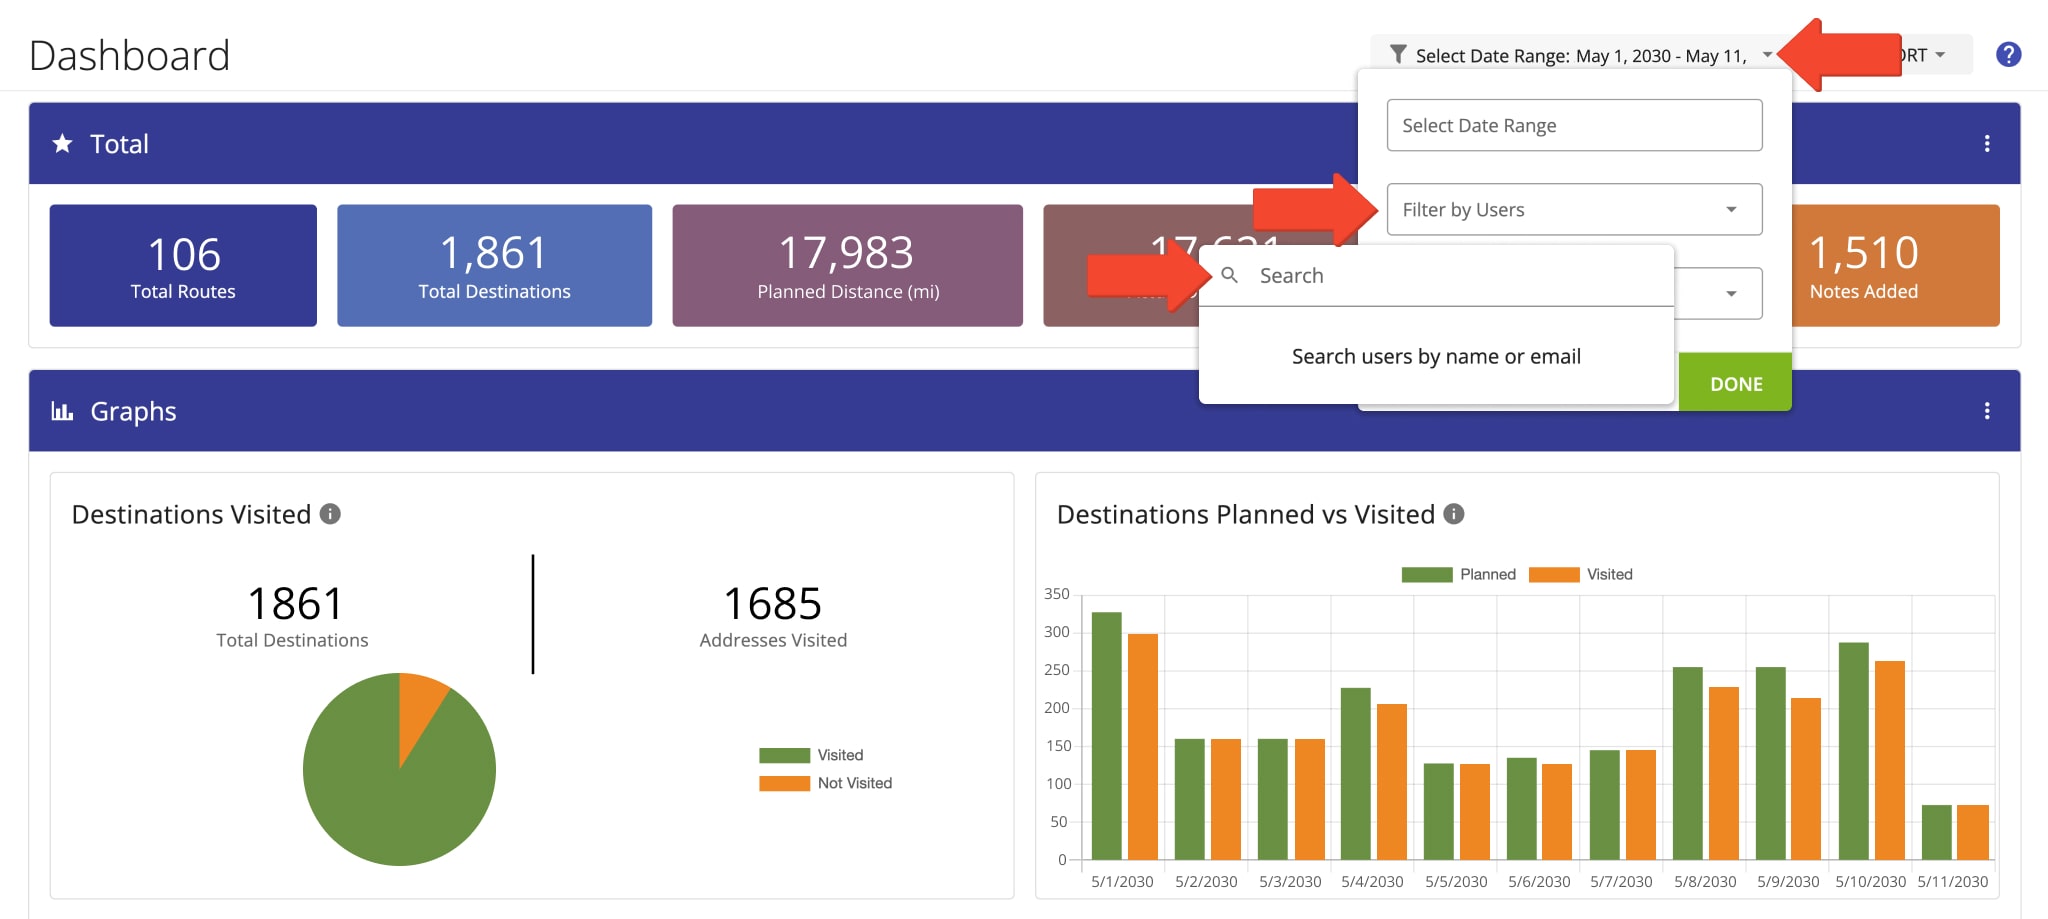
Next, you can filter the information on your Dashboard. Click the Filter field in the top right to open the filter panel. To filter route data for a specific day or date range, use the “Select Date Range” field. When filtering data in the Dashboard by date range, your Dashboard shows information of all routes that are scheduled for the selected day or the dates within the specified range.
For more insight into your team’s performance, you can filter the Dashboard by user. You can monitor the real-time or historical performance of all drivers in your organization or each individual user. To do so, click the “Filter by Users” field and select one or multiple preferred team members. Additionally, learn more about Route4Me’s Team Hierarchy and User Types.
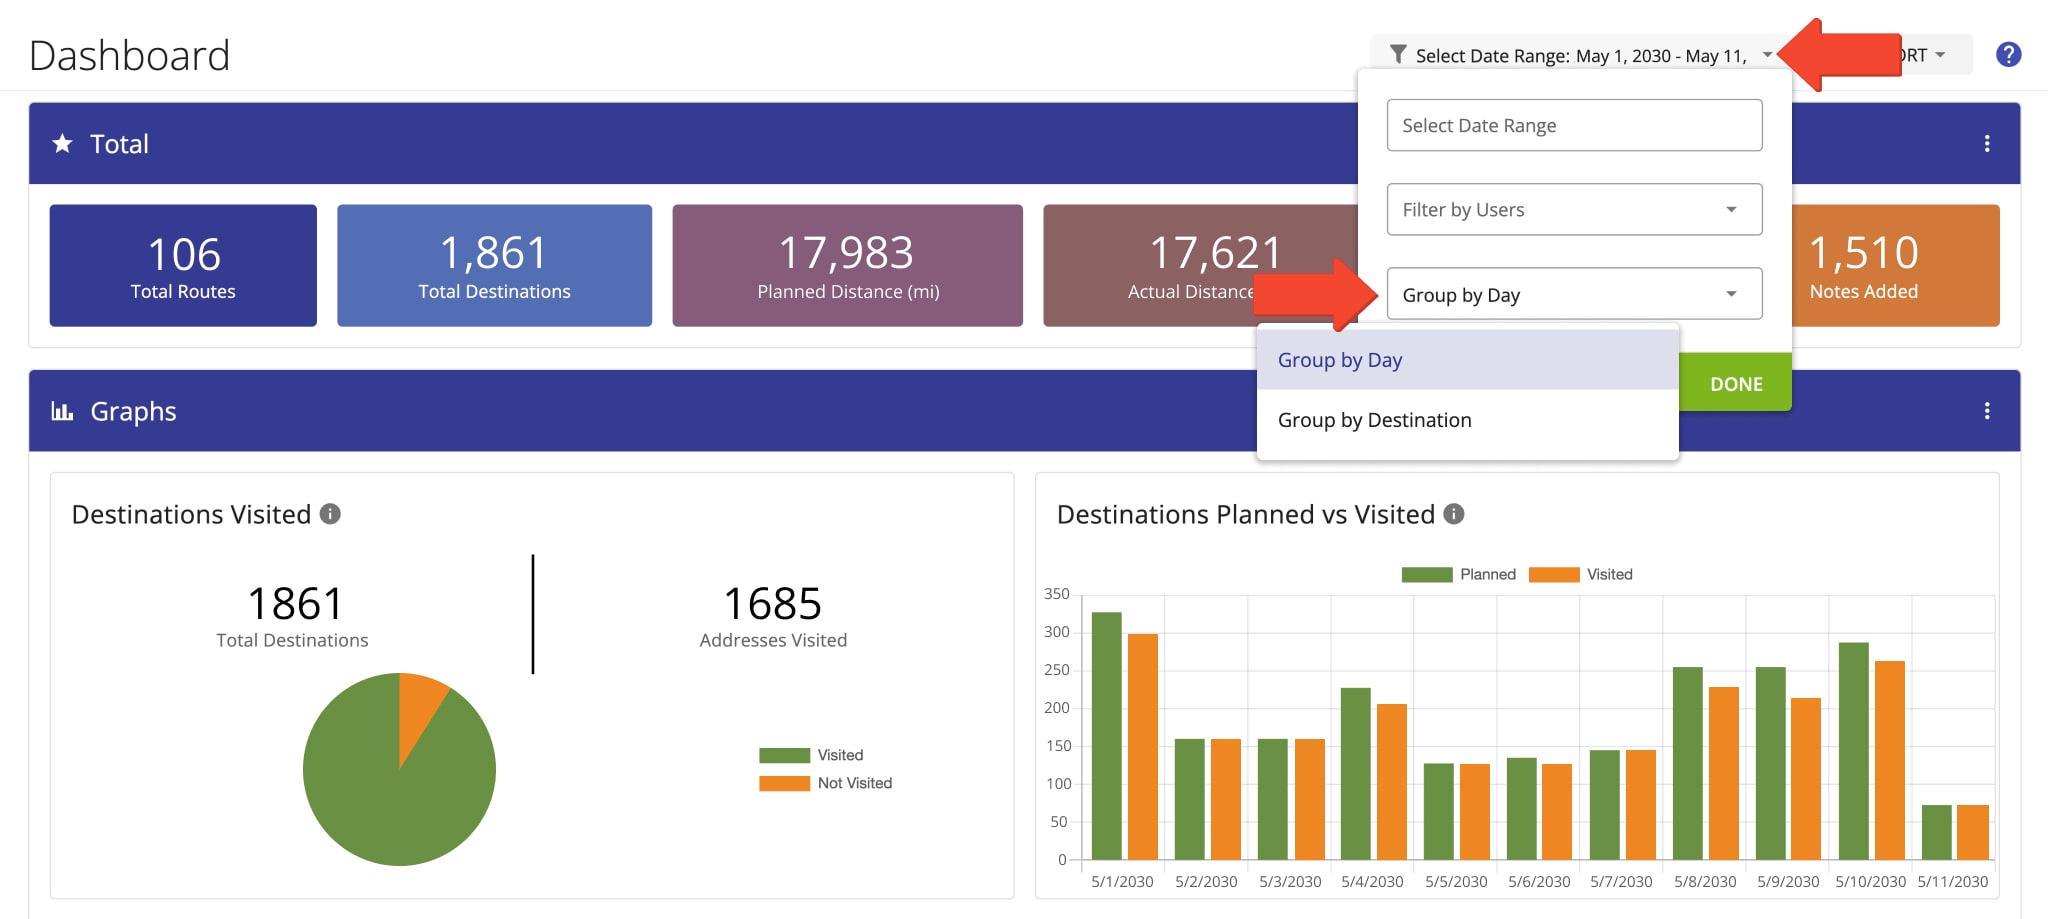
Furthermore, you can choose how data on the Dashboard is grouped. To do so, click the “Group by Day” field and choose the preferred grouping method. When route data is grouped by day, each date within your specified date range will be displayed individually with its respective data. When route data is grouped by destination, each Destination Type (Delivery, Pickup, Service, Visit, Meetup, Break etc.) will be displayed individually with its respective route data.
Graphs In Detail – Different Route Data Graph Types
In detail, the “Total” section displays the top-level combined data of routes according to your specified filters.
| Data | Description |
|---|---|
| Total Routes | The total number of routes scheduled for each day of the selected date range and associated with any selected users. |
| Total Destinations | The total number of all addresses included in routes scheduled for each day of the selected date range and associated with any selected users. |
| Planned Distance | The total distance of all planned routes scheduled for each day of the selected date range and associated with any selected users. |
| Actual Distance | The total distance actually traveled by drivers or field employees for any completed or started routes scheduled for each day of the selected date range and associated with any selected users. |
| Addresses Visited | The total number of addresses marked as “Visited” by your team members using the Route4Me Android and iOS mobile apps on routes scheduled for each day of the selected date range and any selected users. |
| Notes Added | The total number of Notes added to destinations by your team members using the Route4Me Web Platform or from Route4Me’s Android and iOS mobile apps on routes scheduled for each day of the selected date range and any selected users. |
Moreover, the “Graphs” section displays graphs comparing the planned details of routes to their actual performance. Additionally, learn more about Planned vs Actual route data.
| Data | Description |
|---|---|
| Route Distance | Predicted distance of the planned routes scheduled for the respective dates and the actual driven distance on these routes. |
| Destinations Visited | Total number of destinations on the planned routes scheduled for the respective dates and the number of destinations on these routes that have been marked as Visited. Destinations can be marked as Visited using Route4Me’s mobile apps. |
| Route Duration | Predicted duration (route travel time + route service time) of the planned routes scheduled for the respective dates and the actual duration (actual driving time + actual service time) on these routes. |
| Scheduled Routes | Predicted total number of planned and optimized routes scheduled for the respective dates within the selected timeframe. |
| Destinations Visited vs Detected | Number of destinations that have been marked as Visited on the planned routes scheduled for the respective dates and the number of destinations on these routes that have been detected as Visited. Destinations can be marked as Visited using Route4Me’s mobile apps. Destinations can be detected as Visited using Route4Me’s Geofencing. |
| Destinations Planned vs Visited | Predicted total number of destinations on the planned routes scheduled for the respective dates and the number of destinations that have been marked as Visited on these routes. Destinations can be marked as Visited using Route4Me’s mobile apps. |
| Average Marked Time on Site | Marked Time on Site is the time period from when a designation is marked as Visited to when it is marked as Done or Failed. This graph shows the average Marked Time on Site of all destinations on the planned routes scheduled for the respective dates. |
| Marked Time on Site | Marked Time on Site is the time period from when a designation is marked as Visited to when it is marked as Done or Failed. This graph shows the total Marked Time on Site of all destinations on the planned routes scheduled for the respective dates. |
| Average Service Time | Predicted average Service Time of all destinations on the routes scheduled for the respective dates. |
| Service Time | Predicted total amount of the Service Time of all destinations on the routes scheduled for the respective dates. |
| Destination Geofences Entered & Exited | Number of destinations that have been detected as Visited and Departed on the planned routes scheduled for the respective dates. Destinations can be detected as Visited and Departed using Route4Me’s Geofencing. |
| Notes | Total number of Notes added to destinations on the routes scheduled for the dates within the selected timeframe. |
| CO2 Emissions | The total amount of CO₂ emissions (metric tons) produced on the routes scheduled for the respective dates. CO₂ emissions data is calculated based on the fuel type and fuel consumption parameters of the vehicles assigned to the driven routes and the driving distance on these routes. |
| Order Cost | Predicted total Order Cost amount of all destinations on the planned routes scheduled for the respective dates. The Order Cost value is specified for each individual route destination. |
| Cube | Predicted total cubic volume of orders of all destinations on the routes scheduled for the respective dates. The Cube value is specified for each individual route destination. |
| Pieces | Predicted total Pieces amount of all destinations on the routes scheduled for the respective dates. The Pieces value is specified for each individual route destination. |
| Revenue | Predicted total Revenue amount of all destinations on the routes scheduled for the respective dates. The Revenue value is specified for each individual route destination. |
| Weight | Predicted total Weight amount of all destinations on the routes scheduled for the respective dates. The Weight value is specified for each individual route destination. |
Export Data – Download Route Data As Spreadsheet
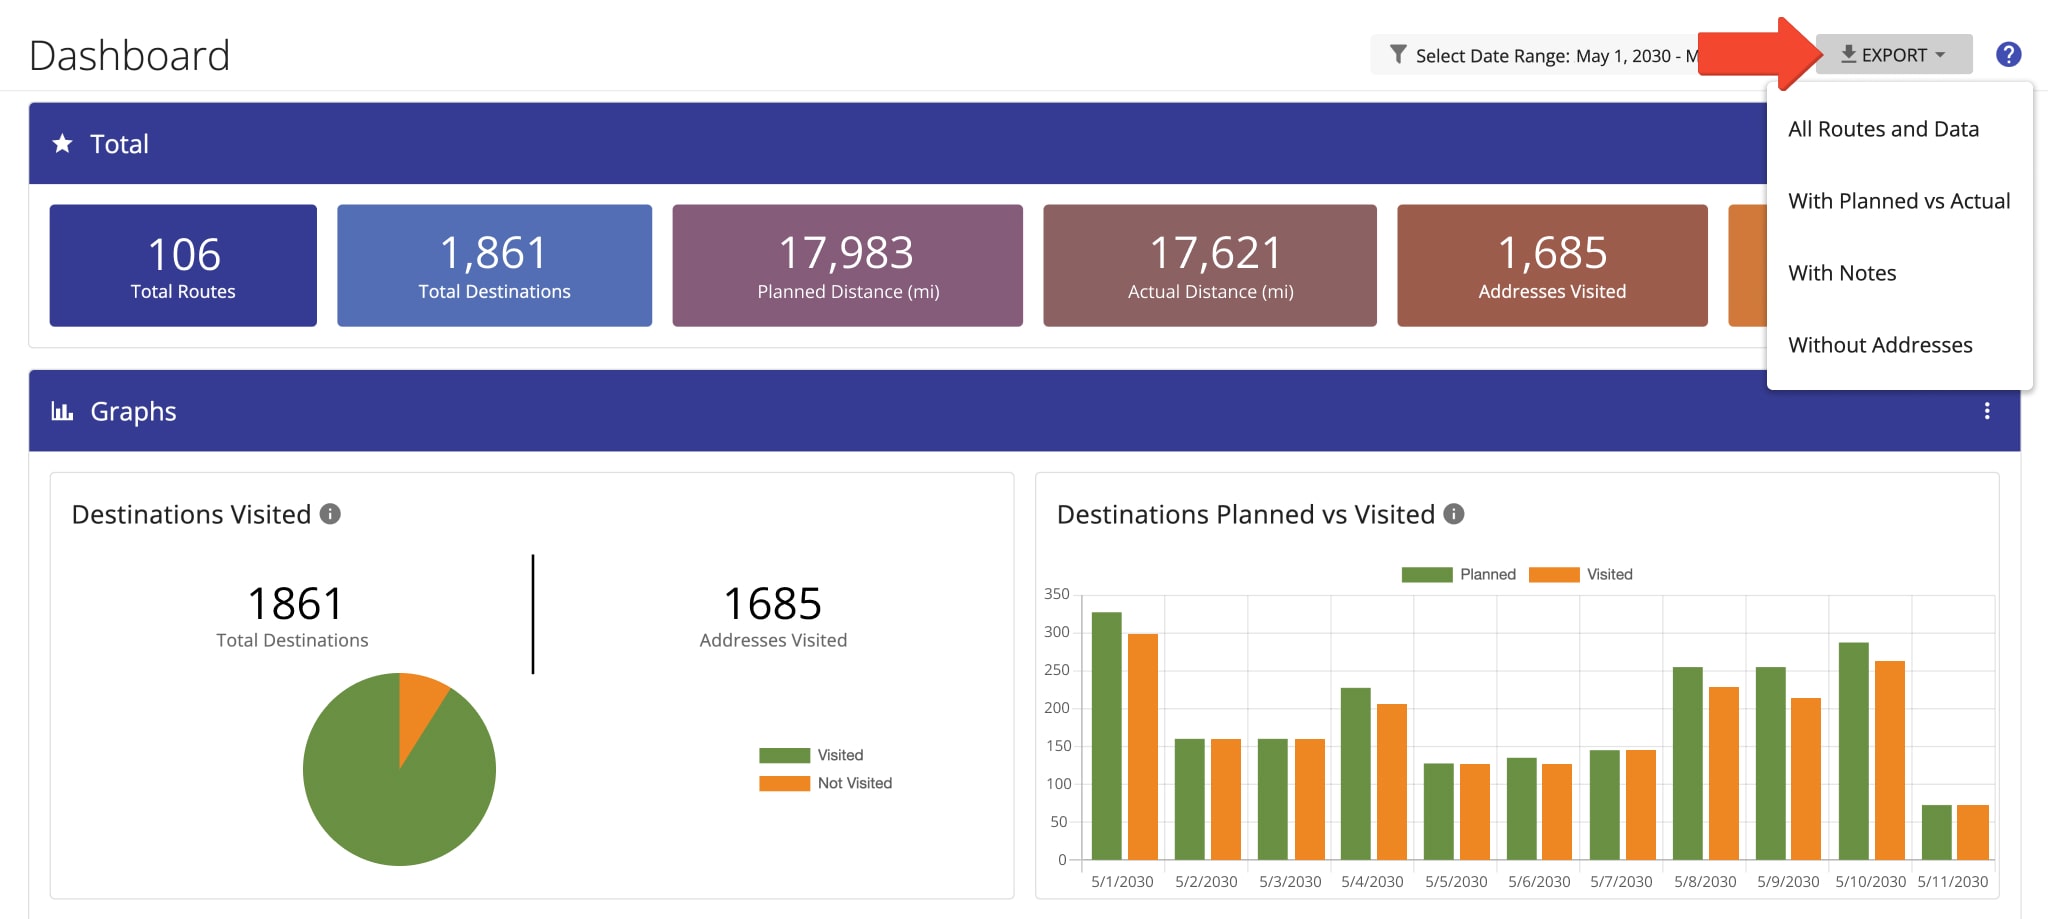
After filtering and viewing route information on the Dashboard, you can then export your preferred data. To export a customized report from your Route4Me Business Route Planner Software, go to “Analytics” and then “Dashboard” from the Navigation Menu. After applying the preferred filters, click the “Export” button and select the preferred export option from the menu.
| Export | Description |
|---|---|
| All Routes and Data | Export a Dashboard report with all routes and their associated data. |
| With Planned vs Actual | Export a Dashboard report with all routes and their associated data, including both planned and actually marked and detected performance data. |
| With Notes | In addition to all available route data, your export file will also include all added route notes with note media attachments (note attachments as videos, photos, etc., are included in the export file as URLs). |
| Without Addresses | Export a minimal Dashboard report without addresses. Contains only the parameters of the exported routes (i.e., route names, schedules, addresses sequences, etc.) without detailed data about each destination (i.e., Cube, Weight, phone number, Email, etc.). |
Visit Route4Me's Marketplace to Check out Associated Modules:
- Operations
Audit Logging and Activity Stream
- Operations
Custom Data Add-On
- Operations
Advanced Team Management Add-On
About author: Alex Yasko
Alex Yasko is the Go-to-Market Product Manager and Information Architecture Manager at Route4Me. With thousands of hours of experience, Alex specializes in breaking down complex last-mile optimization and routing scenarios into simple, actionable instructions, helping last-mile businesses streamline their operations effortlessly.