CO2 Emissions Statistics By Route And Vehicle
Going green is a popular trend among many companies. The positive public response, government regulations constraints, and legal and tax advantages are just some of the benefits. Thus, more and more businesses are trying to cut their CO2 emissions. From using electric or hybrid vehicles to changing the type of fuel they use. However, electric vehicles are still an expensive alternative. Moreover, many businesses that need their vehicles to travel long distances can’t use electric vehicles due to their limited operating range. Keeping track of your CO2 emissions helps you to reduce the carbon footprint of your operations.
Route4Me enables you to effortlessly track how much carbon dioxide is emitted by your entire fleet, as well as by each individual vehicle. With Route4Me’s Dashboard, you can drill down into CO2 statistics by route, driver, or vehicle. Reduce your carbon footprint and environmental impact with smart vehicle utilization and data-driven sustainability.
NOTE: The Classic Dashboard is deprecated and may not be available on your account. You can use Business Insights to access the same analytics and reporting tools described in this guide, as well as more in-depth performance metrics and data filters.
Table of Contents
Open CO2 Emissions – View Carbon Emissions On Customizable Dashboard
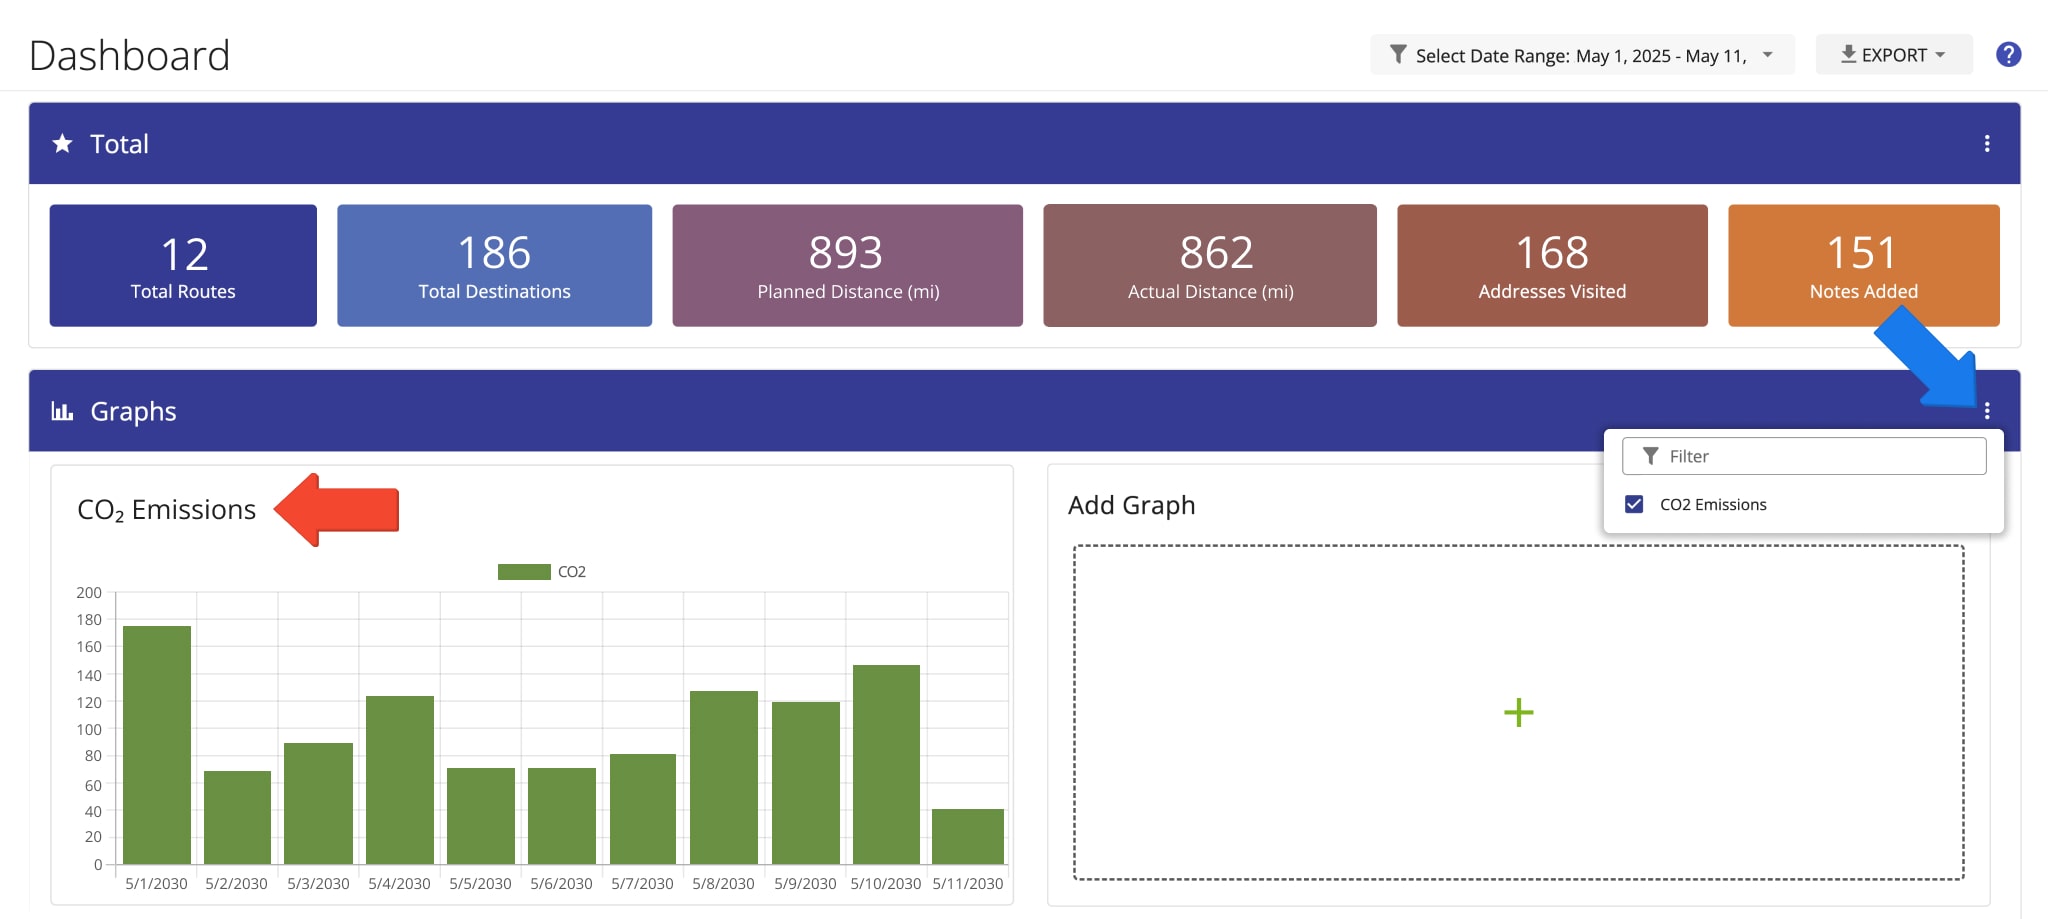
To view the carbon dioxide emissions of your fleet vehicles, click the button below to open your Dashboard.
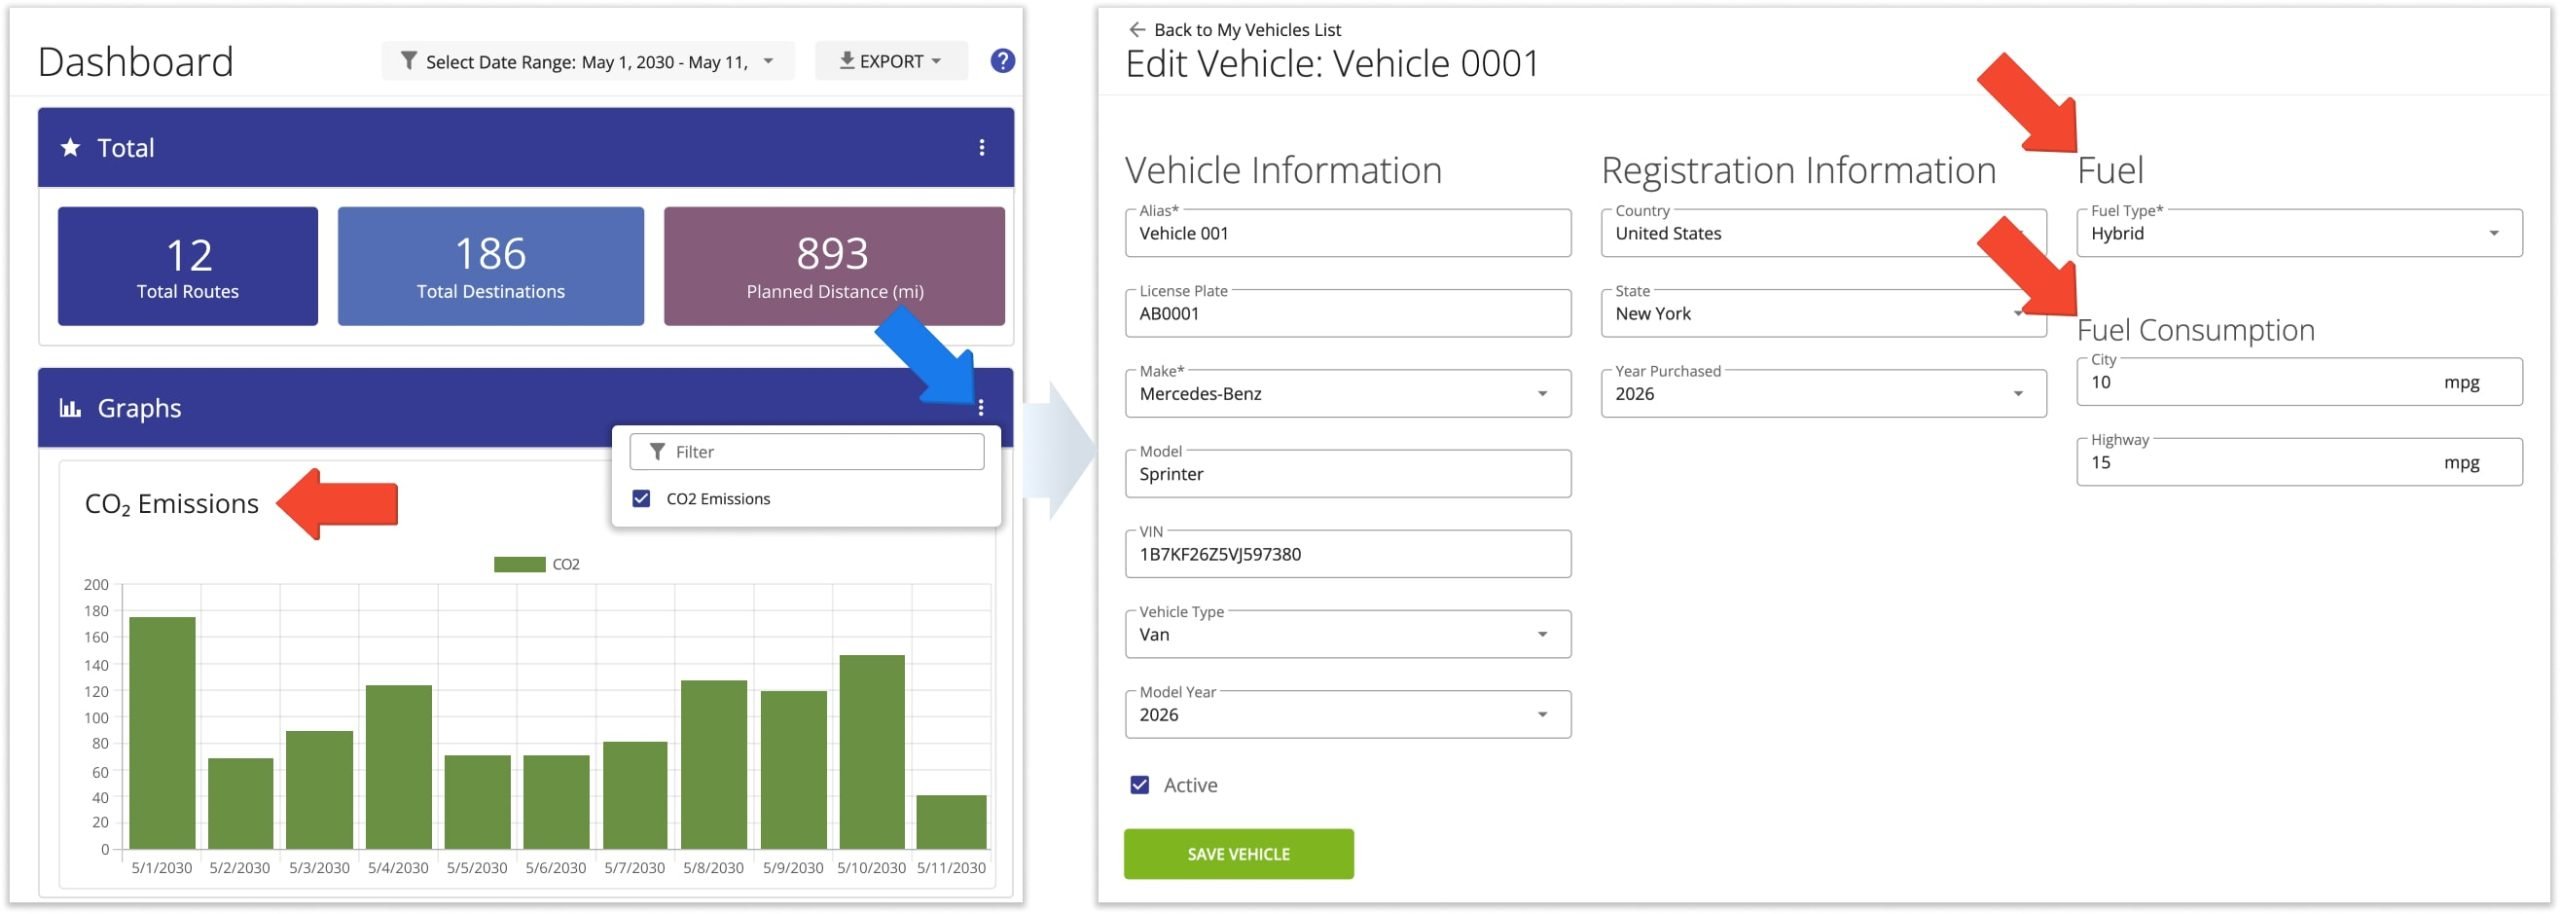
Then, click the Three-dot Icon in the “Graphs” section and check the box next to “CO2 Emissions“. The enabled graph displays the carbon emissions for the specified date range and users in metric tons.
Filter CO2 Emissions – Show Carbon Emissions For Specific Time And Users
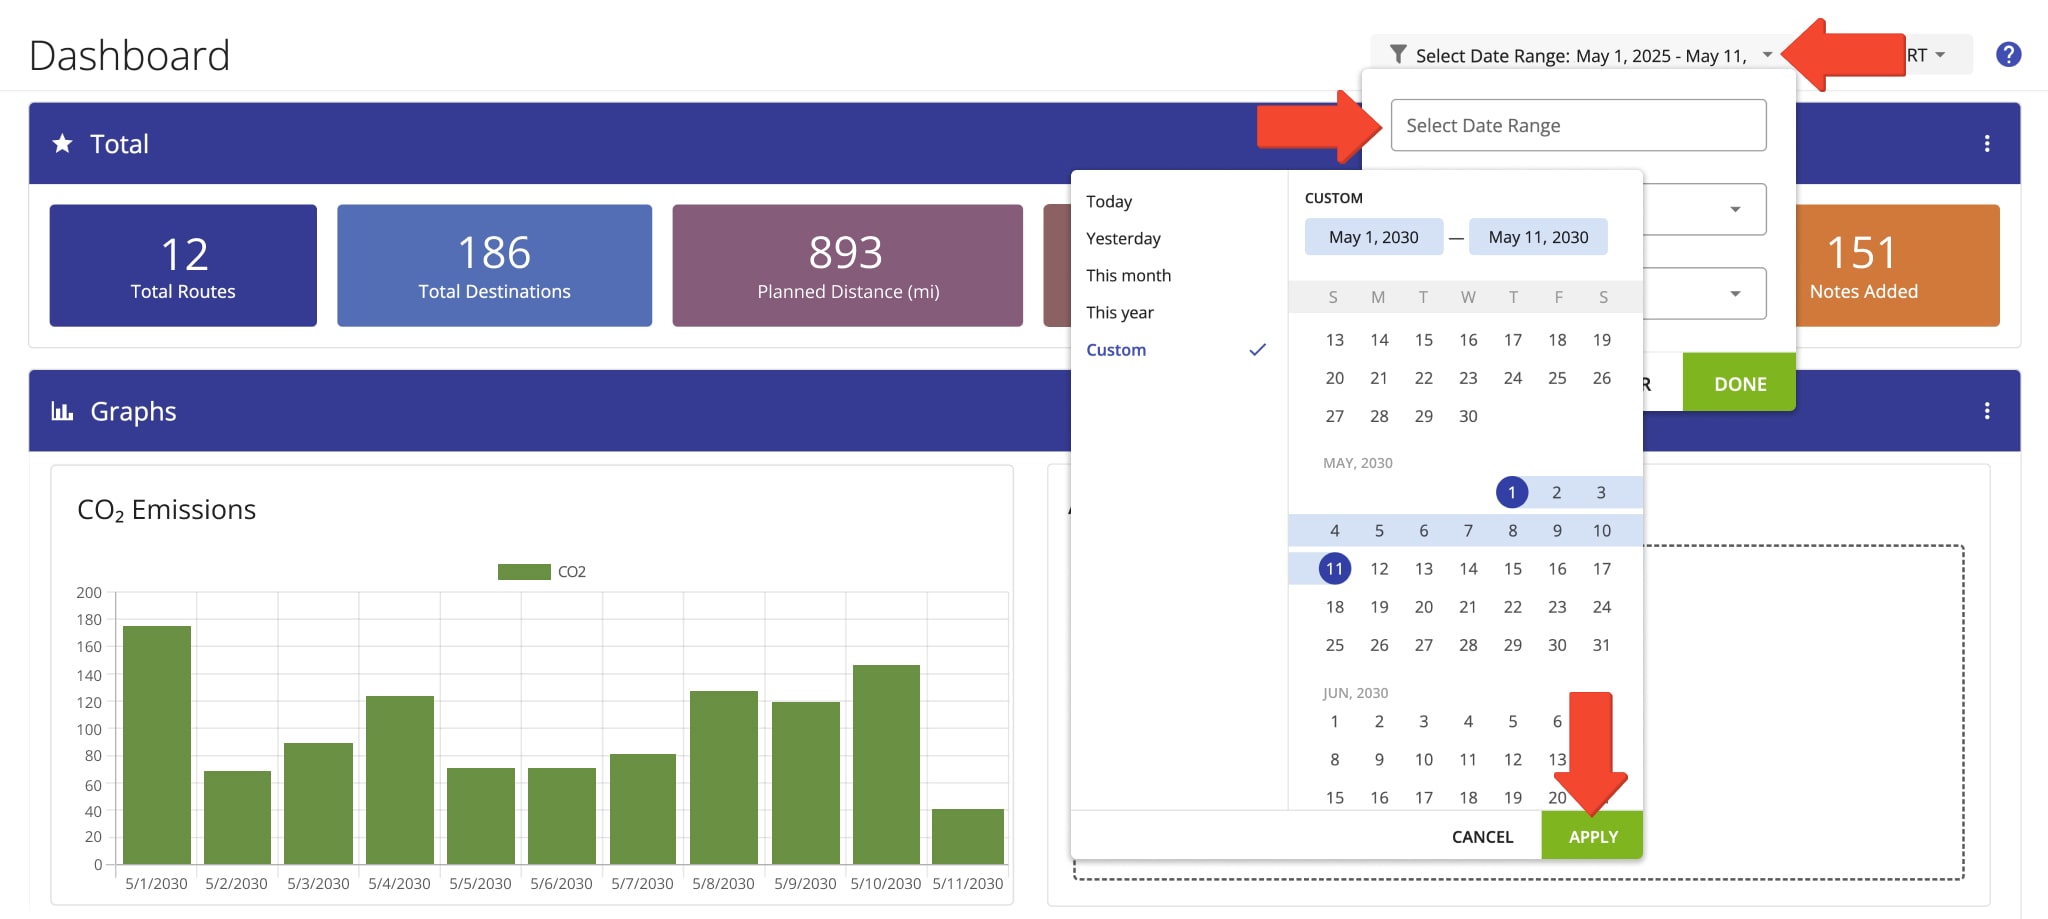
Next, you can use the filter field to view the CO2 emissions statistics for the preferred time period, users, and group emissions data by date or destination type. To do so, click the “Select Date Range” field. Then, click “Select Date Range” and filter the routes to display on the Dashboard for a specific date or time frame.
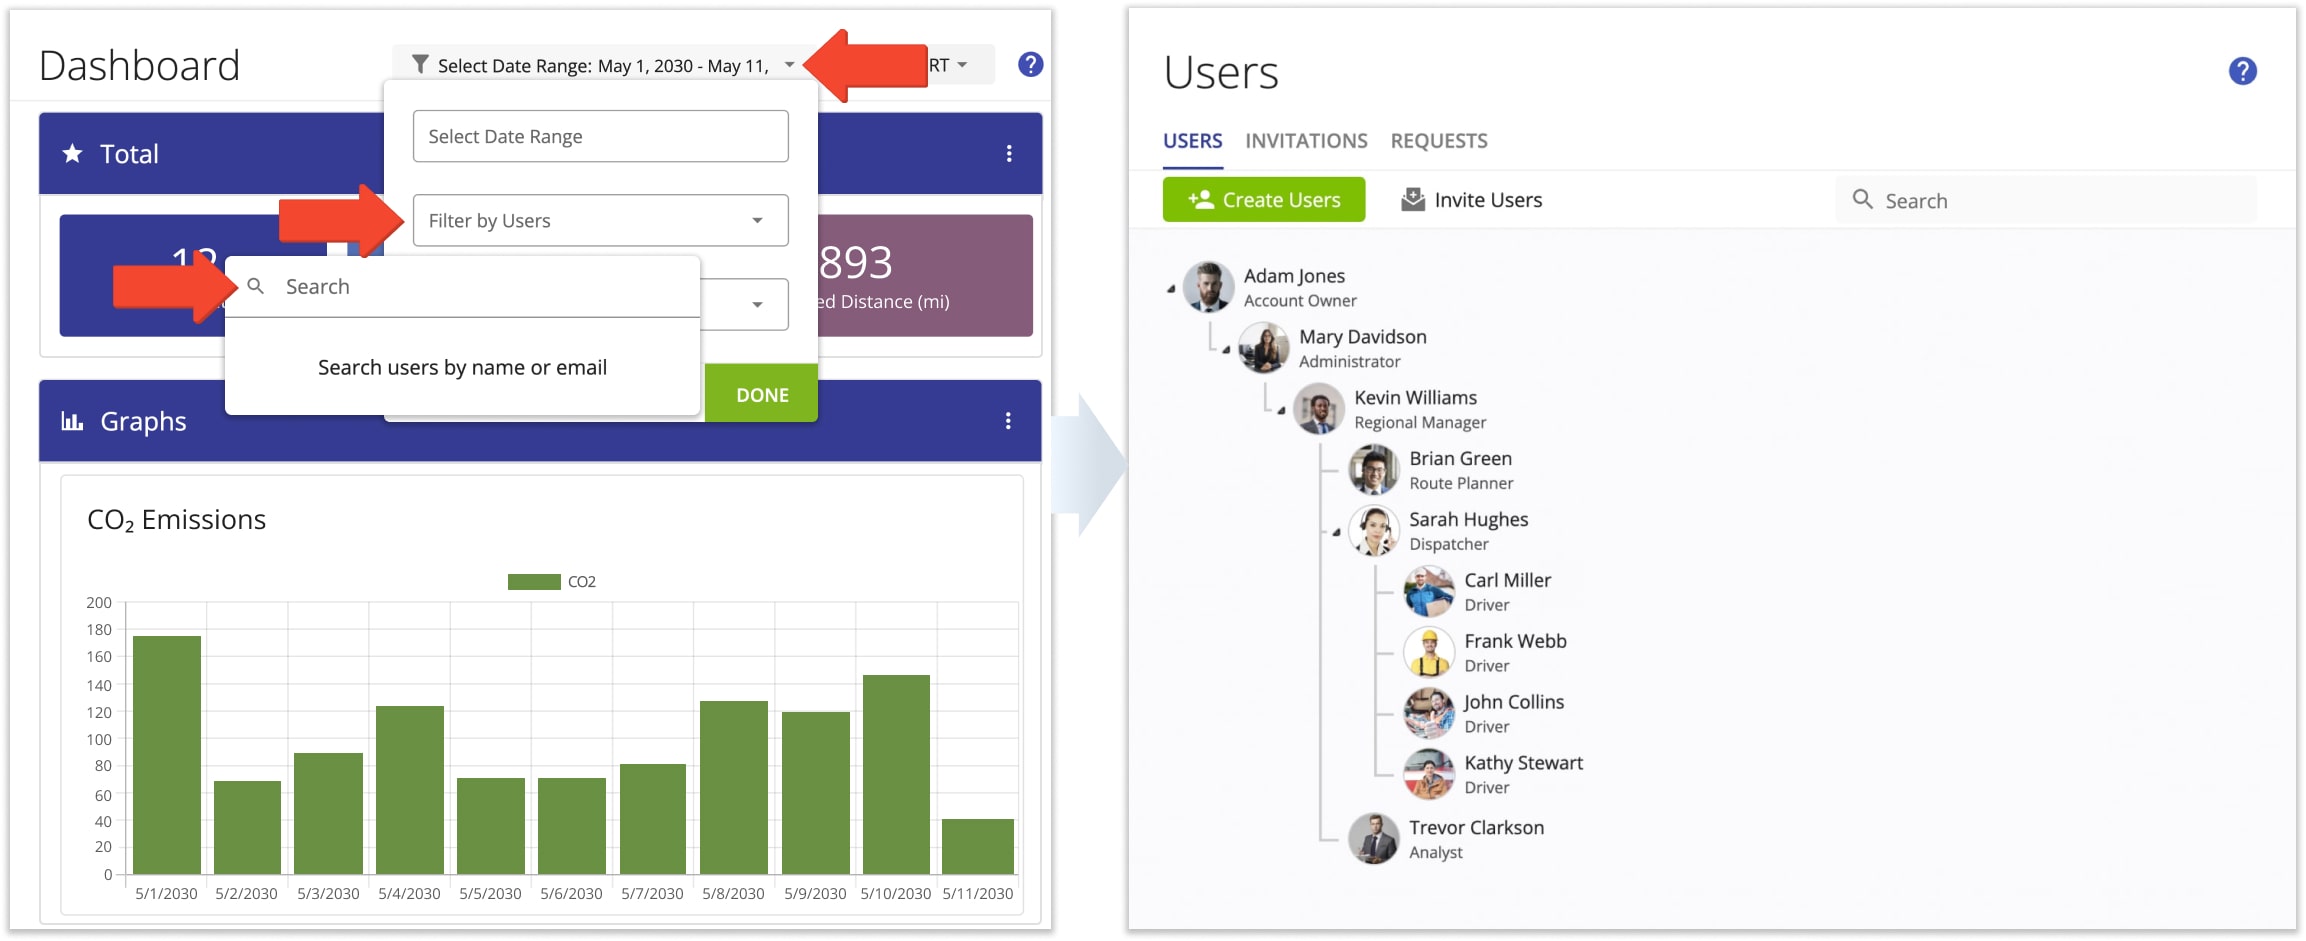
To filter the CO2 emissions information displayed on your Dashboard by a particular team member and their sub-users, click “Filter by Users“. When filtering emissions by team members, the Dashboard displays the CO2 emissions of those assigned vehicles to the routes associated with the selected members. Additionally, learn more about Route4Me’s Team Hierarchy and Company Fleet Visibility Settings.
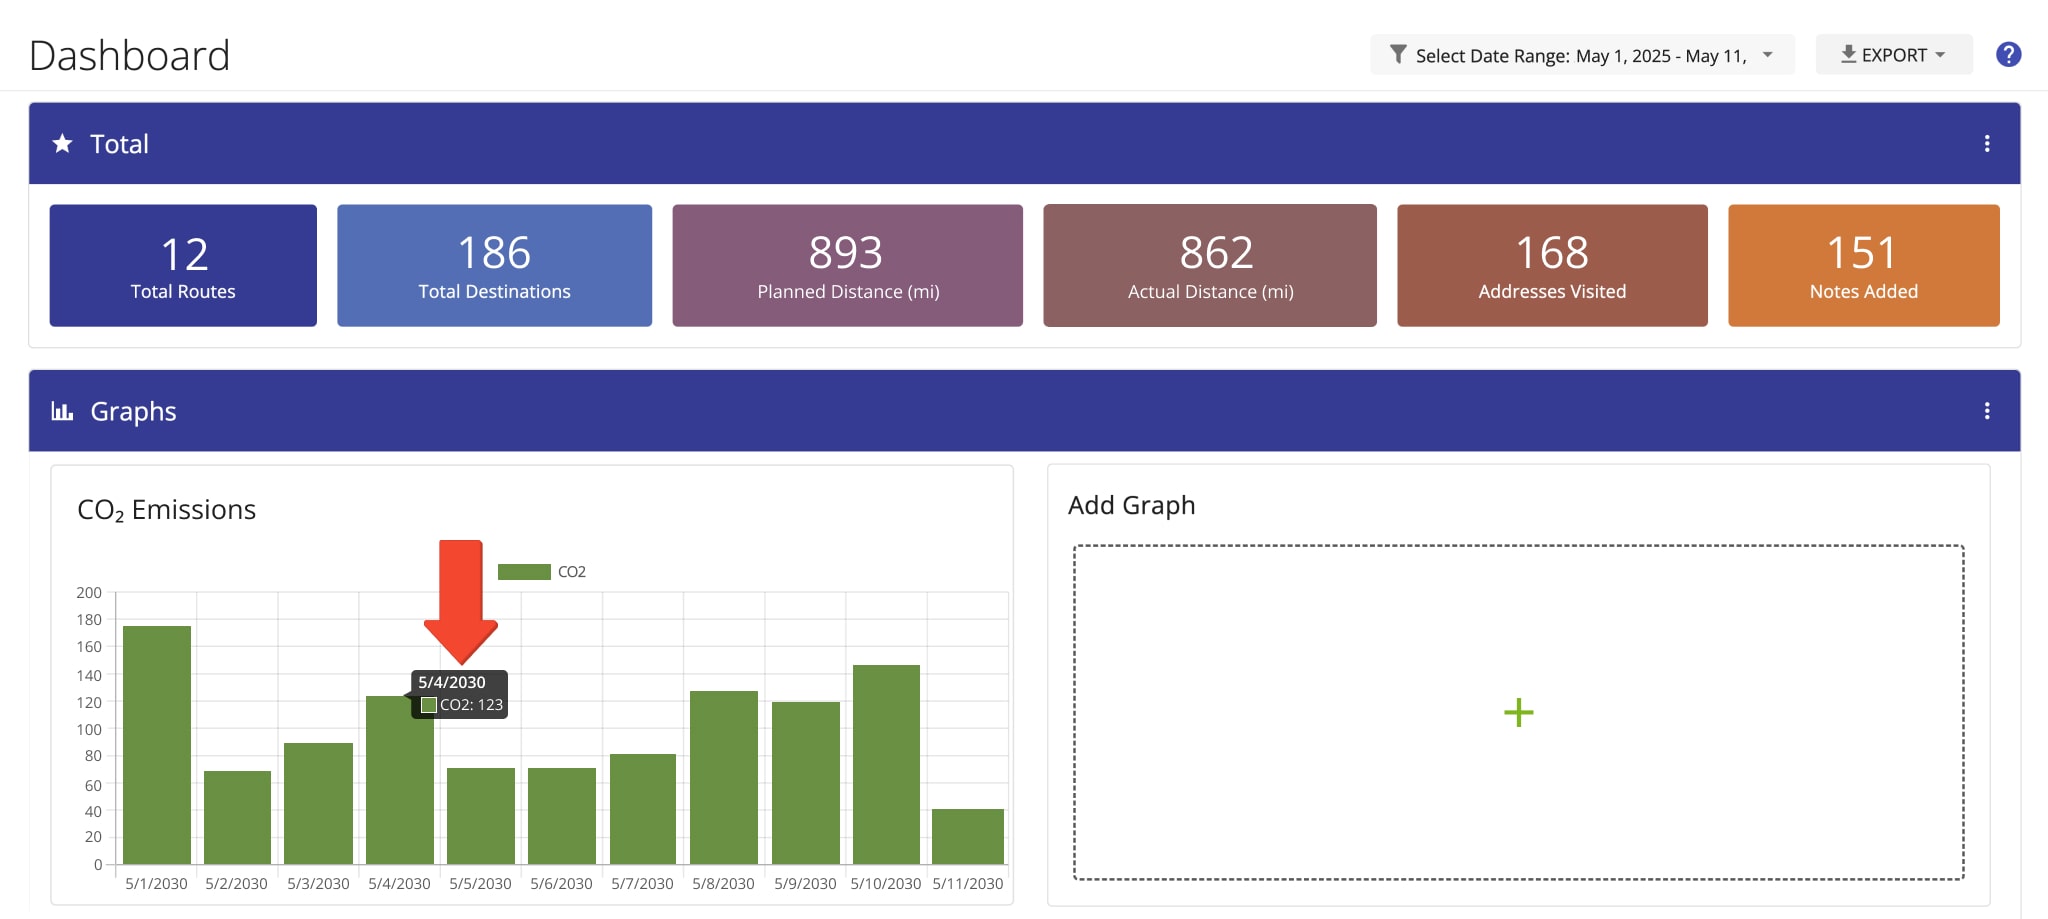
After applying the preferred filters, view the “CO₂ Emissions” section accordingly. There, you can view all CO2 emissions of vehicles that are assigned to the routes scheduled for each day of the selected date range and associated with any selected team members. To view the exact amount of emitted CO2 for a particular date, hover over the graph bar of the date you want to check. Additionally, learn more about Dashboard Settings.
Fuel Consumption Settings – Adjust Vehicle Fuel Consumption
The amount of emitted CO2 is calculated based on the fuel type and the miles per gallon (mpg) of the vehicles assigned to routes scheduled for the selected date range and associated with the selected members. NOTE: To provide CO2 emissions data of your future routes, Route4Me’s Enterprise Route Software calculates your CO2 emissions based on the total distance of each route. Thus, when you are filtering CO2 emissions by future dates, you will be able to see how much CO2 will be emitted on the corresponding future routes.
To check or edit the fuel consumption settings of a particular vehicle, go to “Team” and then “Vehicles” from the Navigation Menu to open the list of all vehicles associated with your Route4Me account. Next, click the “Edit” button next to the vehicle you want to check or modify. In the “Fuel” section, you can view and modify the following fuel information of the opened vehicle:
| Data | Description |
|---|---|
| Fuel Type | The total number of routes scheduled for each day of the selected date range and associated with any selected users. |
| City, mpg | The total number of all addresses included in routes scheduled for each day of the selected date range and associated with any selected users. |
| Highway, mpg | The total distance of all planned routes scheduled for each day of the selected date range and associated with any selected users. |
Visit Route4Me's Marketplace to Check out Associated Modules:
- Operations
Audit Logging and Activity Stream
- Operations
Custom Data Add-On
- Operations
Advanced Team Management Add-On
About author: Alex Yasko
Alex Yasko is the Go-to-Market Product Manager and Information Architecture Manager at Route4Me. With thousands of hours of experience, Alex specializes in breaking down complex last-mile optimization and routing scenarios into simple, actionable instructions, helping last-mile businesses streamline their operations effortlessly.