Strategic Optimizations Data Catalog – Data Columns And Filters Database
Route4Me’s Strategic Optimizations automate complex cycle planning for multi-frequency delivery and service schedules over long planning periods. On this page, you can find a comprehensive list of all data columns and filter options available for your Strategic Optimizations and associated entities like Scenarios, Destination Schedules, and more.
NOTE: “Cycle” in Recurring Routing with Strategic Optimizations refers to an instance when a specific Strategic Schedule repeats.
Table of Contents
Strategic Optimizations – Filters
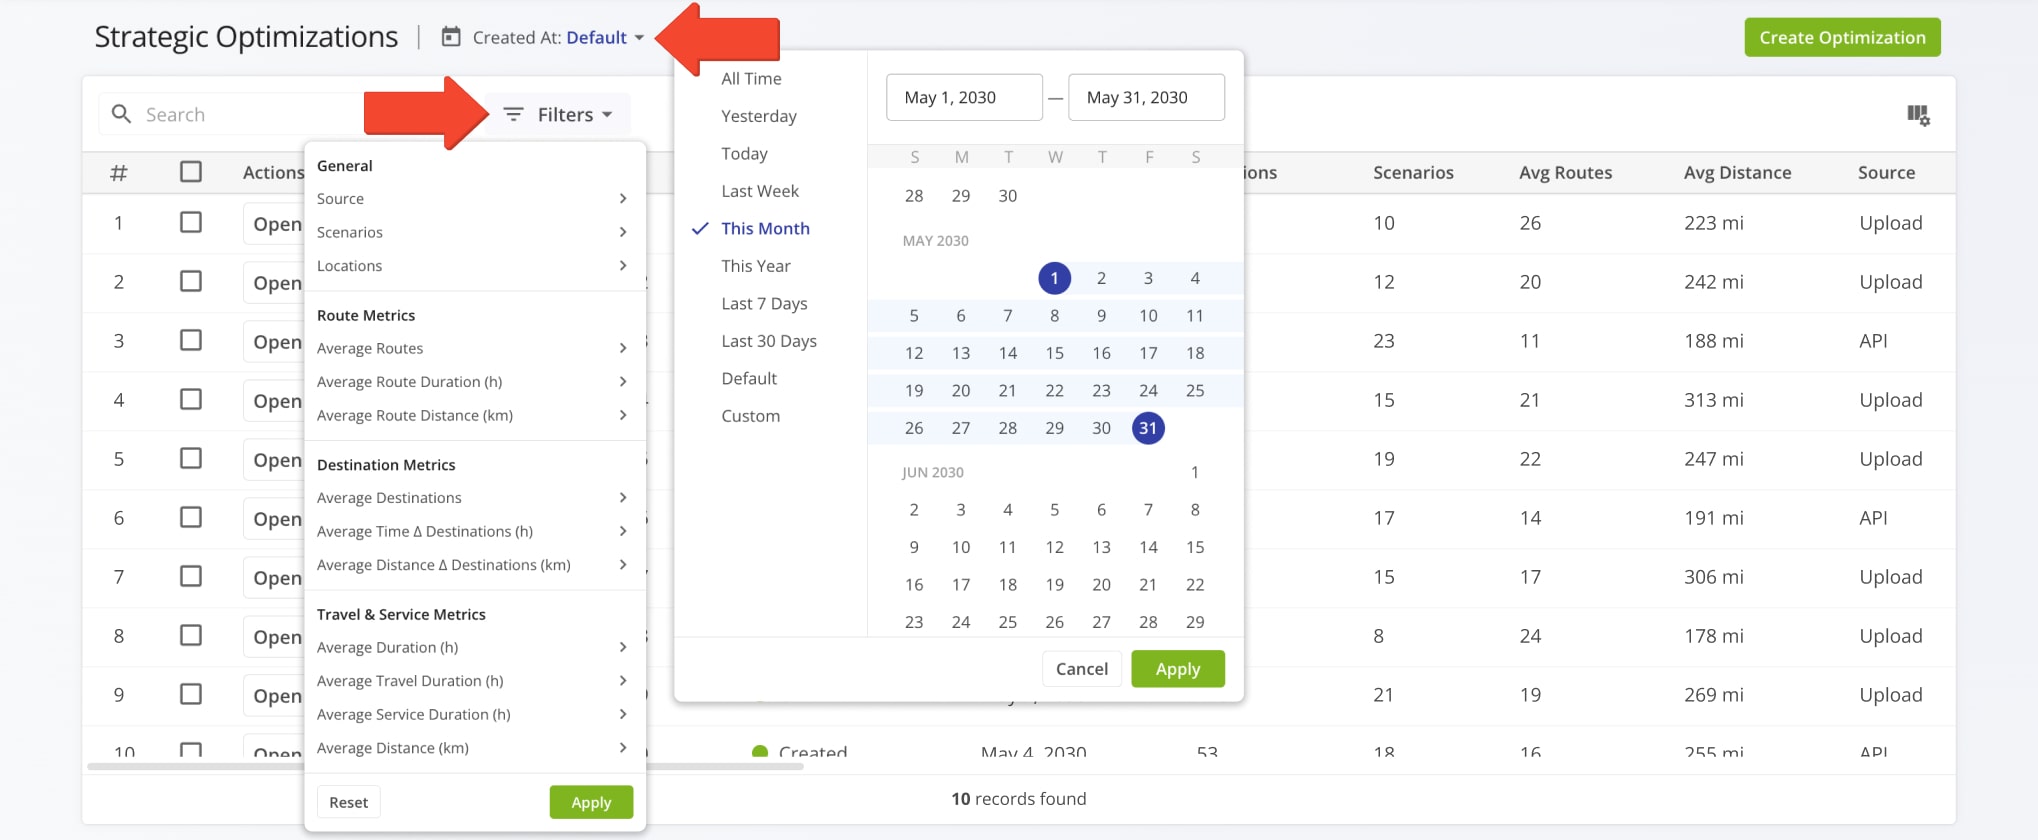
To find a specific Strategic Optimization on your account, you can use custom filters or search by name with the “Search” field. You can find a full list of Strategic Optimization Filters in the table below.
| Filter | Description | |
|---|---|---|
| General | ||
| Source | How the strategic optimization was created, i.e. via SFTP, Upload, or API. | |
| Scenarios | Total number of scenarios included in the strategic optimization. | |
| Locations | Total number of locations included in the optimization scenarios and routes. | |
| Route Metrics | ||
| Avg Routes | Average number of routes per week. | |
| Avg Route Duration (h) | Average duration of routes in Strategic Optimizations. | |
| Avg Route Distance (mi) | Average distance of routes in the Strategic Optimization. | |
| Destination Metrics | ||
| Average Destinations | Average number of destinations on routes included in the strategic optimization. | |
| Avg Time Delta Destinations (h) | Average time between destinations on routes included in the strategic optimization. | |
| Avg Distance Delta Destinations (mi) | Average distance between destinations on routes included in the strategic optimization. | |
| Travel & Service Metrics | ||
| Average Duration (h) | Average duration of routes included in the strategic optimization. Combination of Travel Duration and Service Duration. | |
| Average Travel Duration (h) | Average Travel Time Duration of routes included in the strategic optimization. | |
| Average Service Duration (h) | Average Service Time Duration of routes included in the strategic optimization. | |
| Average Distance (mi) | Average distance of routes included in the strategic optimization. | |
Strategic Optimizations – Display Columns
To customize the columns on your Strategic Optimizations page, click the Display Columns Button. Then, check the boxes next to columns you want to enable. You can change their positions by dragging column names. Click “Apply” to save your changes.
These data items also correspond to filter options. See the table below for more details on the available data values.

| Column | Description | |
|---|---|---|
| General | ||
| Name | Unique name or alias of the Strategic Optimization. You can use names to find it via the “Search” field. | |
| Created | Date when the strategic Strategic Optimization was created via SFTP data sync. | |
| Scenarios | Total number of scenarios included in the Strategic Optimization. | |
| Locations | Total number of locations included in the Optimization Scenarios and Routes. | |
| Depots | Total number of depots (route start addresses) used in Scenario Routes. | |
| Source | How the strategic optimization was created. Currently supports SFTP. | |
| User | User who uploaded the strategic optimization. | |
| Route Metrics | ||
| Avg Routes | Average number of routes per week. | |
| Avg Route Distance | Average distance of routes in the Strategic Optimization. | |
| Avg Route Duration | Average duration of routes in the Strategic Optimization. | |
| Avg Route Pieces | Average Pieces value (number of units) of Orders on routes in the Strategic Optimization. | |
| Avg Route Weight | Average Weight value of Orders on routes in the Strategic Optimization. | |
| Avg Route Cube | Average Cube (volume) value of Orders on routes in the Strategic Optimization. | |
| Avg Route Cost | Average cost associated with routes in the Strategic Optimization. | |
| Avg Route Revenue | Average revenue generated by routes in the Strategic Optimization. | |
| Destination Metrics | ||
| Avg Destinations | Average number of destinations on routes included in the strategic optimization. | |
| Avg Time Delta Destinations | Average time between destinations on routes included in the strategic optimization. | |
| Avg Travel Delta Destinations | Average distance between destinations on routes included in the strategic optimization. | |
| Travel & Service Metrics | ||
| Avg Duration | Average duration of routes included in the strategic optimization. Combination of Travel Duration and Service Duration. | |
| Avg Travel Duration | Average Travel Time Duration of routes included in the strategic optimization. | |
| Avg Service Duration | Average Service Time Duration of routes included in the strategic optimization. | |
| Avg Distance | Average distance of routes included in the strategic optimization. | |
Strategic Optimization > Scenarios – Filters
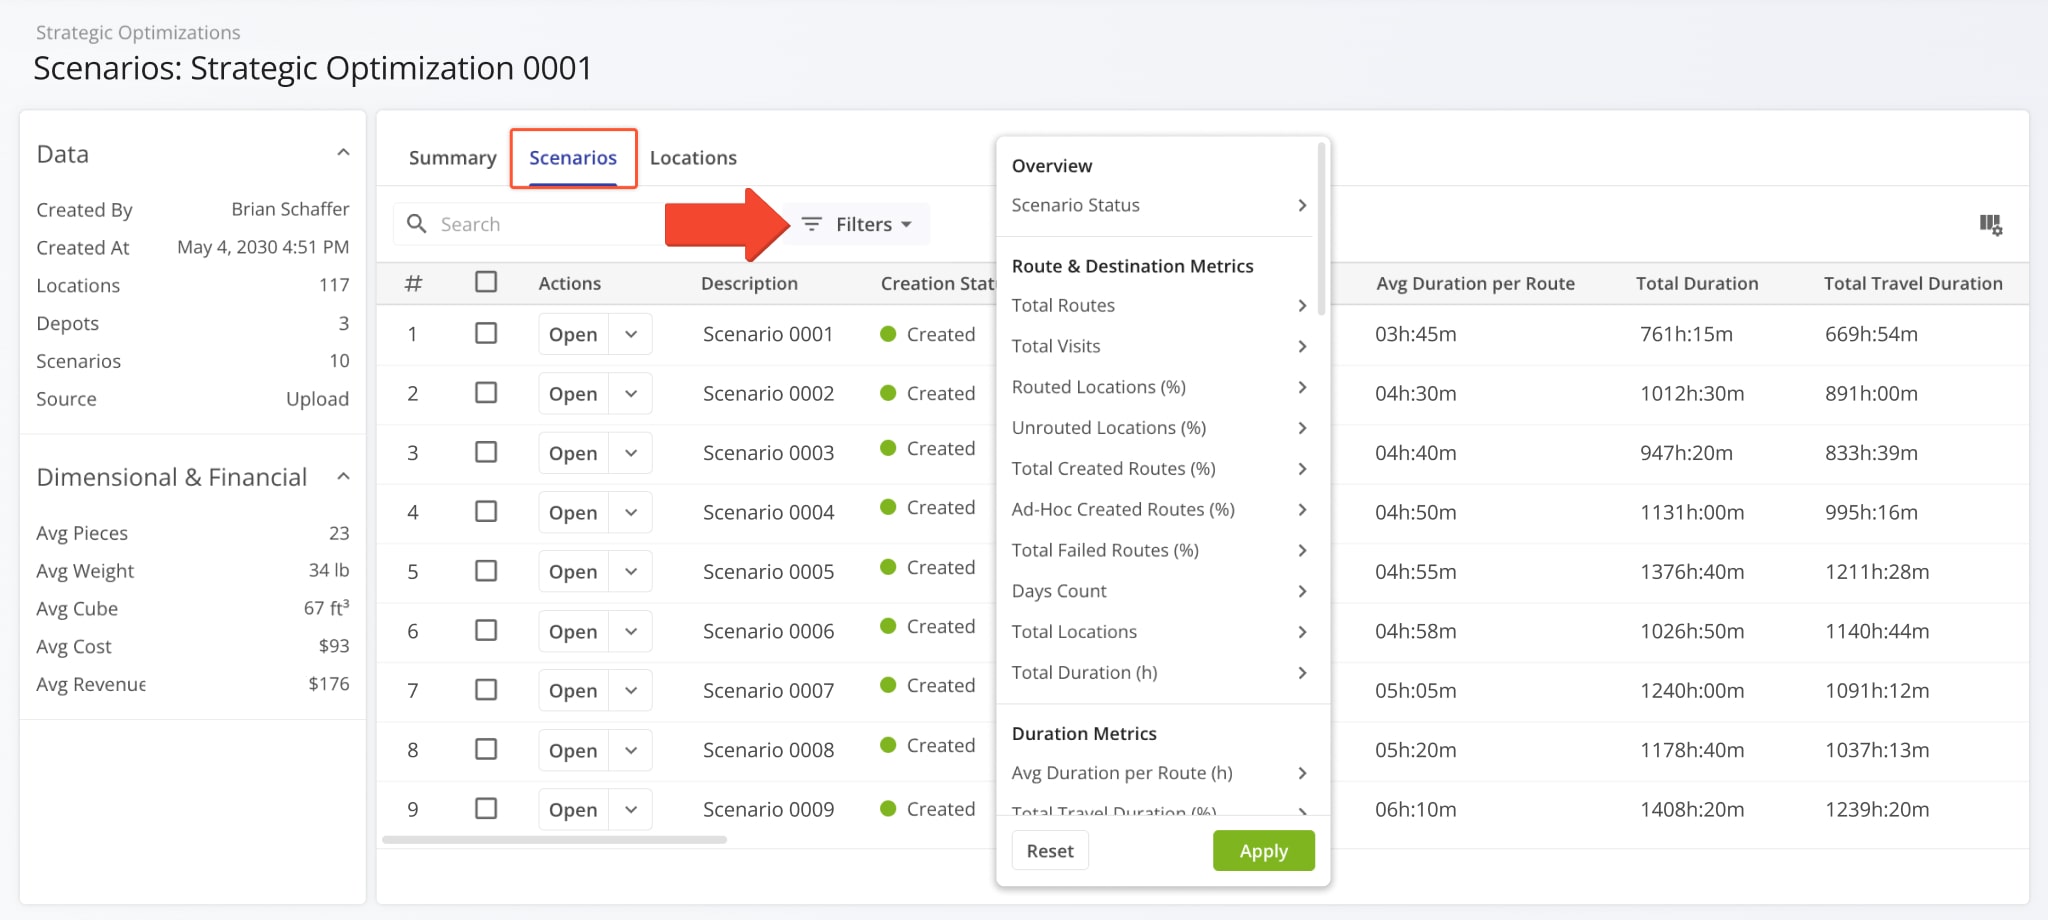
Click the “Scenarios” tab to see a customizable list of all Scenarios included in the open Strategic Optimization.
To filter the list and see only the Strategic Scenarios relevant to your needs, click “Filters” and enable your preferred options. See the table below for more details.
| Filter | Description | |
|---|---|---|
| Overview | ||
| Scenario Status | Current status of the Scenario. Learn more about Strategic Scenario Management. | |
| Route & Destination Metrics | ||
| Total Routes | Number of routes included in the Scenario. | |
| Total Visits | Number of visits to be planned for routes in the Scenario | |
| Routed Locations (%) | Percentage of all Locations included in Scenario Routes. | |
| Unrouted Locations (%) | Percentage of all Locations not included in Scenario Routes. | |
| Total Created Routes (%) | Percentage of Scenario Routes that have been successfully created. | |
| Ad Hoc Created Routes (%) | Percentage of planned routes imported as ad-hoc routes. | |
| Total Failed Routes (%) | Routes that couldn’t be optimized based on constraints and optimization settings as a percentage of total planned routes. | |
| Days Count | Total number of days on which Scenario Routes are scheduled. | |
| Total Locations | Total number of Locations included in Scenario Routes. | |
| Total Duration (h) | Total duration of routes in Scenarios. | |
| Duration Metrics | ||
| Avg Duration per Route (h) | Average duration of routes in the Scenario. | |
| Total Travel Duration % | Percentage of total route duration spent as Travel Time. | |
| Total Service Duration % | Percentage of total route duration spent as Service Time. | |
| Distance Metrics | ||
| Total Distance (mi) | Total combined distance of Scenario Routes. | |
| Average Route Distance (mi) | Average travel distance of routes in Scenarios. | |
| Dimensional & Financial | ||
| Total Pieces | Total number of Pieces (units) of Orders included in Scenario Routes. | |
| Total Weight | Total Weight value of Orders included in Scenario Routes. | |
| Total Cube | Total Cube value (physical volume) of Orders included in Scenario Routes. | |
| Total Cost | Total Cost value associated with in Scenario Routes. | |
| Total Revenue | Total Revenue generated by completing Scenario Routes. | |
Strategic Optimization > Scenarios – Display Columns
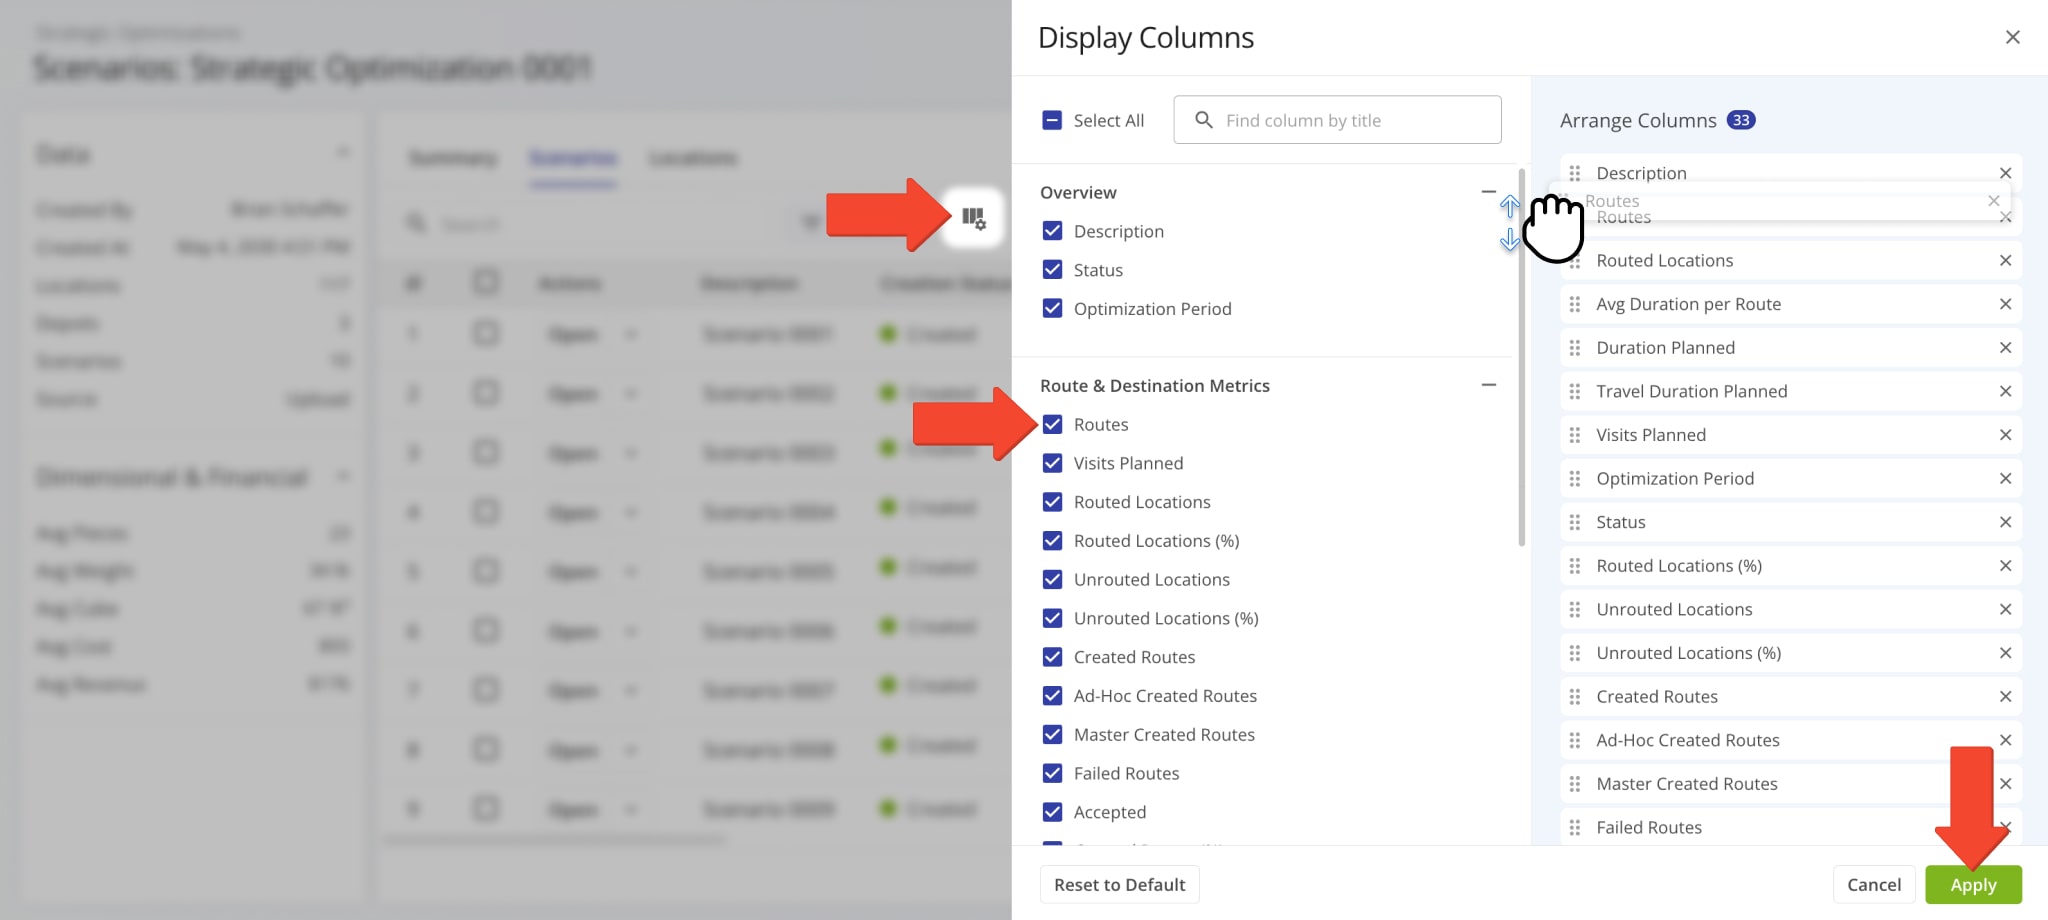
You can also customize the data columns shown in the “Scenarios” section. Click the Display Columns Button, check the boxes next to columns you want to enable, and click “Apply” to save your changes.
To arrange the order of your Display Columns, you can drag column names up or down in the “Arrange Columns” section on the right. See the table below for a full list of available data columns.
| Column | Description | |
|---|---|---|
| Overview | ||
| Description | Functions as the alias of a scenario and includes schedule details and parameters. | |
| Status | Current status of the Scenario. Learn more about Strategic Scenario Management. | |
| Optimization Period | The period of time across which scenario routes will be scheduled. | |
| Route & Destination Metrics | ||
| Routes | Number of routes included in the Scenario. | |
| Total Visits | Number of visits to be planned for routes in the Scenario | |
| Routed Locations | Number of Locations included in Scenario Routes. | |
| Routed Locations (%) | Percentage of all Locations included in Scenario Routes. | |
| Unrouted Locations | Number of Locations not included in Scenario Routes. | |
| Unrouted Locations (%) | Percentage of all Locations not included in Scenario Routes. | |
| Created Routes | Total number of scenario routes that have been successfully created. | |
| Ad Hoc Created Routes | Total number of planned routes imported as ad-hoc routes. | |
| Master Created Routes | Total number of planned routes imported as Master Routes for Recurring Routing. | |
| Failed Routes | Number of routes that couldn’t be optimized based on constraints and optimization settings. | |
| Accepted | Date on which the scenario was accepted. | |
| Created Routes (%) | Percentage of scenario routes that have been successfully created. | |
| Ad Hoc Created Routes (%) | Percentage of planned routes imported as ad-hoc routes. | |
| Master Created Routes (%) | Total number of planned routes imported as Master Routes for Recurring Routing. | |
| Failed Routes (%) | Routes that couldn’t be optimized based on constraints and optimization settings as a percentage of total planned routes. | |
| Duration Metrics | ||
| Avg Duration per Route | Average duration of routes in the Scenario. | |
| Total Duration | Total duration of routes in the Scenario. | |
| Total Travel Duration | Total combined duration of scenario route travel time. | |
| Total Service Duration | Total duration of route Service Time in the Scenario. | |
| Avg Time Δ Destinations | Average travel time between Scenario Route Destinations. | |
| Total Travel Duration % | Percentage of total route duration spent as Travel Time. | |
| Total Service Duration % | Percentage of total route duration spent as Service Time. | |
| Distance Metrics | ||
| Avg Distance per Route | Average travel distance of routes in the Scenario. | |
| Total Distance | Total combined distance of Scenario Routes. | |
| Avg Distance Δ Destinations | Average travel distance between Scenario Route Destinations. | |
| Dimensional & Financial | ||
| Total Pieces | Total number of Pieces (units) of Orders included in Scenario Routes. | |
| Total Weight | Total Weight value of Orders included in Scenario Routes. | |
| Total Cube | Total Cube value (physical volume) of Orders included in Scenario Routes. | |
| Total Cost | Total Cost value associated with in Scenario Routes. | |
| Total Revenue | Total Revenue generated by completing Scenario Routes. | |
Strategic Optimization > Locations – Filters
Click the “Locations” tab to see the Locations associated with the Strategic Optimization and its Scenarios. Additionally, this is where you can find data relating to the visit frequency and pattern of each Location. You can also click the Map Icon in the top-right to open the dynamic Locations Map.
To find specific Scenarios or Locations in the Strategic Optimization, you can use custom filters or search by name or attribute with the “Search” field. Click the “Filters” button to refine the data shown on this page. The table below contains a full list of filters.
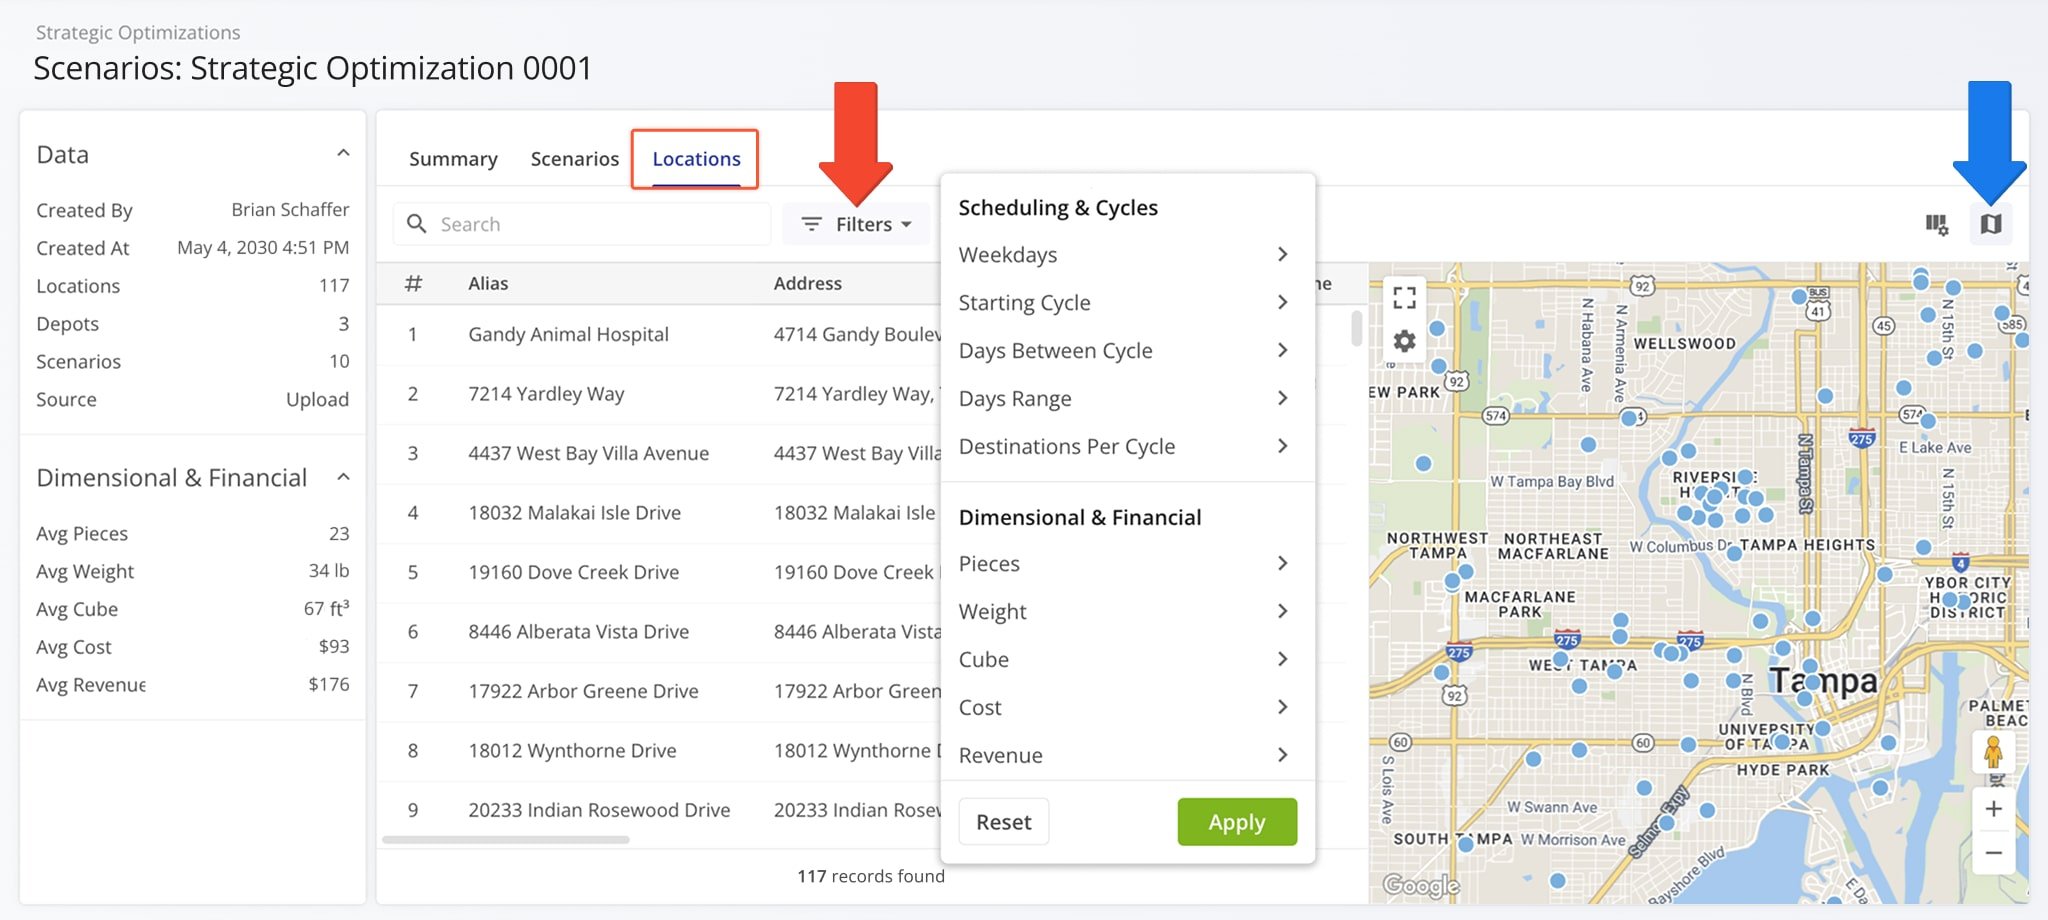
| Filter | Description | |
|---|---|---|
| Scheduling & Cycles | ||
| Weekdays | Which days of the week the Location is scheduled as a Destination on routes in the Strategic Optimization. | |
| Starting Cycle | Which Strategic Cycle the Location is first scheduled as a Destination on routes in the Strategic Optimization. | |
| Days Between Cycle | Number of days between Strategic Cycles in which the location is scheduled as a Destination on routes in the Strategic Optimization. | |
| Days Range | Days before and after the Days Between Cycle value, used to account for delays and scheduling specifics. | |
| Destinations Per Cycle | Maximum number of times the Location can be included in routes as a Destination per recurring schedule cycle. | |
| Dimensional & Financial | ||
| Pieces | Planned number of units associated with the Location. | |
| Weight | Planned Weight value associated with the Location. | |
| Cube | Planned Cube value (cubic volume) associated with the Location. | |
| Cost | Planned Cost value associated with the Location. | |
| Revenue | Planned Revenue generated by completing a visit at the Location. | |
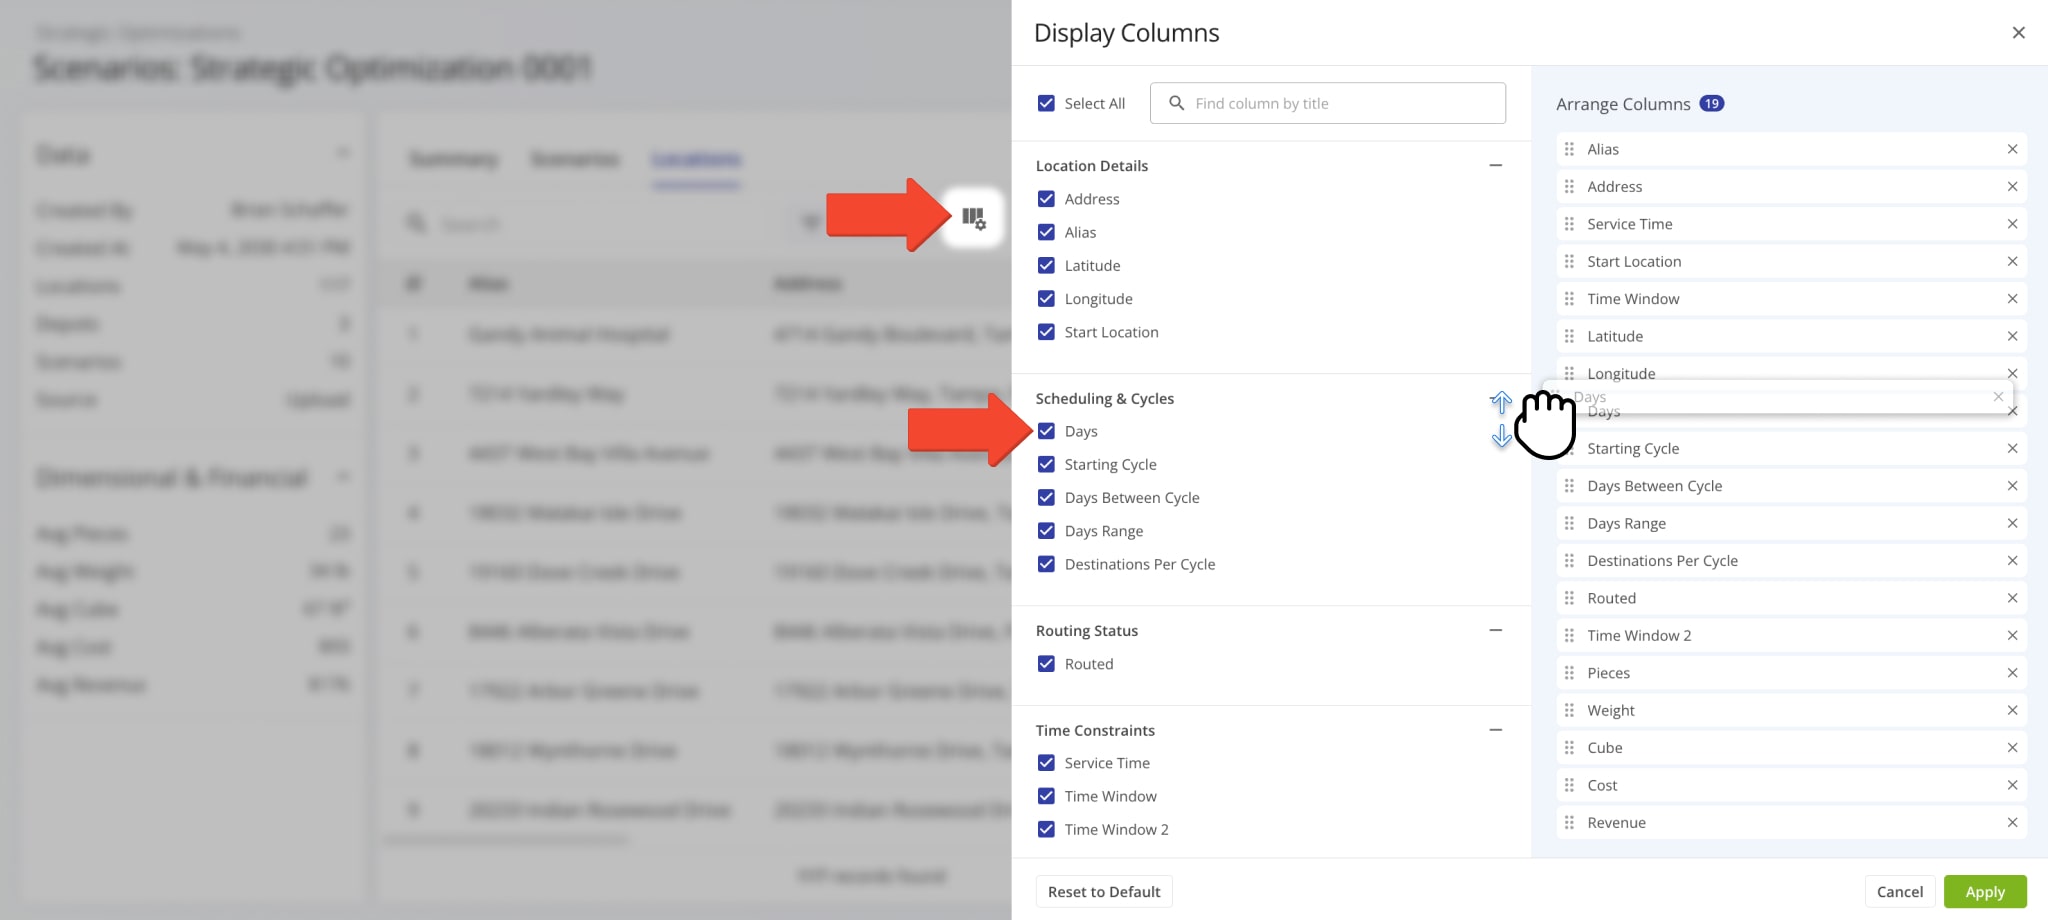
Strategic Optimization > Locations – Display Columns
You can easily customize the data shown for your Locations. To do so, click the Display Columns Button and check the boxes next to the columns you wish to enable. You can change their positions by dragging column names on the right. Click “Apply” to save your data column settings. See the table below for a full list of columns for your Strategic Optimization Locations.
| Column | Description | |
|---|---|---|
| Address | Street address of the Location. | |
| Alias | Alias or name of the Location, used to easily find it via the “Search” field. | |
| Latitude | Map coordinate value of the Location. | |
| Longitude | Map coordinate value of the Location. | |
| Start Location | Whether the Location is planned as a Route Start. | |
| Scheduling & Cycles | ||
| Days | Weekdays on which the Location is planned to be visited. | |
| Starting Cycle | On which scenario cycle the Location is first planned to be visited. | |
| Days Between Cycle | Number of days between planned visitation cycles. | |
| Days Range | Days before and after the Days Between Cycle value, used to account for delays and scheduling specifics. | |
| Destinations Per Cycle | Maximum number of times the Location can be included in routes as a Destination per recurring schedule cycle. | |
| Routing Status | ||
| Routed | Location is included in a planned scenario route. | |
| Time Constraints | ||
| Service Time | Planned Service Time duration the assigned User is intended to spend at the Location. | |
| Time Window | Available hours when the Location can be visited. | |
| Dimensional & Financial | ||
| Pieces | Planned number of units associated with the Location. | |
| Weight | Planned Weight value associated with the Location. | |
| Cube | Planned Cube value (cubic volume) associated with the Location. | |
| Cost | Planned Cost value associated with the Location. | |
| Revenue | Planned Revenue generated by completing a visit at the Location. | |
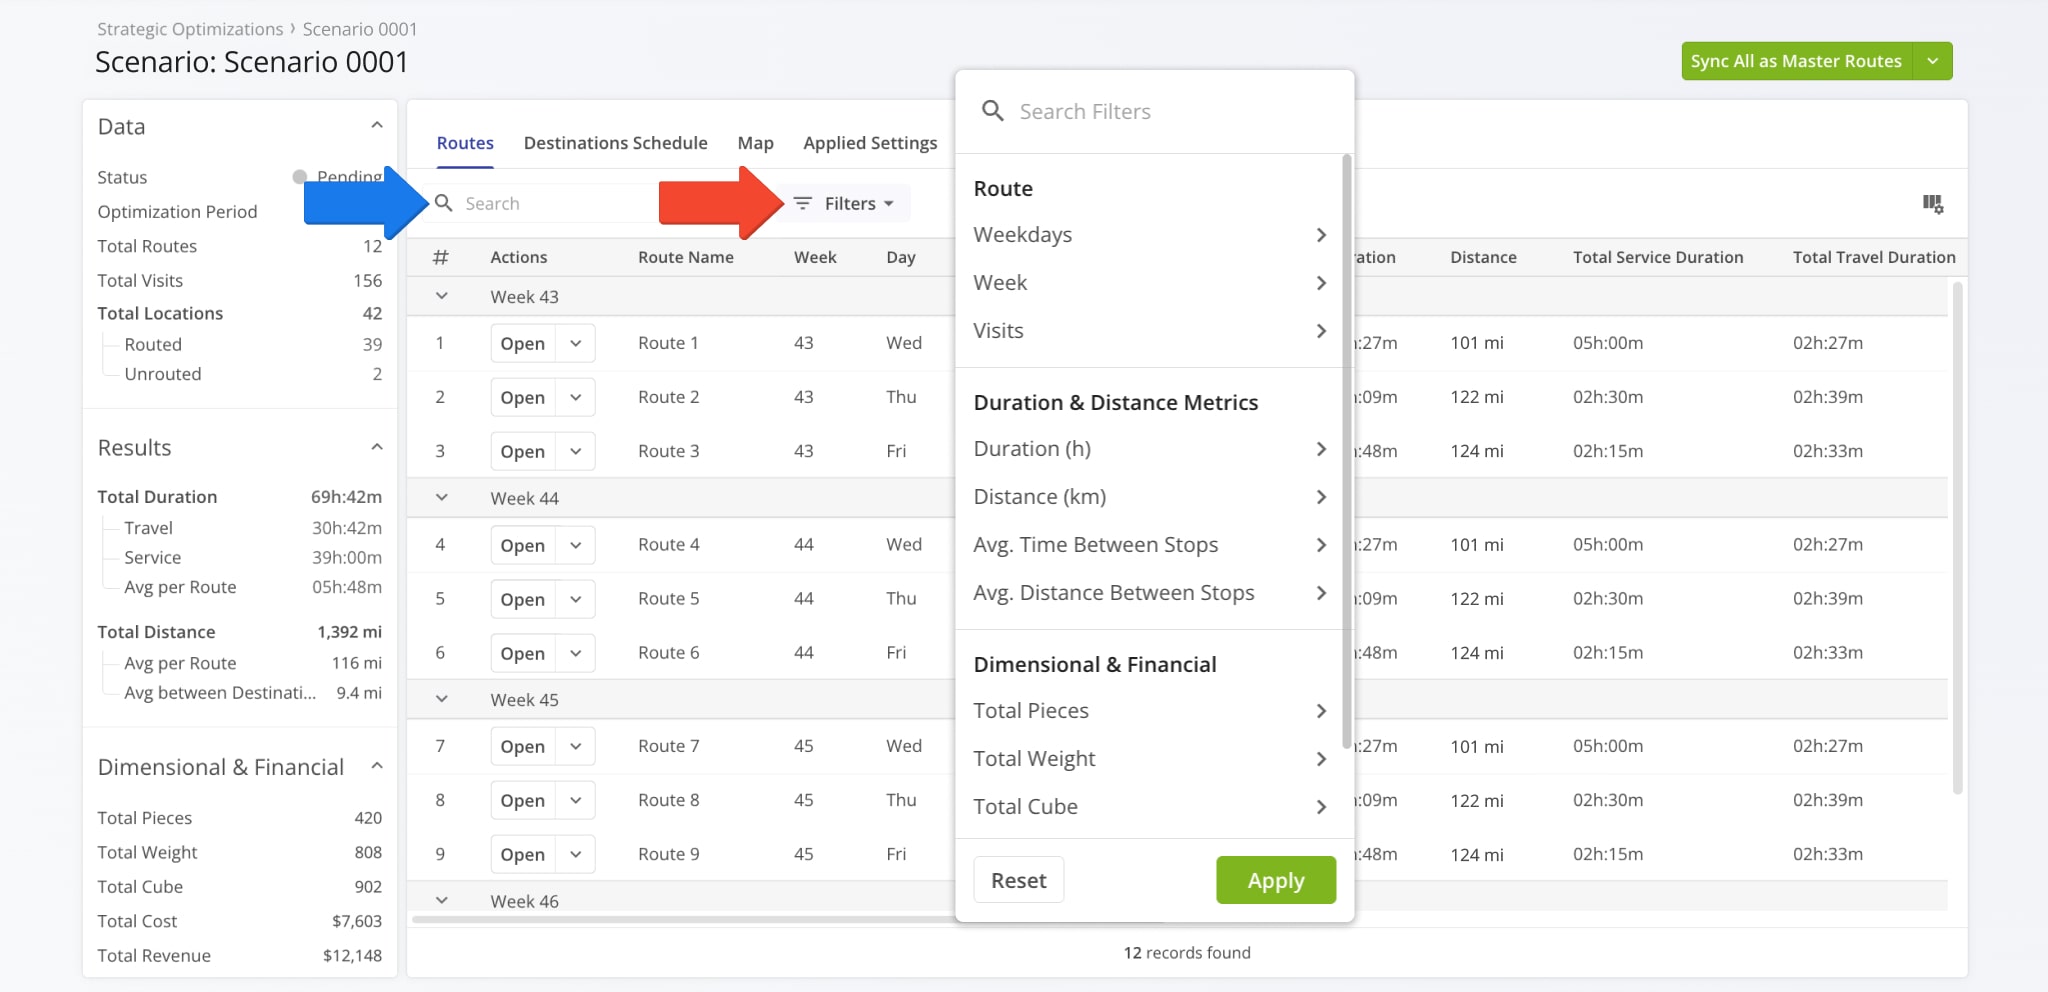
Strategic Scenario > Routes – Filters
In the “Routes” category of a Strategic Scenario, you can use Filters to see only the routes relevant to your needs. Click the “Filters” button to select route data attributes to filter Scenario routes by. See the table below for a full list of filters.
| Filter | Description | |
|---|---|---|
| Route | ||
| Weekdays | Select days of the week to filter routes by their recurring schedules. | |
| Week | Select calendar weeks to filter routes by their recurring schedules. | |
| Visits | Select the amount of planned Location visits to filter routes by. | |
| Duration & Distance Metrics | ||
| Duration (h) | Select a route duration range, including travel time and Service Time, to filter routes by. | |
| Distance (mi) | Select a travel distance range to filter routes by. | |
| Avg. Time Between Stops | Average travel time range between destinations. | |
| Avg. Distance Between Stops | Average travel distance between destinations. | |
| Dimensional & Financial | ||
| Total Pieces | Planned number of units associated with all Destinations on the route. | |
| Total Weight | Planned Weight value associated with all Destinations on the route. | |
| Total Cube | Planned Cube value (cubic volume) associated with all Destinations on the route. | |
| Total Cost | Planned Cost value associated with all Destinations on the route. | |
| Total Revenue | Planned Revenue of all Destinations on the route. | |
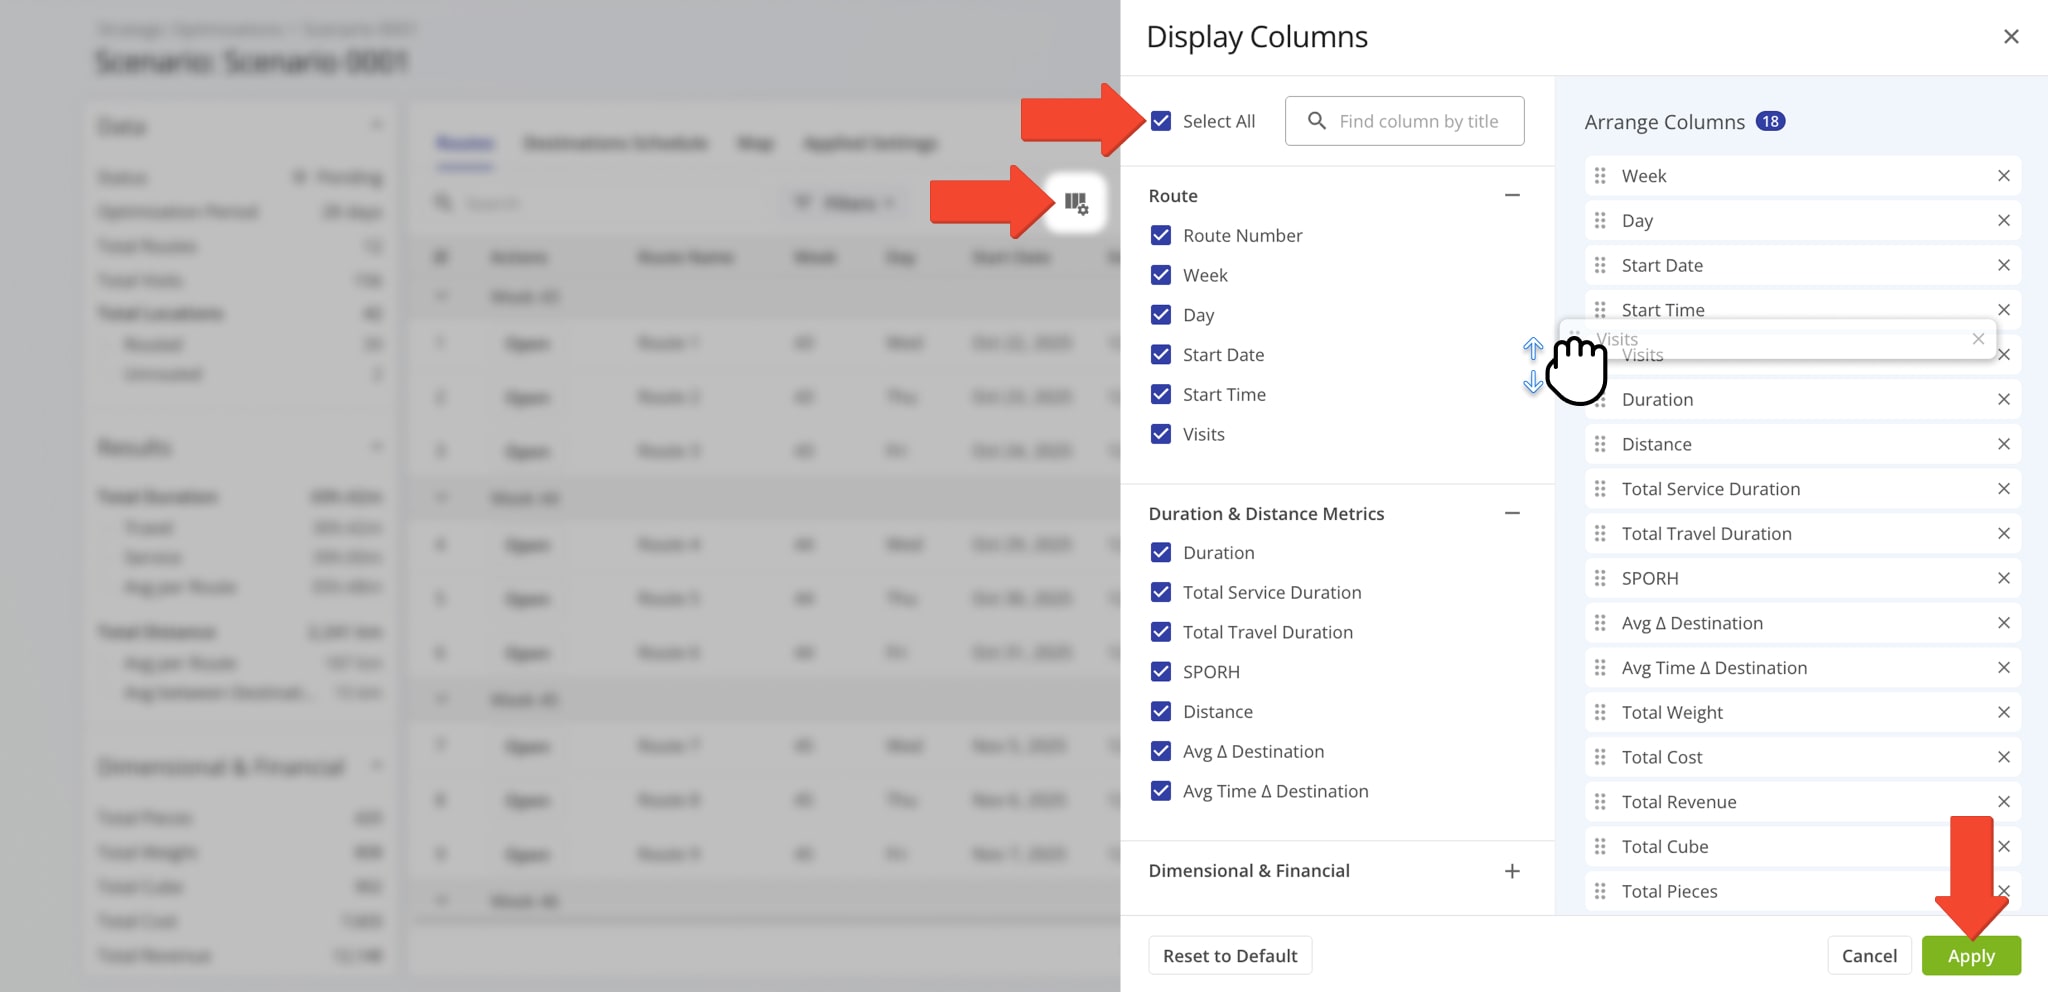
Strategic Scenario > Routes – Display Columns
You can also customize the displayed route data. Click the Display Columns Button and check the boxes next to the columns you wish to enable. You can change their positions by dragging column names on the right. Click “Apply” to save your changes.
| Column | Description | |
|---|---|---|
| Route | ||
| Route Number | Shows optimization sequence number of the route in the Scenario, i.e. the order in which routes were optimized according to optimization settings. | |
| Week | For how many weeks the route will be planned when scenario routes are synced. | |
| Day | For which days of the week the route will be scheduled when scenario routes are synced. | |
| Start Date | Date for which the route will be scheduled when scenario routes are synced. | |
| Start Time | Time for which the route will be scheduled when scenario routes are synced. | |
| Duration & Distance Metrics | ||
| Duration | Total duration of the route, including travel time and Service Time. | |
| Total Service Duration | Total Service Time of Destinations on the route. | |
| Total Travel Duration | Total travel time between Destinations on the route. | |
| SPORH | Stops Per On-Road Hour – number of Destination visited per one on-road hour on the route. | |
| Distance | Total distance of the route. | |
| Avg Δ Destinations | Average distance between destinations on the route. | |
| Avg Time Δ Destinations | Average travel time between destinations on the route. | |
| Dimensional & Financial | ||
| Total Pieces | Planned number of units associated with all Destinations on the route. | |
| Total Weight | Planned Weight value associated with all Destinations on the route. | |
| Total Cube | Planned Cube value (cubic volume) associated with all Destinations on the route. | |
| Total Cost | Planned Cost value associated all Destinations on the route. | |
| Total Revenue | Planned Revenue of all Destinations on the route. | |
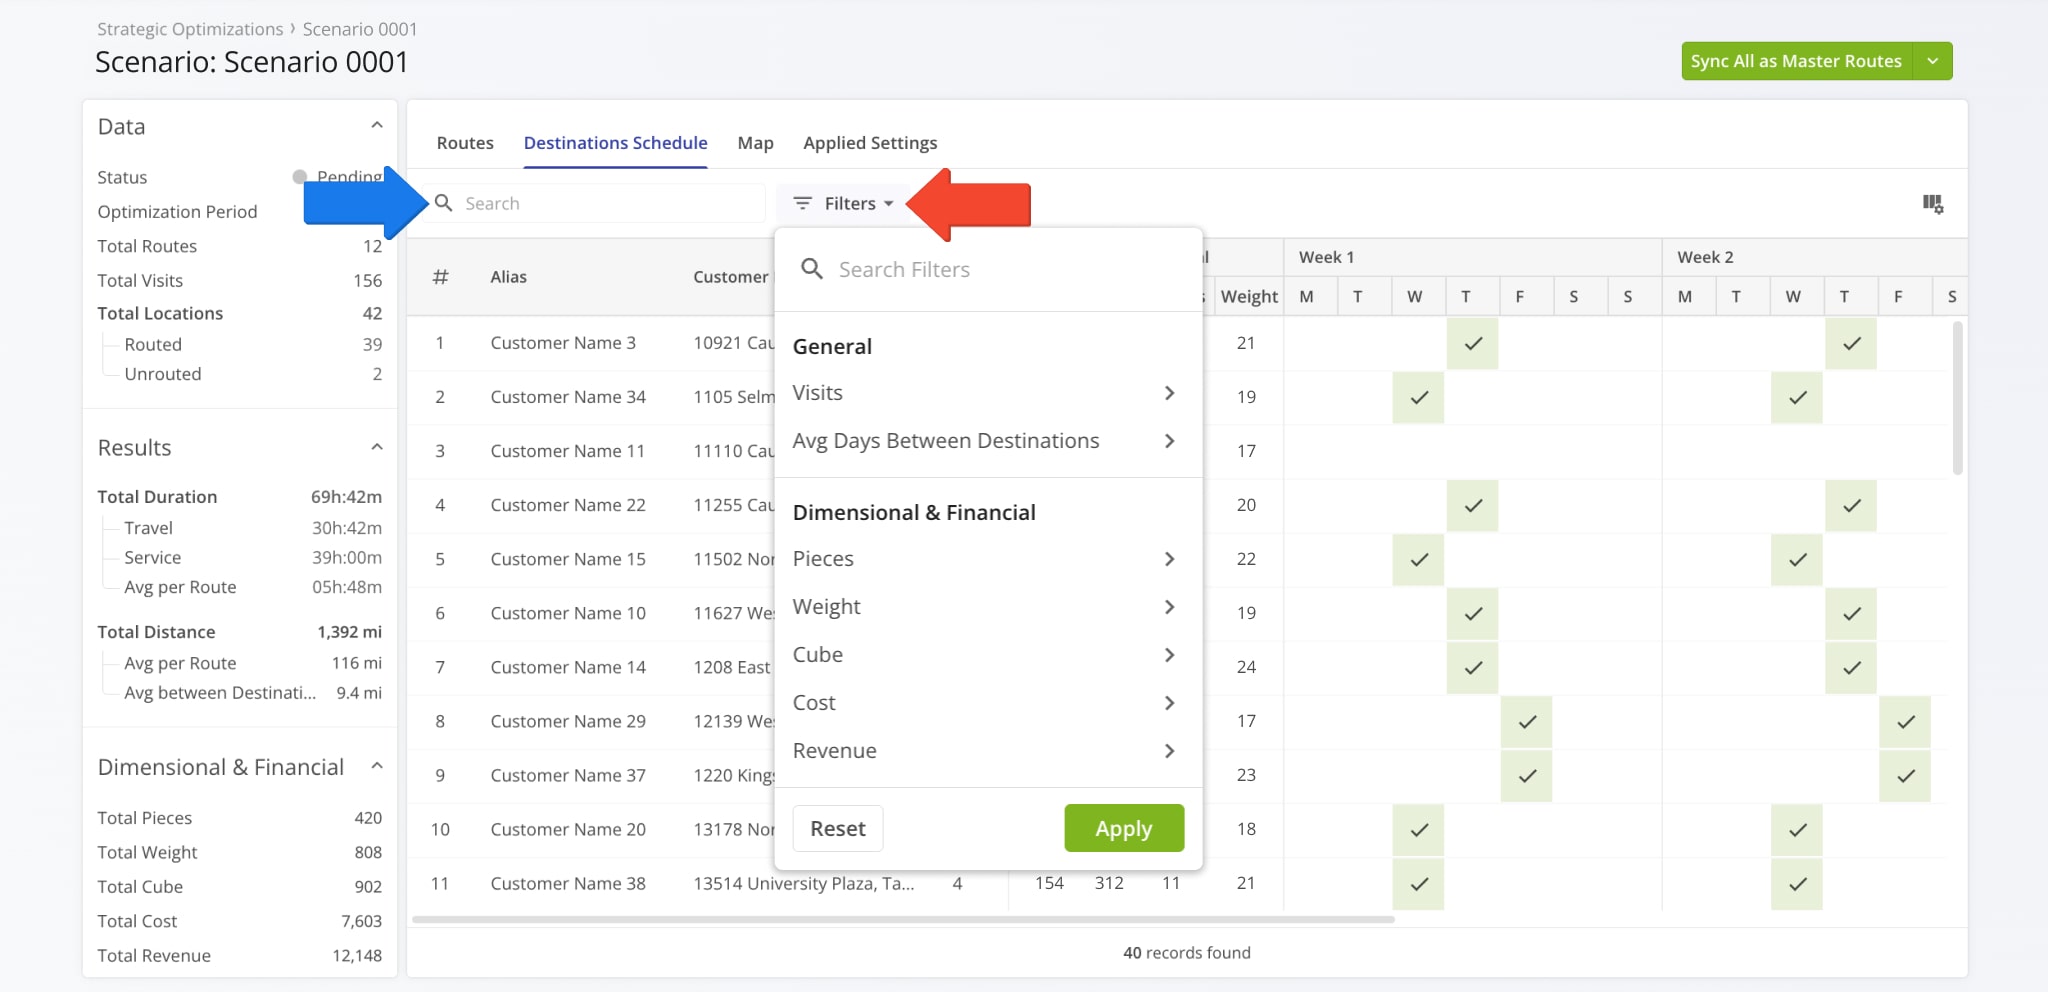
Strategic Scenario > Destinations – Filters
Just like other items in your Scenarios, you can filter the data shown in the Destinations Schedule section. Use the “Search” field to find specific Locations by names or attributes or click “Filters” to select specific data values to filter Locations by.
The available filter options correspond to the Destinations Schedule Data values described below.
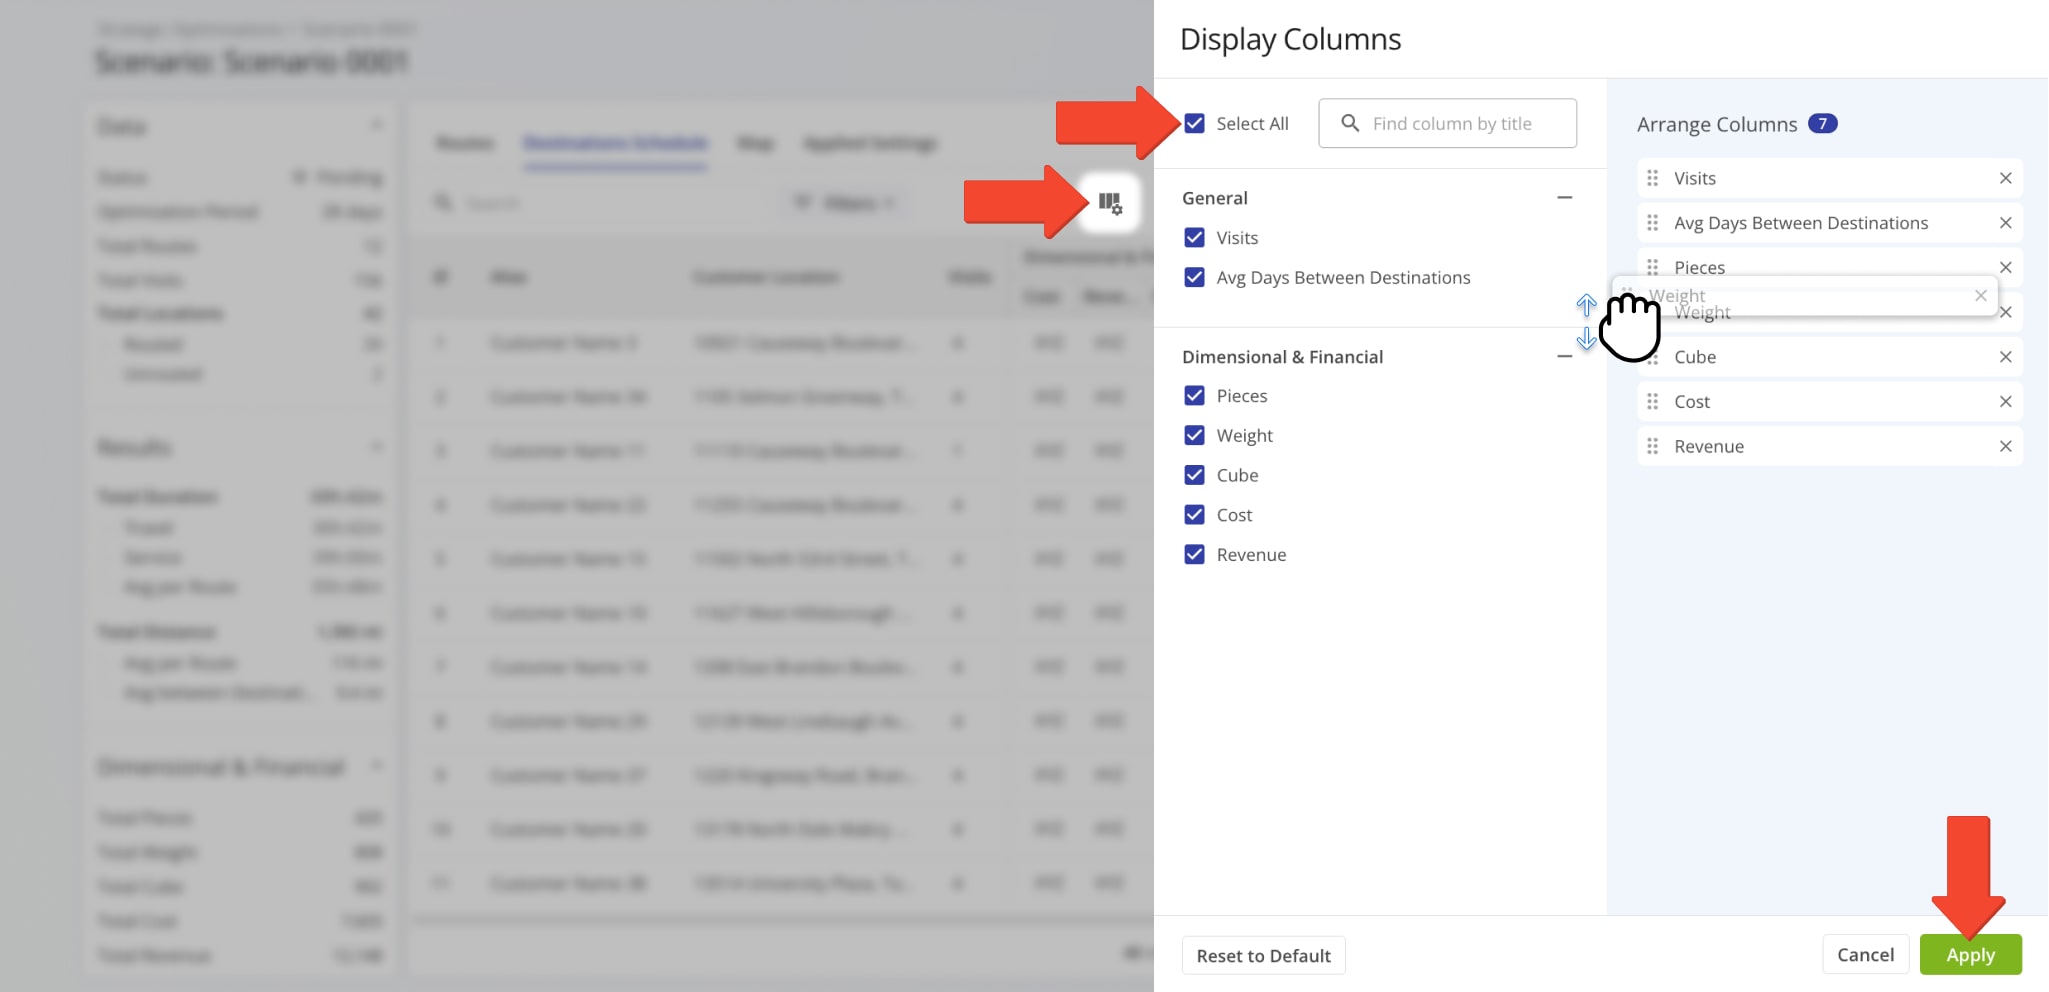
Strategic Scenario > Destinations – Display Columns
To customize the data shown for your Destination Schedules, click the Display Columns Button and check the boxes next to the columns you wish to enable. Change their positions by dragging column names on the right. Click “Apply” to save your changes.
See the table below for more information on the available Location attributes and data items.
| Column | Description | |
|---|---|---|
| General | ||
| Visits | Planned number of visits for the Location in the Scenario. | |
| Avg Days Between Destinations | Average number of days between scheduled Location visits. | |
| Dimensional & Financial | ||
| Total Pieces | Planned number of units associated with all Destinations on the route. | |
| Total Weight | Planned Weight value associated with all Destinations on the route. | |
| Total Cube | Planned Cube value (cubic volume) associated with all Destinations on the route. | |
| Total Cost | Planned Cost value associated all Destinations on the route. | |
| Total Revenue | Planned Revenue of all Destinations on the route. | |
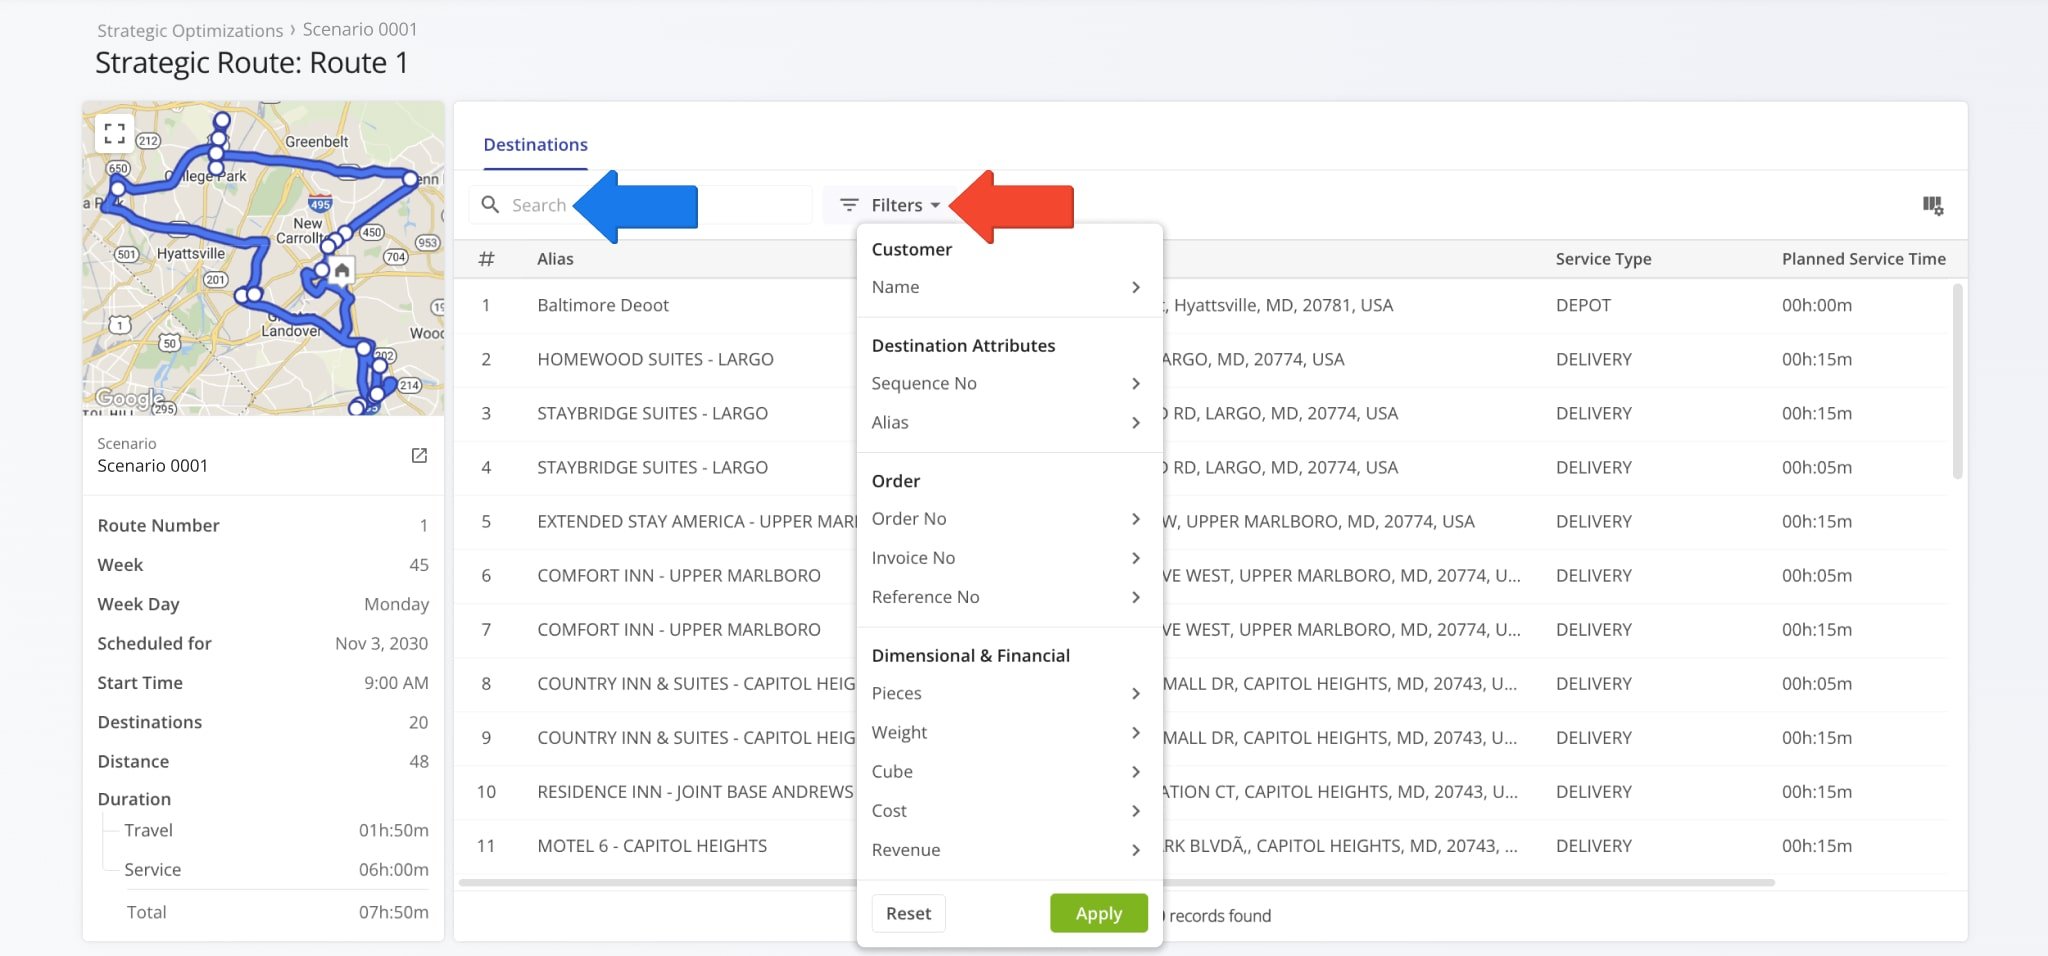
Strategic Route Snapshot – Filters
Like other Route4Me interfaces, you can search and filter Snapshots to show the most relevant data. Click “Filters” and enable your preferred options or use the “Search” field to find specific Destinations by name or associated data.
| Filter | Description | |
|---|---|---|
| Customer | ||
| Name | Name of the Customer or contact person associated with the route Destination. | |
| Destination Attributes | ||
| Sequence No | Visitation sequence number of the Destination on the route. Represents the route stop order. | |
| Alias | Name of the route Destination. Can be used to easily find it via search functions and represents the Destination on various Route4Me interfaces, including the mobile app for drivers. | |
| Order | ||
| Order No | Number of the Customer Order associated with the Destination. | |
| Invoice No | Invoice number of the Customer Order associated with the Destination. | |
| Reference No | Reference number of the Customer Order associated with the Destination. | |
| Dimensional & Financial | ||
| Pieces | Planned number of units associated with the Destination. | |
| Weight | Planned Weight value associated with the Destination. | |
| Cube | Planned Cube value (cubic volume) associated with the Destination. | |
| Cost | Planned Cost value associated with the Destination. | |
| Revenue | Planned Revenue of the Destination. | |
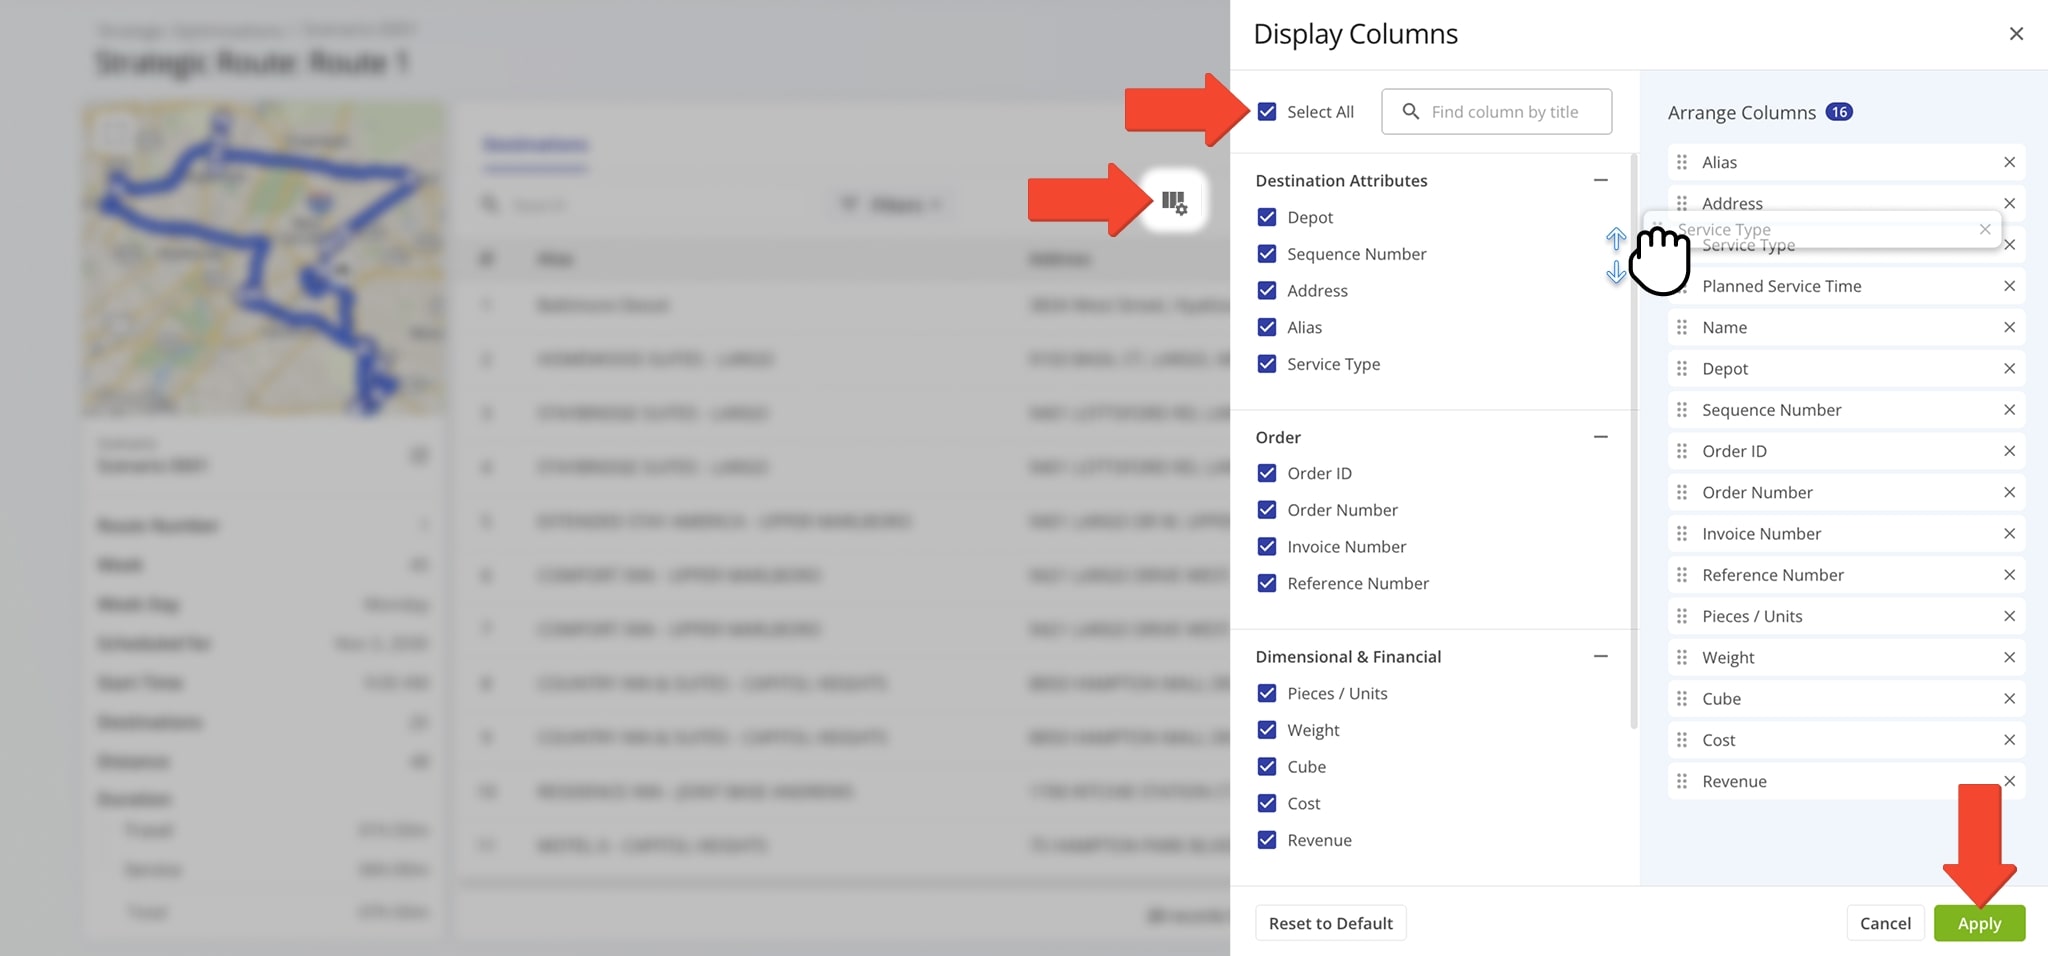
Strategic Route Snapshot – Display Columns
You can also customize the data columns of Strategic Snapshots. These represent Destination details. Click the Display Columns Icon and check the boxes next to the columns you want to enable. After that, you can change the positions of the columns by dragging column names on the right. When you’re done adjusting columns, simply click the “Apply” button to save your changes.
| Column | Description | |
|---|---|---|
| Destination Attributes | ||
| Depot | Whether the Destination is a route start depot or a Customer Destination. | |
| Sequence No | Visitation sequence number of the Destination on the route. Represents the route stop order. | |
| Address | Street address of the Destination. | |
| Alias | Name of the route Destination. Can be used to easily find it via search functions and represents the Destination on various Route4Me interfaces, including the mobile app for drivers. | |
| Service Type | Action required to complete the Destination, i.e. Delivery, Service, etc. | |
| Order | ||
| Order ID | Internal system ID of the Customer Order associated with the Destination. | |
| Order Number | Number of the Customer Order associated with the Destination. | |
| Invoice Number | Invoice number of the Customer Order associated with the Destination. | |
| Reference Number | Reference number of the Customer Order associated with the Destination. | |
| Dimensional & Financial | ||
| Pieces | Planned number of units associated with the Destination. | |
| Weight | Planned Weight value associated with the Destination. | |
| Cube | Planned Cube value (cubic volume) associated with the Destination. | |
| Cost | Planned Cost value associated with the Destination. | |
| Revenue | Planned Revenue of the Destination. | |
| Customer | ||
| Name | Name of the Customer or contact person associated with the route Destination. | |
| Schedule & Time Adherence (Service) | ||
| Planned Service Time | Duration of Destination Service Time for each stop on the route. | |
Visit Route4Me's Marketplace to Check out Associated Modules:
- Operations
Audit Logging and Activity Stream
- Operations
Custom Data Add-On
- Operations
Advanced Team Management Add-On