Strategic Optimizations – Automated Multi-Frequency Strategic Cycle Planning With Recurring Routing
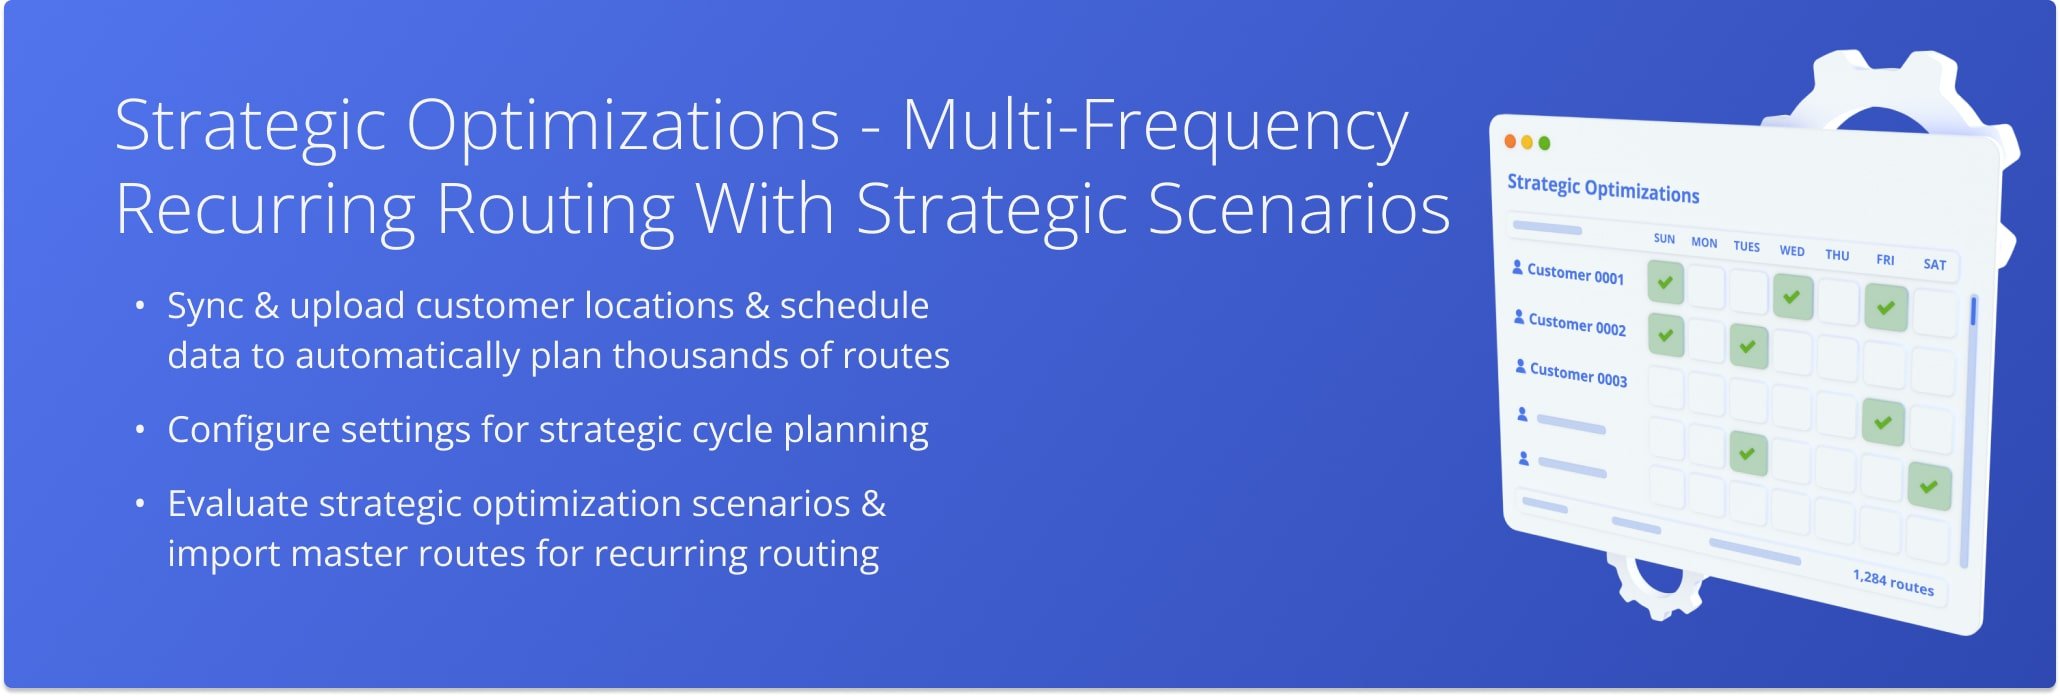
Route4Me’s Strategic Optimizations simplify and automate complex strategic cycle planning tasks for multi-frequency delivery and service schedules over extended planning periods. Sync data via SFTP, upload Customer addresses with schedules, evaluate multiple optimization scenarios, and create recurring route plans for thousands of routes with weekly, bi-weekly, or other visit requirements with one click.
All you have to do is upload your data, and Route4Me’s enterprise route optimization API will handle the rest according to your recurring schedules. In this guide, you’ll learn about Strategic Optimizations and how to use them for selecting the most optimal high-volume recurring route scenarios.
NOTE: “Cycle” in Recurring Routing with Strategic Optimizations refers to an instance when a specific Recurring Schedule repeats.
Table of Contents
Route4Me Strategic Route Optimizations For Multi-Frequency Recurring Routes
Planning hundreds and even thousands of routes, all with different Recurring Schedules and visitation frequencies, is easy with Strategic Route Optimizations. Simply upload your Customer Locations or sync data via SFTP upload, and Strategic Optimizations will automatically generate the most efficient Scenarios and Route Plans.
Then, follow the steps below to evaluate and select the best Scenarios for your business needs:
- Go to Customers > Strategic Optimizations to open your Strategic Optimizations page.
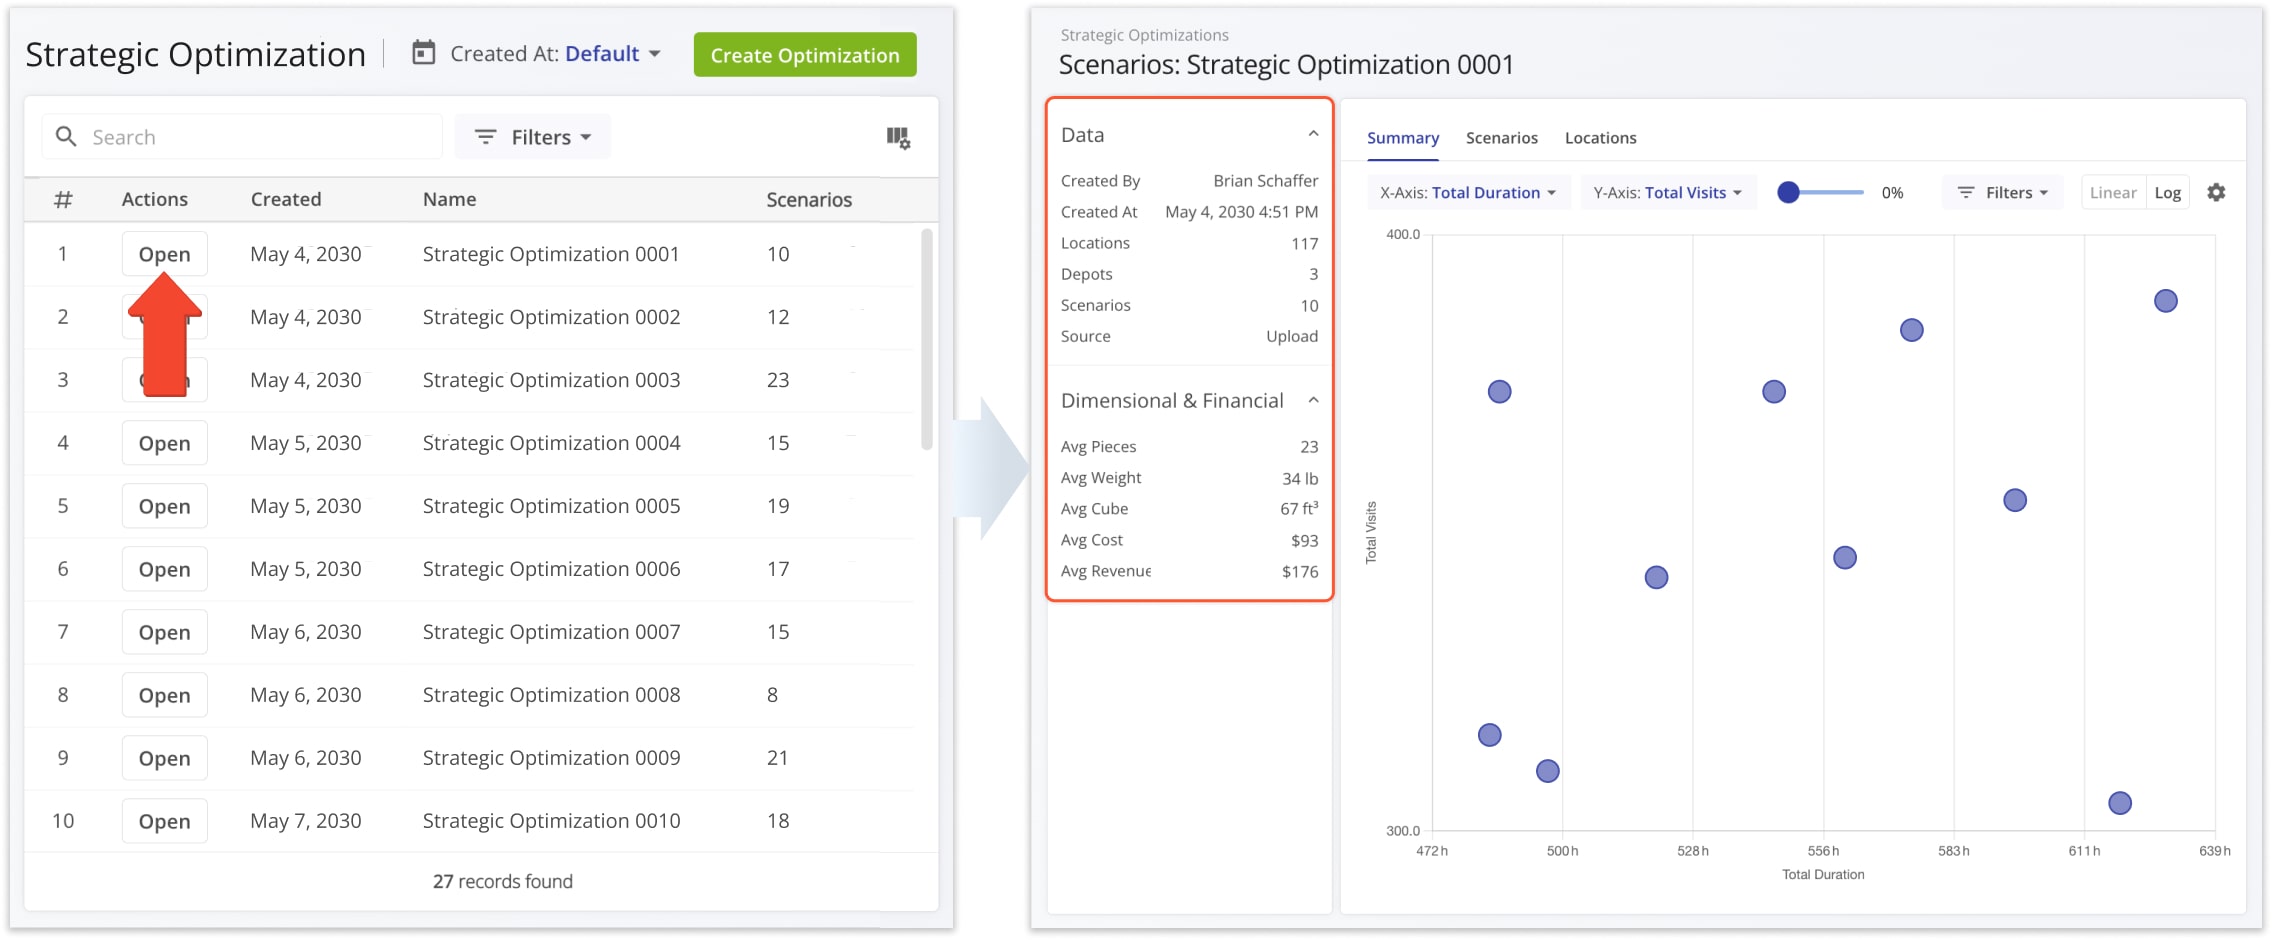
- Open a strategic plan to see its associated scenarios.
- Pick and open a scenario that meets your requirements.
- Click to accept the Scenario Routes either as regular routes or master routes for Recurring Routing.
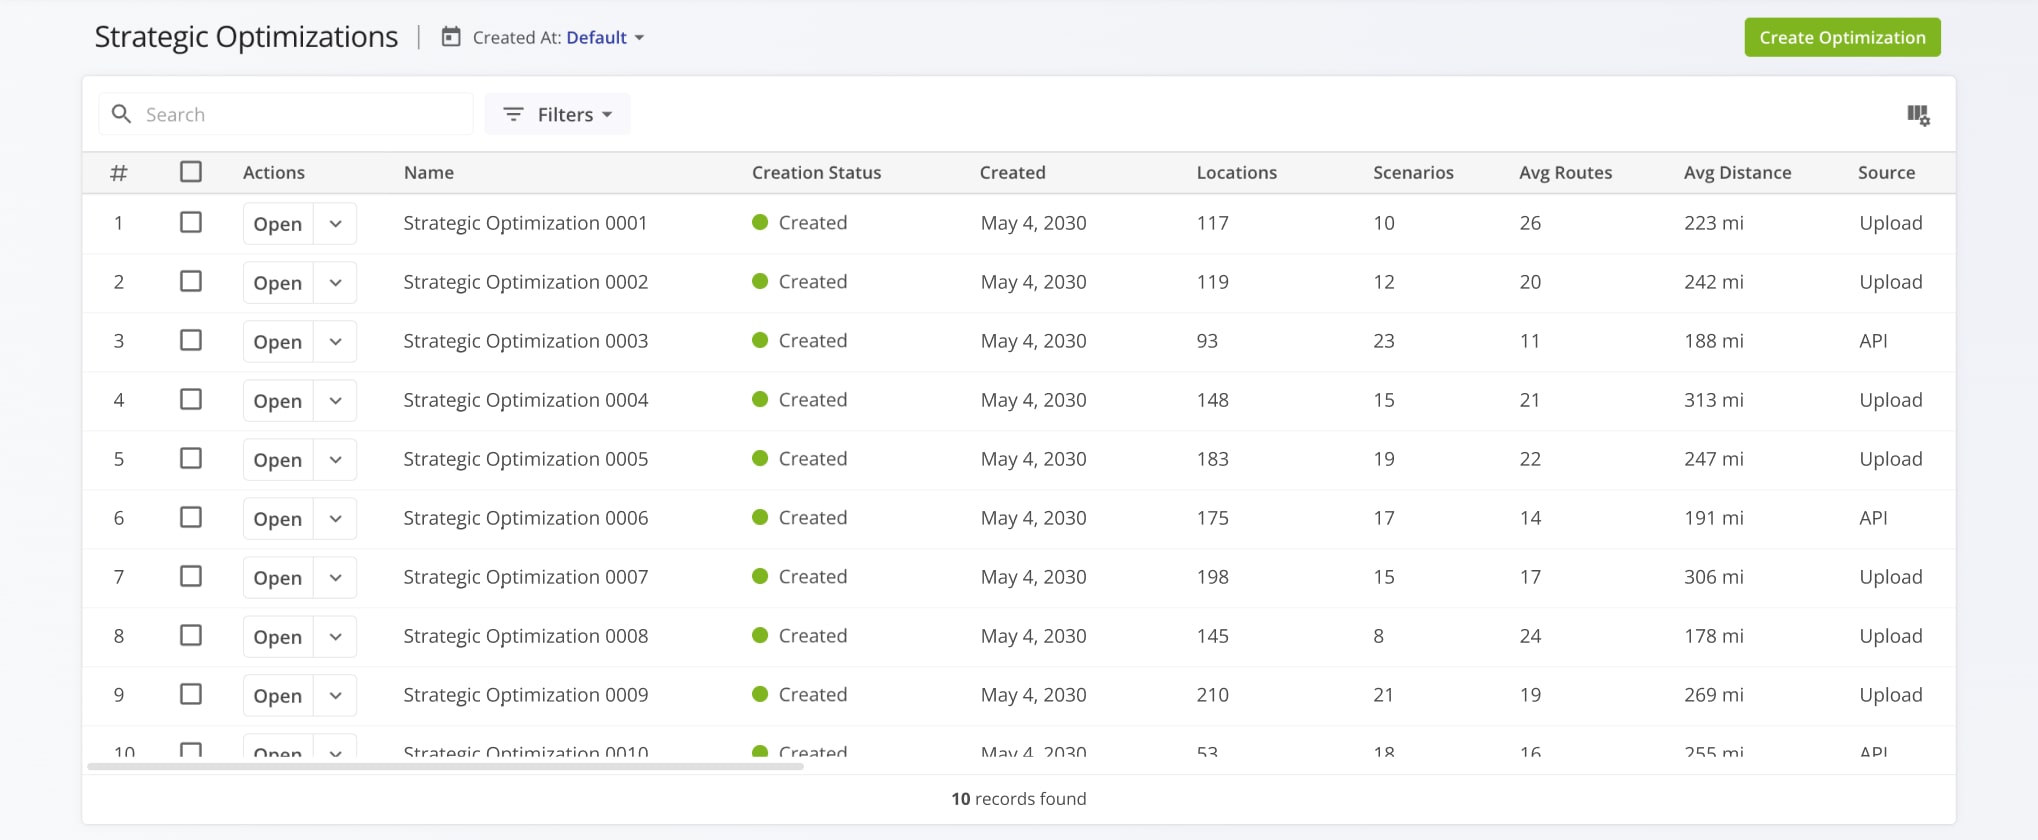
Your account’s Strategic Optimizations page is where you can view, filter, and open Strategic Optimizations and their associated Scenarios. Keep reading to learn more about each of the above steps.
Open Your Strategic Optimizations
Upload Locations – Plan Multi-Frequency Recurring Routes From Spreadsheet
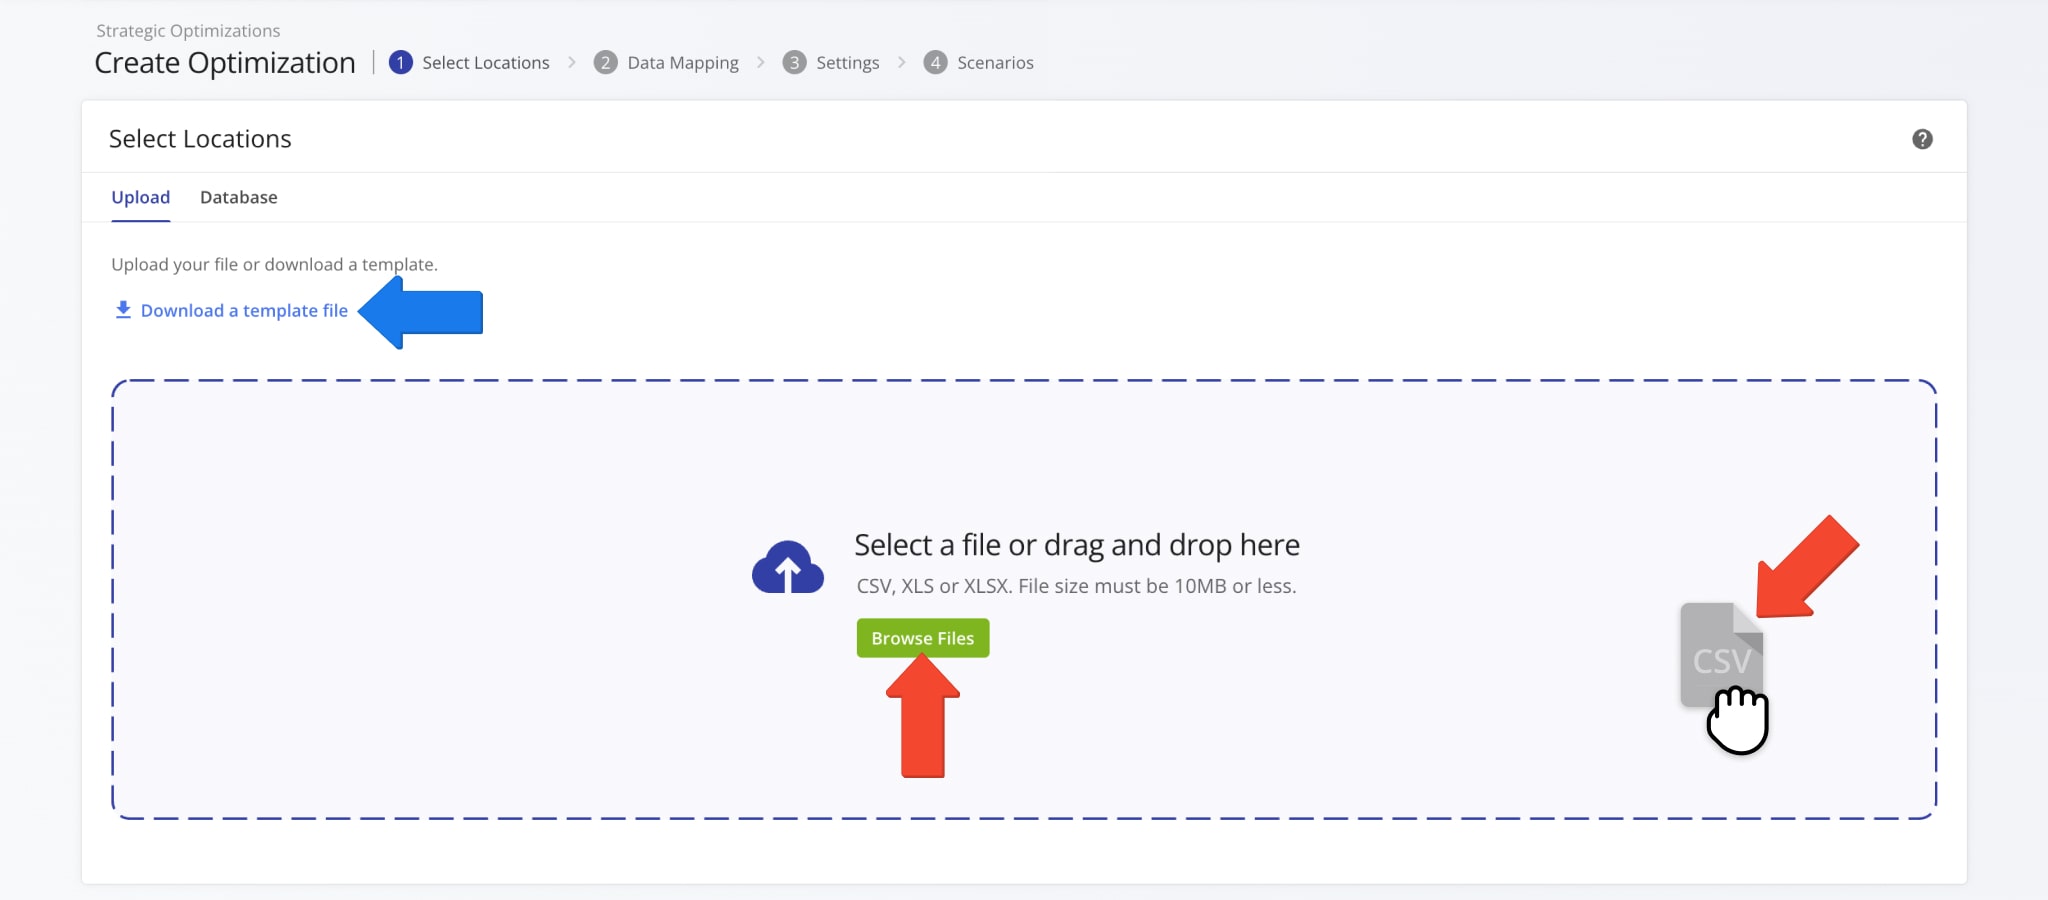
To upload a spreadsheet file with customer locations and schedule data, click “Create Optimization“. Then, either browse and select a file from your device or simply drag and drop a spreadsheet file into the “Create Optimization” panel.
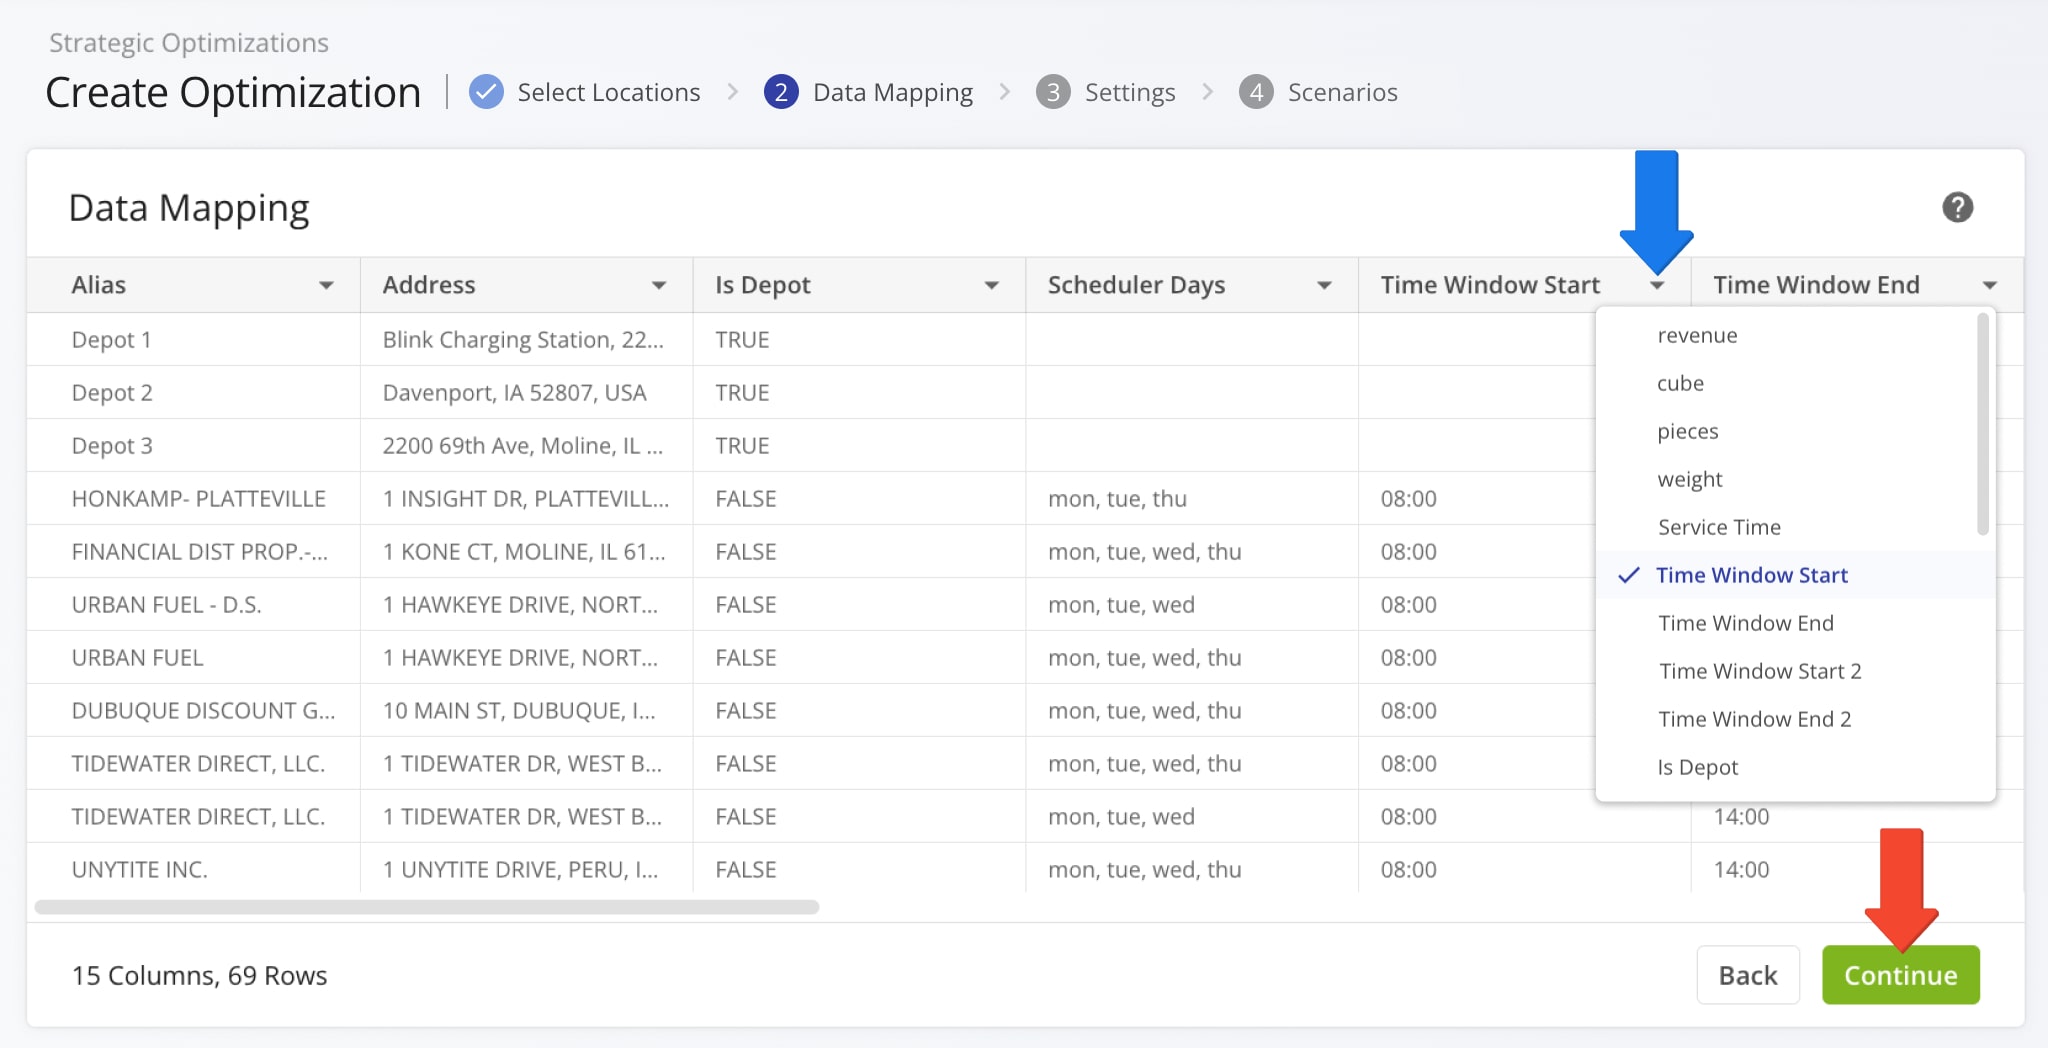
Route4Me’s Strategic Optimizations will automatically validate your data and map it to internal variables for optimization. If a column wasn’t validated, click the Down Arrow and select the correct data type from the menu. Once you’ve confirmed your uploaded data, click “Continue“.
Additionally, you can select “Ignore” from the menu to omit certain data columns from processing and optimization. Similarly, if a data column is necessary but not already listed, select the “Custom” option to associate that collumn’s data to route destinations as Route4Me Custom Data.
NOTE: Especially large datasets with thousands of locations and complex schedules may take slightly longer to optimize.
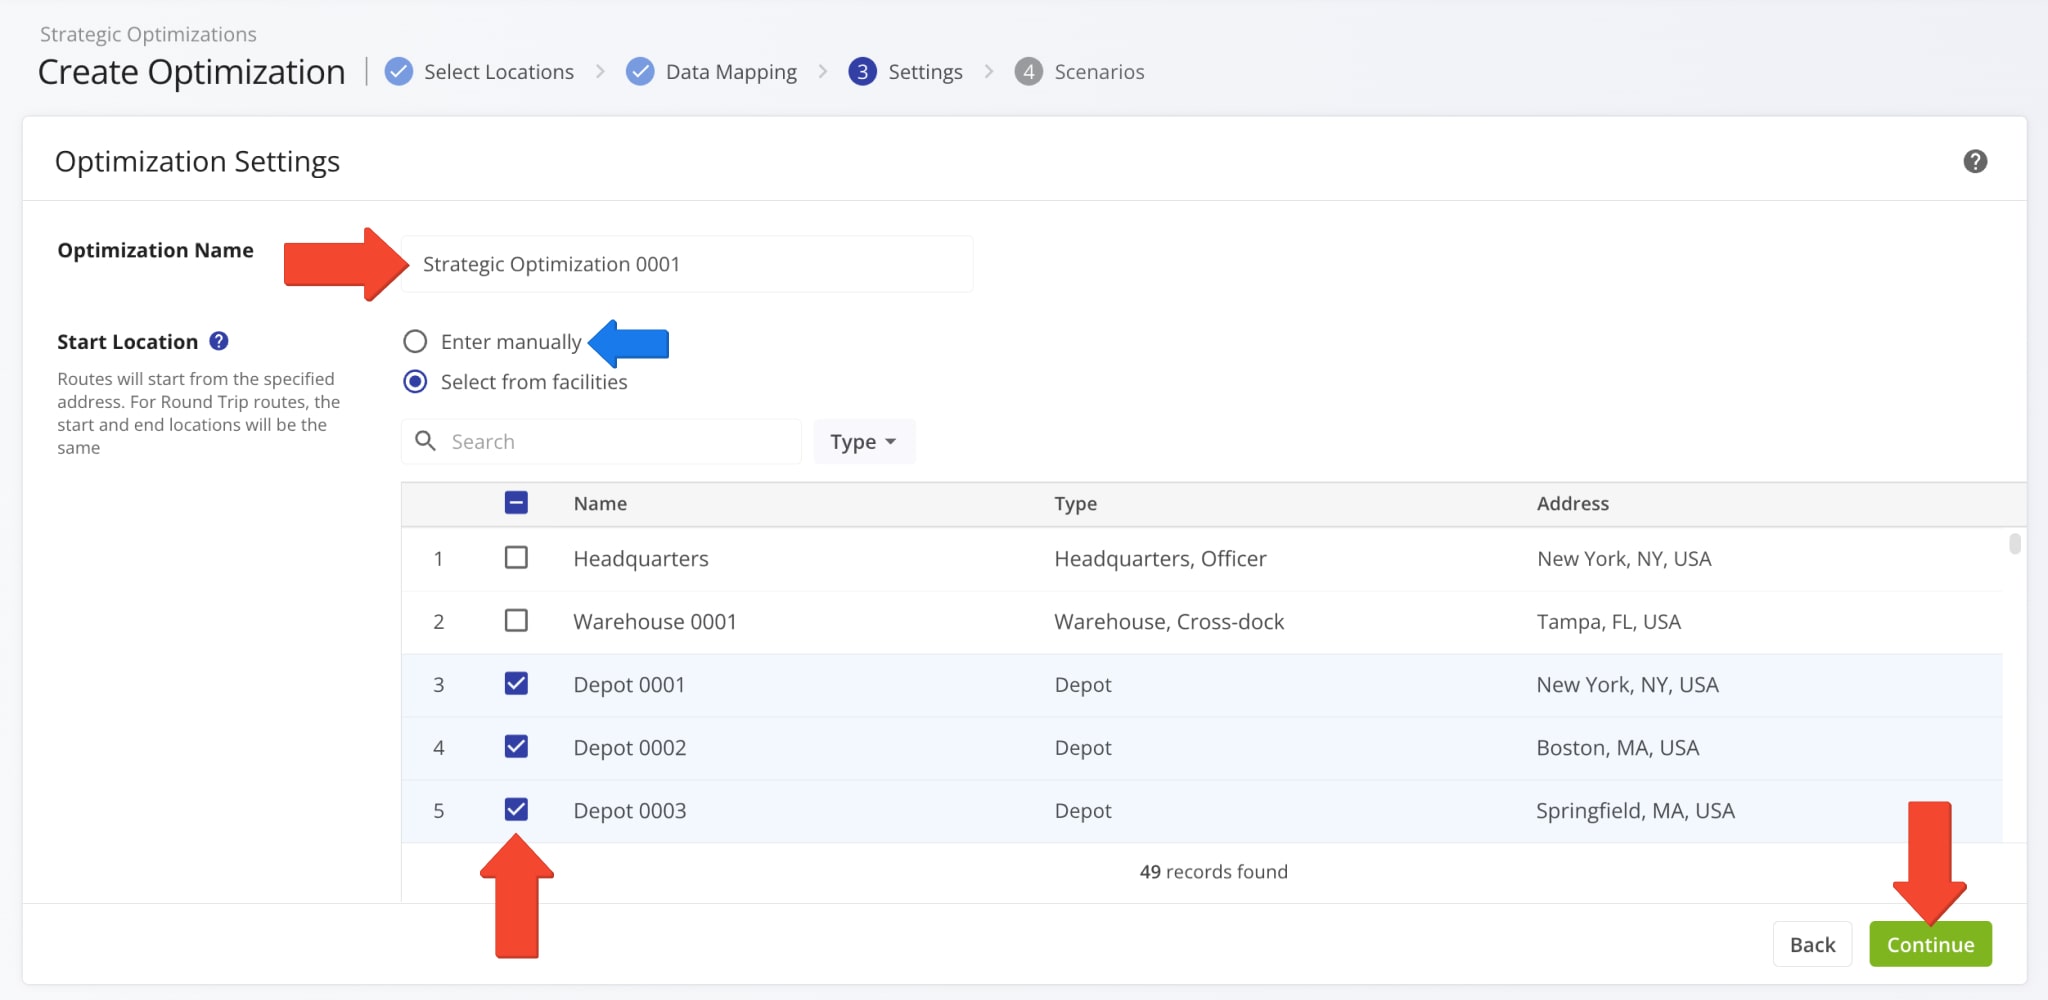
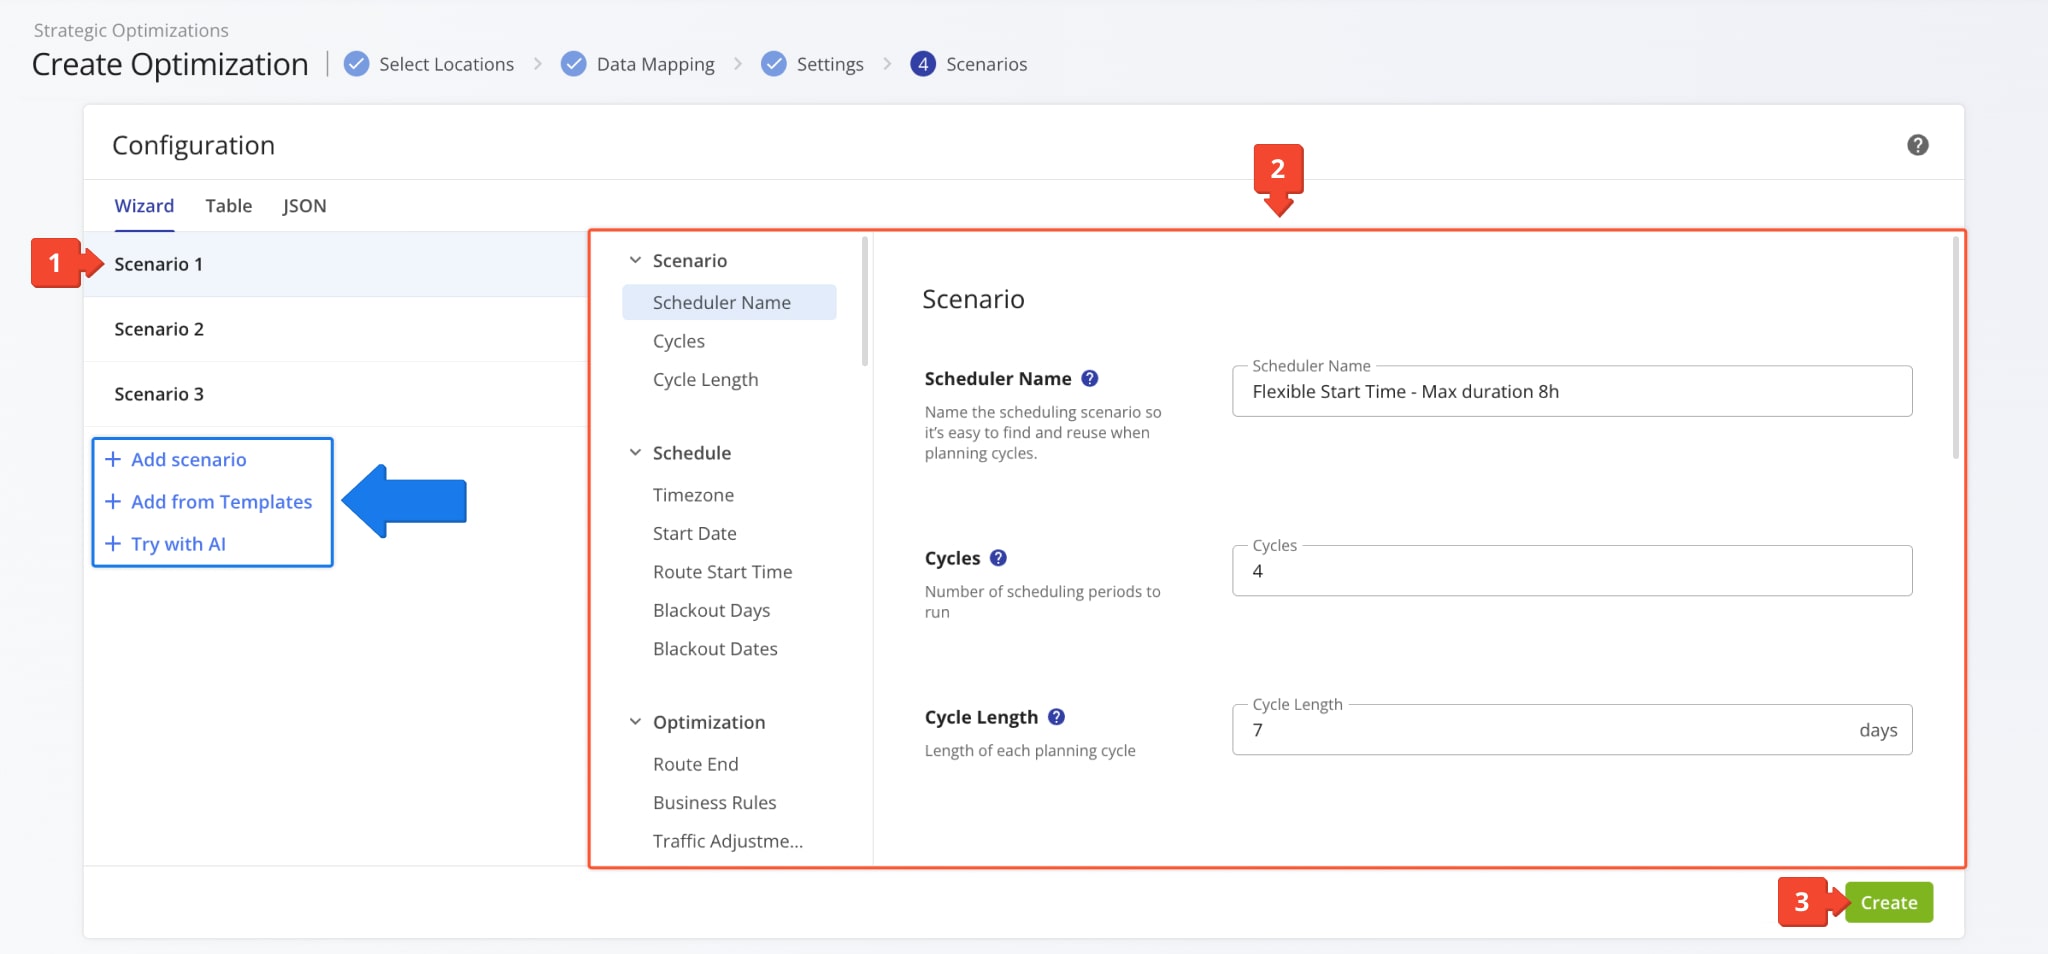
Once you’ve imported your data, you can configure optimization parameters for strategic cycle planning using the JSON format. Additionally, you can use the blue bar above the configurator to format your JSON text.
You can find a list of configuration parameters for recurring strategic cycle optimization in the table below and a JSON code snippet showing minimal necessary configuration settings under the table.
Configuration | Description | Example Value |
---|---|---|
route_max_duration | Maximum route duration in seconds. | ”28800” (8 hours) |
route_date | Route start date expressed as a UTC unix timestamp in seconds. | ”1893452400” (01.01.2030) |
rt | Round Trip configuration. Defines whether the route ends at the final destination or returns to the depot. | ”1” or “0“ |
route_time | Scheduled route start time relative to “route_date” in seconds. | ”43200” (12PM) |
slowdowns | JSON object which includes Traffic Slowdown configurations (Service Time Slowdown, Travel Time Slowdown). | N/A |
service_time | Service Time Slowdown expressed as a percentage value in the “slowdowns” JSON object. | ”25” (25%) |
travel_time | Travel Time Slowdown expressed as a percentage value in the “slowdowns” JSON object. | ”25” (25%) |
is_flexible_start_time | Defines whether planned routes will use Flexible Start Time scheduling. | ”true” or “false“ |
flexible_start_time | JSON object which includes the earliest and latest start time values for dynamic route start time scheduling with time windows. | N/A |
earliest_start | Earliest permitted route start time relative to “route_date” in seconds. | ”43200” (12PM) |
latest_start | Latest permitted route start time relative to “route_date” in seconds. | ”46800” (1PM) |
timezone | Time zone for route scheduling set in your Account Settings. | ”America/New York“ |
scheduler | JSON object which contains route schedule data. | N/A |
start_date | Calendar date on which the first strategic cycle is scheduled to begin. | ”2030-07-04“ |
cycles | Number of planned strategic cycles to optimize routes for. | ”4“ |
blackout_days | Days of the week to omit when creating recurring route cycles. | [“sat”, “sun”] |
blackout_dates | Calendar dates, such as Holidays, to omit from recurring route cycles. | [“12-25”, “01-01”] |
scheduler_name | Custom name of the configuration with your current settings. | ”Strategic Scheduler“ |
[ { "route_max_duration": 28800, "rt": 1, "route_time": 43200, "parts": 99, "slowdowns": { "service_time": 10, "travel_time": 10 }, "is_flexible_start_time": false, "timezone": "America/New_York", "scheduler": { "start_date": "2030-01-01", "cycles": 4, "blackout_days": [], "blackout_dates": [] }, "scheduler_name": "Strategic Cycle Planning Configuration", } ]
Locations Spreadsheet – Data Columns And Formatting For Strategic Optimizations
Formatting a locations spreadsheet for strategic planning is similar to regualr Route4Me Spreadsheet Formatting. The table below outlines supported data columns and shows which are mandatory for strategic optimization with recurring routing. You can also click the green button to download an example locations spreadsheet with mandatory and optional columns.
Download Example Locations Spreadsheet
NOTE: If a location has no specific schedule and should be visited once per cycle, all schedulding fields must be left blank.
Column (Key) | Description | Mandatory | Expected Value |
---|---|---|---|
Alias (alias) | Name of the location, used to easily identify locations and find them via search fields. | Text | |
Address (address) | Street address of the location. Can be used alone or alongside coordinates. | Text | |
Depot (is_depot) | If the location is a route origin point (depot) or a destination location. | TRUE/FALSE | |
Days (scheduler_days) | Days of the week of a planning cycle on which a location should be included in routes. | mon, tue, wed, thu, fri, sat, sun | |
Time Window Start (time_window_start) | Time of day from which the location is available for visit. | Time (hh:mm) | |
Time Window End (time_window_end) | Time of day till which the location is available for visit. | Time (hh:mm) | |
Starting Cycle (scheduler_starting_cycle) | On which cycle of the recurring schedule should the location first be included in routes. | Number | |
Days Between Cycle (scheduler_days_between_cycle) | Number of days between planned visitation cycles. | Number | |
Days Range (scheduler_days_range) | Adds days before and after the Days Between Cycle value to account for delays and scheduling specifics. | Number | |
Visits Per Cycle (scheduler_visits_per_cycle) | Maximum number of times the location can be included in routes per recurring schedule cycle. | Number | |
Service Time (service_time) | Duration of planned location visit in seconds. | Time (ss) | |
Latitude (lat) | Coordinate indicator of the location. | Coordinate | |
Longitute (lat) | Coordinate indicator of the location. | Coordinate | |
Customer UUID (CustomerUUID) | Unique internal ID used to identify a unique Customer in the system | UUID String | |
Frequency (frequency) | How often the location can be planned for visitation when scenario routes are accepted. | Number |
Filter And Customize Strategic Optimizations Data Table
To find a specific Strategic Plan on your account, you can use custom filters or search for a Plan by name with the “Search” field.
Click the “Created Date” button to open the calendar and filter Strategic Plans by their creation date or time frame. Then, you can further refine the shown Optimizations by clicking the “Filters” button. Currently, you can filter Plans by the number of associated Scenarios and Customer Locations.
Furthermore, you can customize the columns on your Strategic Optimizations page to see only the data relevant to your needs. To do so, click the Display Columns Button and check the boxes next to the columns you wish to enable. After that, you can change their positions by dragging column names. Accordingly, columns listed from top to bottom are displayed from left to right on your Strategic Optimizations. Click the “Apply” button to save your data column settings.
Column | Description | |
---|---|---|
General | ||
Name | Unique name or alias of the optimization. You can use names to find it via the “Search” field. | |
Created | Date when the strategic optimization was created via SFTP data sync. | |
Locations | Total number of locations included in the optimization scenarios and routes. | |
Scenarios | Total number of scenarios included in the strategic optimization. | |
Source | How the strategic optimization was created. Currently supports SFTP. | |
User | User who uploaded the strategic optimization. | |
Route Metrics | ||
Avg Routes | Average number of routes per week. | |
Avg Distance | Average distance of routes included in the strategic optimization. | |
Avg Duration | Average duration of routes included in the strategic optimization. | |
Destination Metrics | ||
Avg Destinations | Average number of destinations on routes included in the strategic optimization. | |
Avg Time Delta Destinations | Average time between destinations on routes included in the strategic optimization. | |
Avg Delta Destinations | Average distance between destinations on routes included in the strategic optimization. | |
Travel & Service Metrics | ||
Avg Duration | Average duration of routes included in the strategic optimization. Combination of Travel Duration and Service Duration. | |
Avg Travel Duration | Average Travel Time Duration of routes included in the strategic optimization. | |
Avg Service Duration | Average Service Time Duration of routes included in the strategic optimization. | |
Avg Distance | Average distance of routes included in the strategic optimization. |
Open Scenarios And Customer Locations From The Strategic Optimizations
Strategic Optimizations provide an overview of your Recurring Routing Scenarios bundled into Optimizations. To view more detailed data about a specific optimization and its associated scenarios, click the “Open” button.
On the “Scenarios” page, you can see the scenarios included in the Strategic Optimization you opened and their associated data such as the number of routes, visits, average and total route durations, and more.
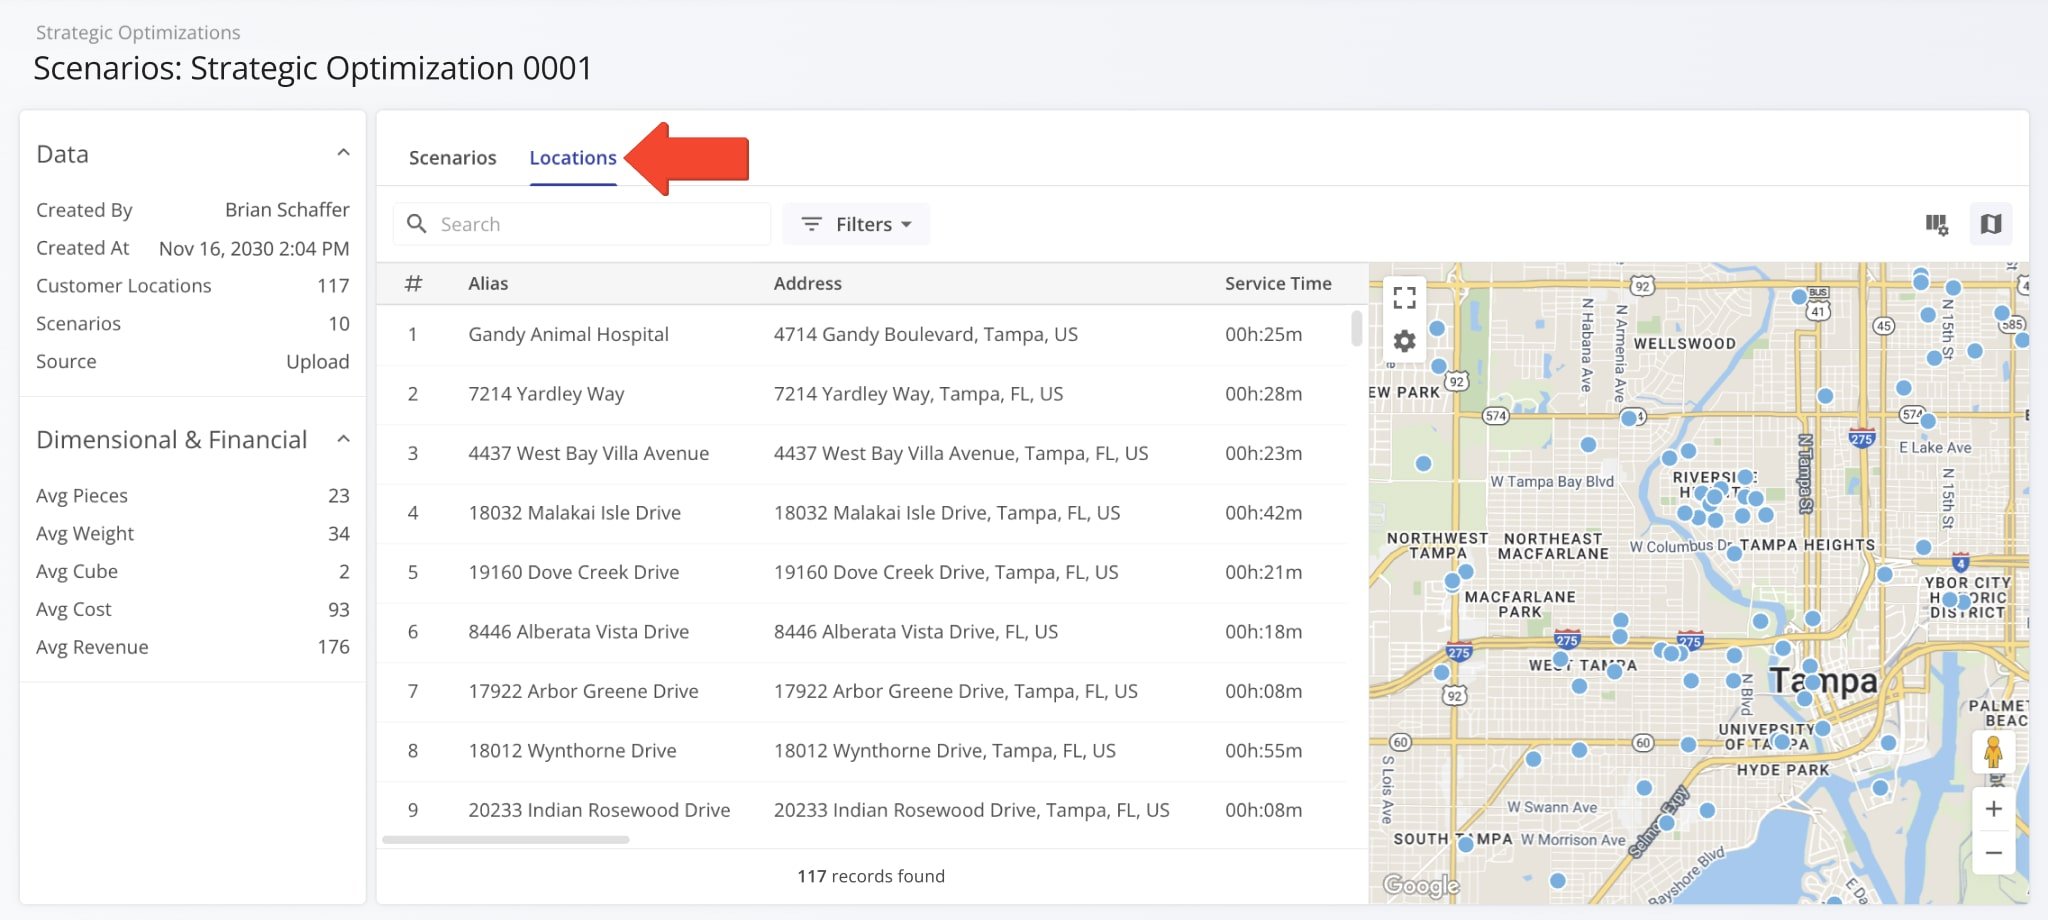
Click the “Locations” tab to see the Customer Locations associated with the Strategic Optimization and its Scenarios. Additionally, here’s where you can find data relating to the visit frequency and pattern of each location.
Customize Scenario Data Columns And Settings
Just like Strategic Optimizations, you can customize the data shown for your Scenarios. To do so, click the Display Columns Button and check the boxes next to the columns you wish to enable. After that, you can change their positions by dragging column names. Accordingly, columns listed from top to bottom are displayed from left to right on the “Scenarios” page. Click the “Apply” button to save your data column settings.
The “Scenarios” and “Locations” tabs support different data columns. See the table below for more information about each tab’s supported columns.
Column | Description | |
---|---|---|
Overview | ||
Description | Functions as the alias of a scenario and includes schedule details and parameters. | |
Status | Current status of the scenario depending on whether it was accepted. If a scenario hasn’t been accepted, it will have the “Pending” status. | |
Optimization Period | The period of time across which scenario routes will be scheduled. | |
Route & Destination Metrics | ||
Routes | Number of routes included in the scenario. | |
Destinations | Number of visits to be planned for routes in the scenario | |
Created Routes | Total number of scenario routes that have been successfully created. | |
Ad Hoc Created Routes | Total number of planned routes imported as ad-hoc routes. | |
Master Created Routes | Total number of planned routes imported as Master Routes for Recurring Routing. | |
Failed Routes | TBD | |
Accepted | Date on which the scenario was accepted. | |
Created Routes % | Percentage of scenario routes that have been successfully created. | |
Ad Hoc Created Routes % | Percentage of planned routes imported as ad-hoc routes. | |
Master Created Routes % | Total number of planned routes imported as Master Routes for Recurring Routing. | |
Failed Routes % | TBD | |
Duration Metrics | ||
Avg Duration per Route | Average duration of routes in the scenario. | |
Total Duration | Total duration of routes in the scenario. | |
Total Travel Duration | Total combined duration of scenario route travel time. | |
Total Service Duration | Total duration of route Service Time in the scenario. | |
Avg Time Δ Destinations | Average travel time between scenario route destinations. | |
Total Travel Duration % | Percentage of total route duration spent as Travel Time. | |
Total Service Duration % | Percentage of total route duration spent as Service Time. | |
Distance Metrics | ||
Avg Distance per Route | Average travel distance of routes in the scenario. | |
Total Distance | Total combined distance of scenario routes. | |
Avg Distance Δ Destinations | Average travel distance between scenario route destinations. |
Open And Accept Scenario Route Plans For Regular Or Recurring Routing
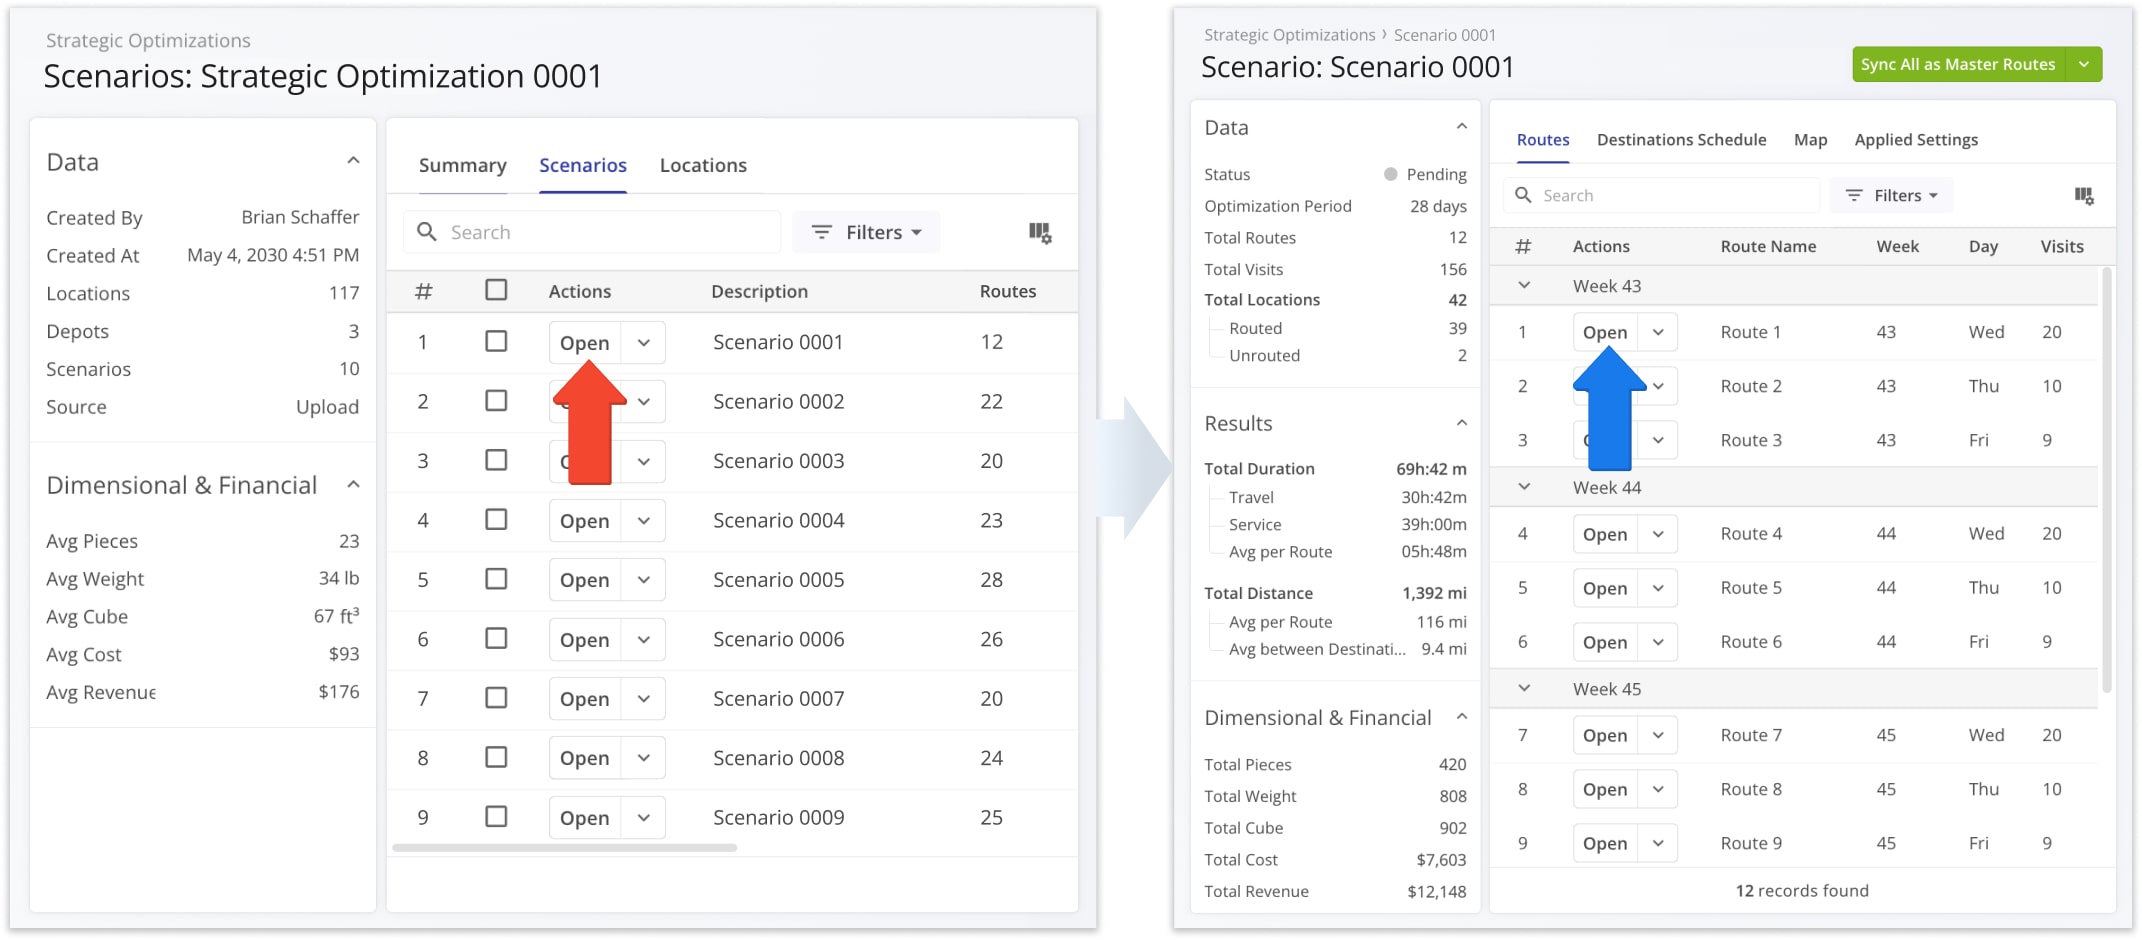
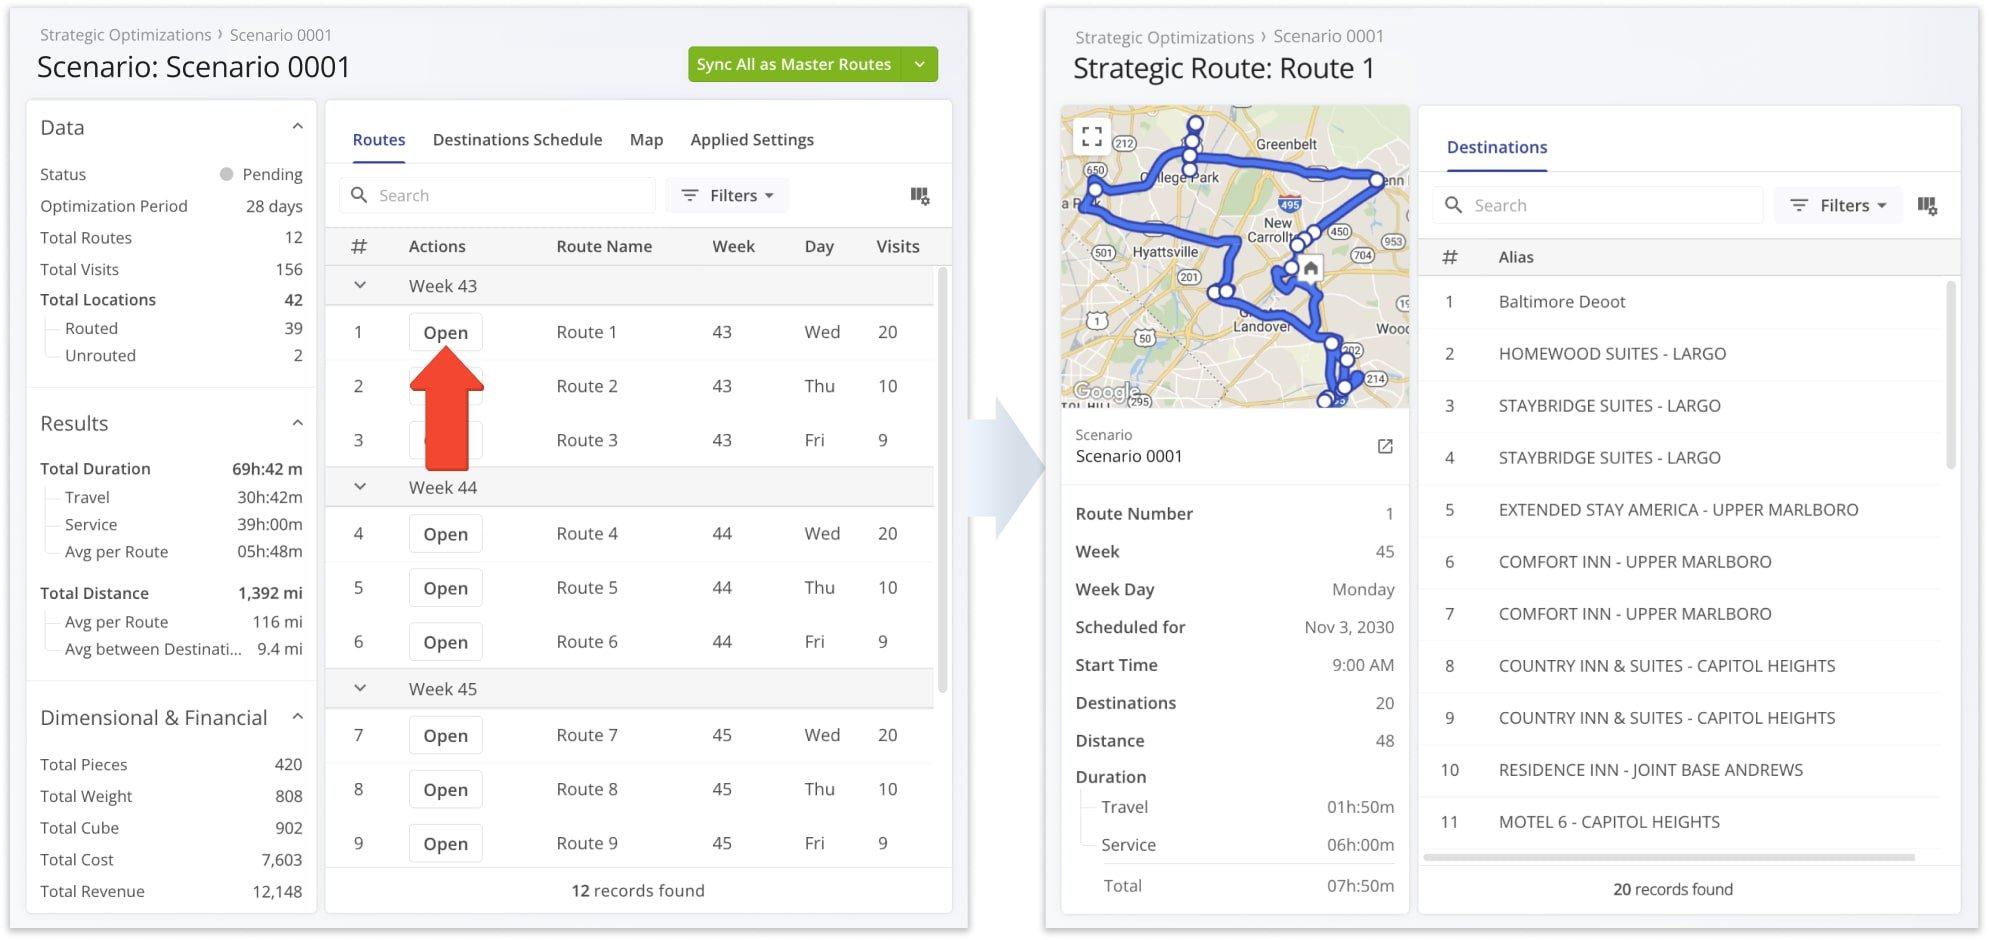
To see detailed information about a Scenario’s associated Route Plans, click the “Open” button next to a Scenario. This enables you to evaluate Strategic Scenarios in detail before accepting and adding routes to your account.
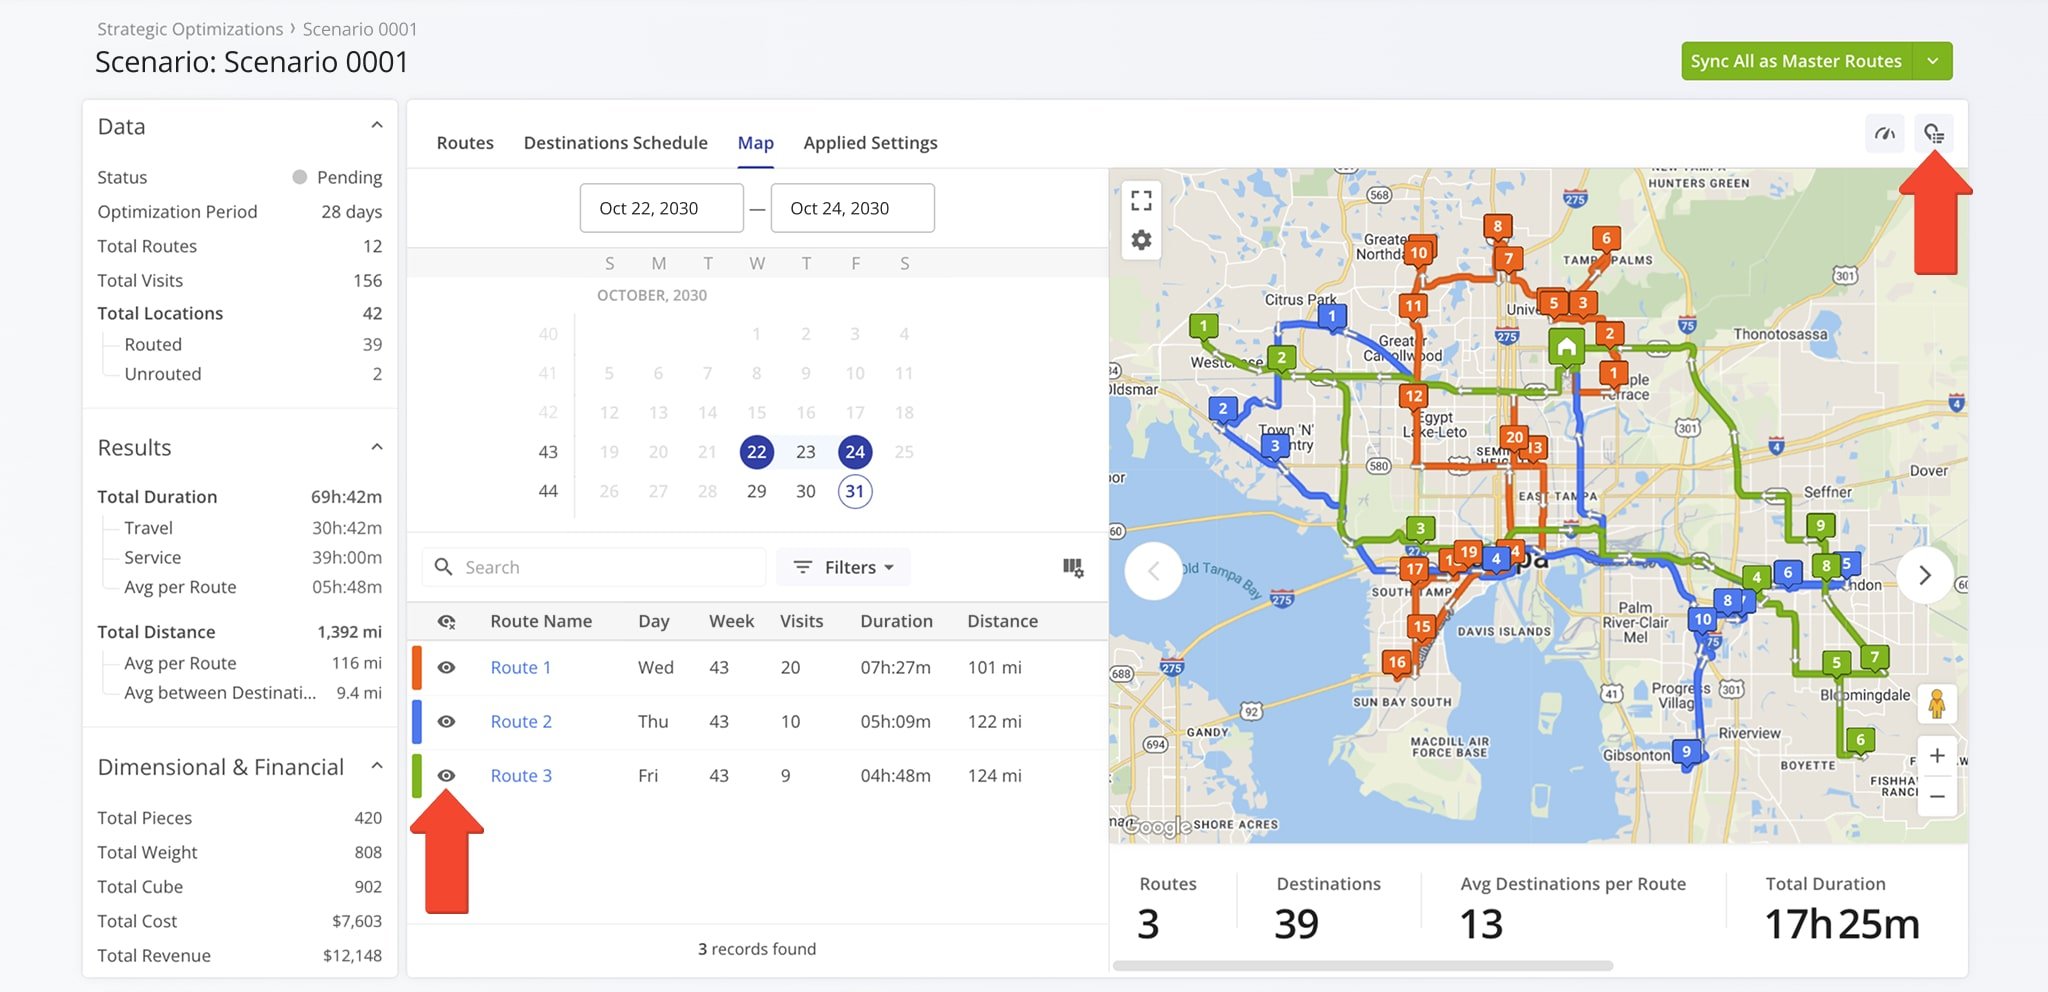
Once you open a Scenario, you can see the routes associated with it, including details like start time, planned distance and duration, number of destinations, etc. The combined totals for these metrics are shown in the Summary Panel on the left. For your convenience, Scenario Routes are grouped by week, giving you an overview of their recurring schedules and visitation patterns.
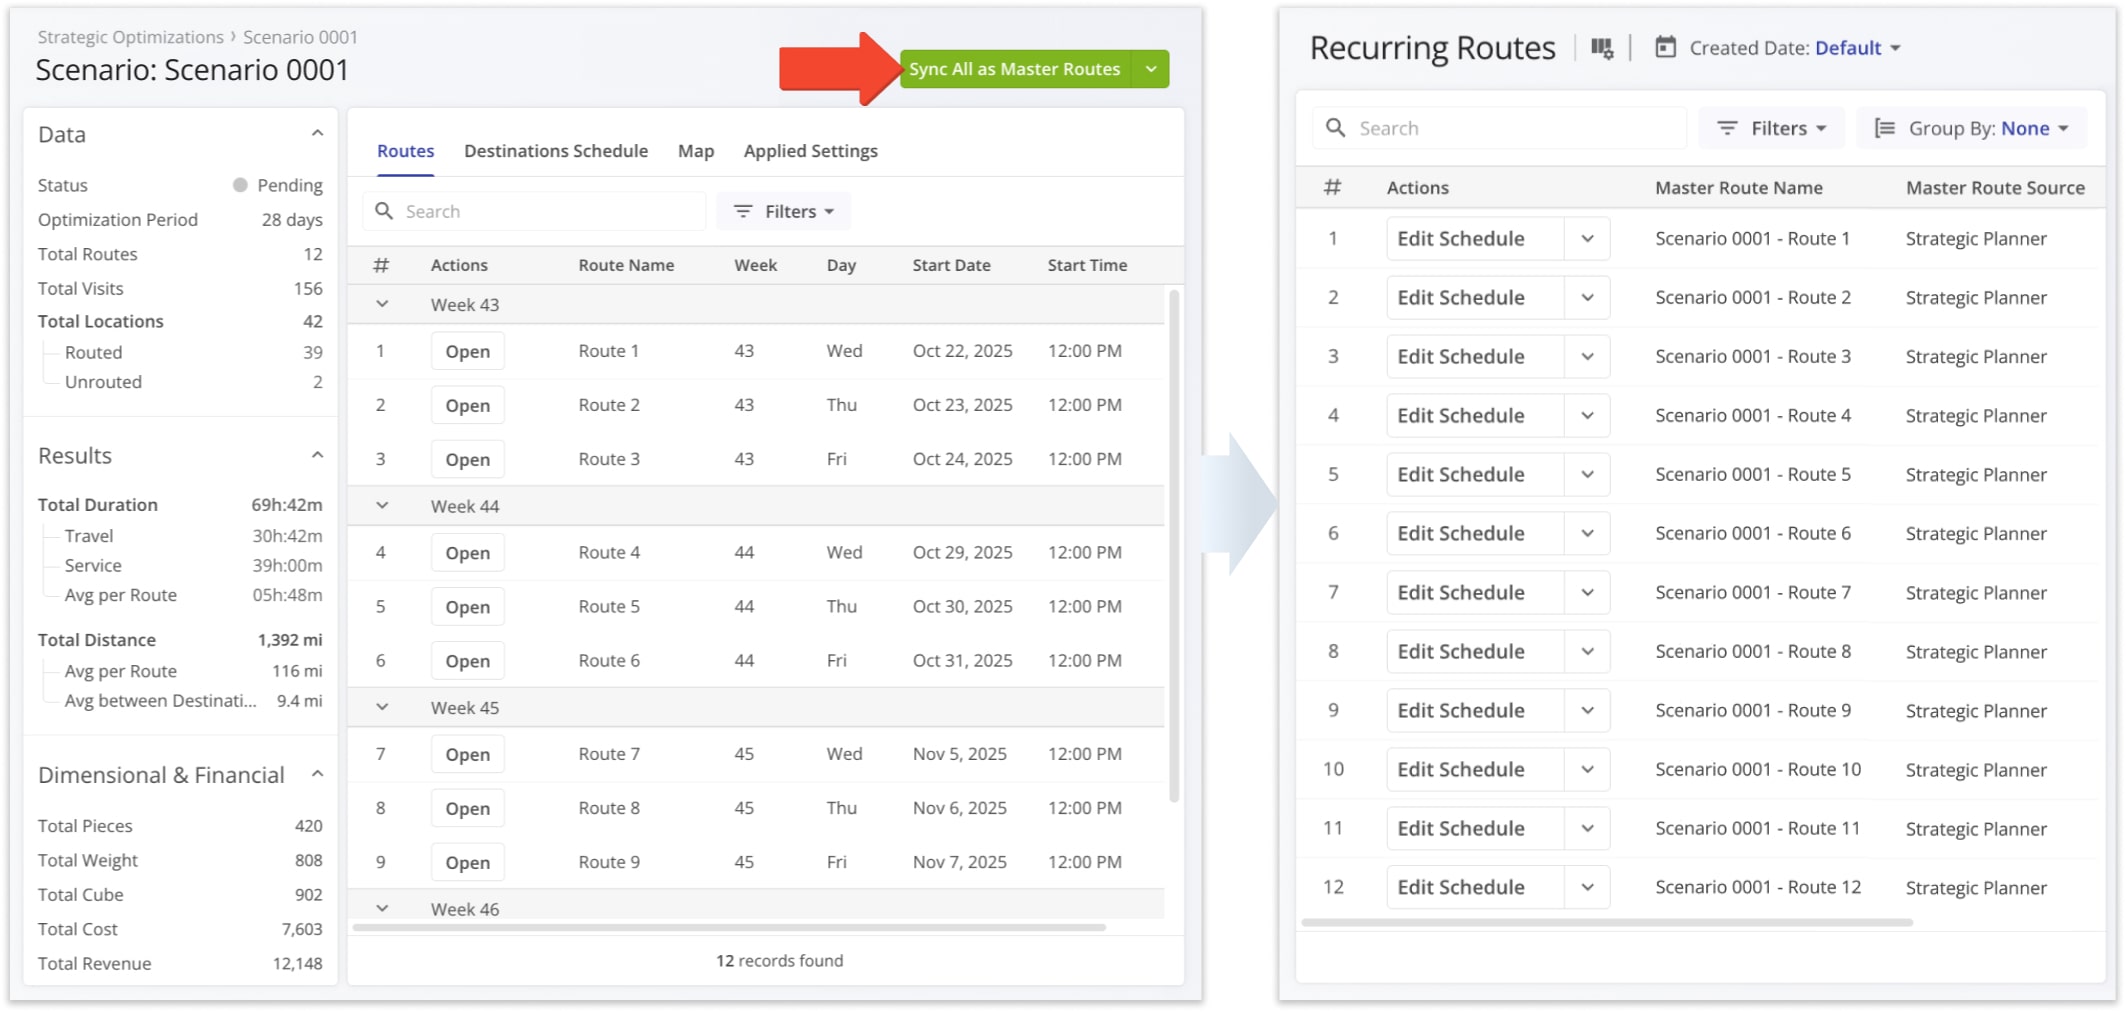
If the Scenario Route Plans meet your requirements, simply click the “Import All as Master Routes” button to add those routes to your account as Master Routes for Recurring Schedules. Alternatively, click the Down Arrow button to add the routes to your account as ad-hoc, non-recurring routes. NOTE: Non-recurring routes will be scheduled for the dates and times shown in the Scenario and won’t repeat.
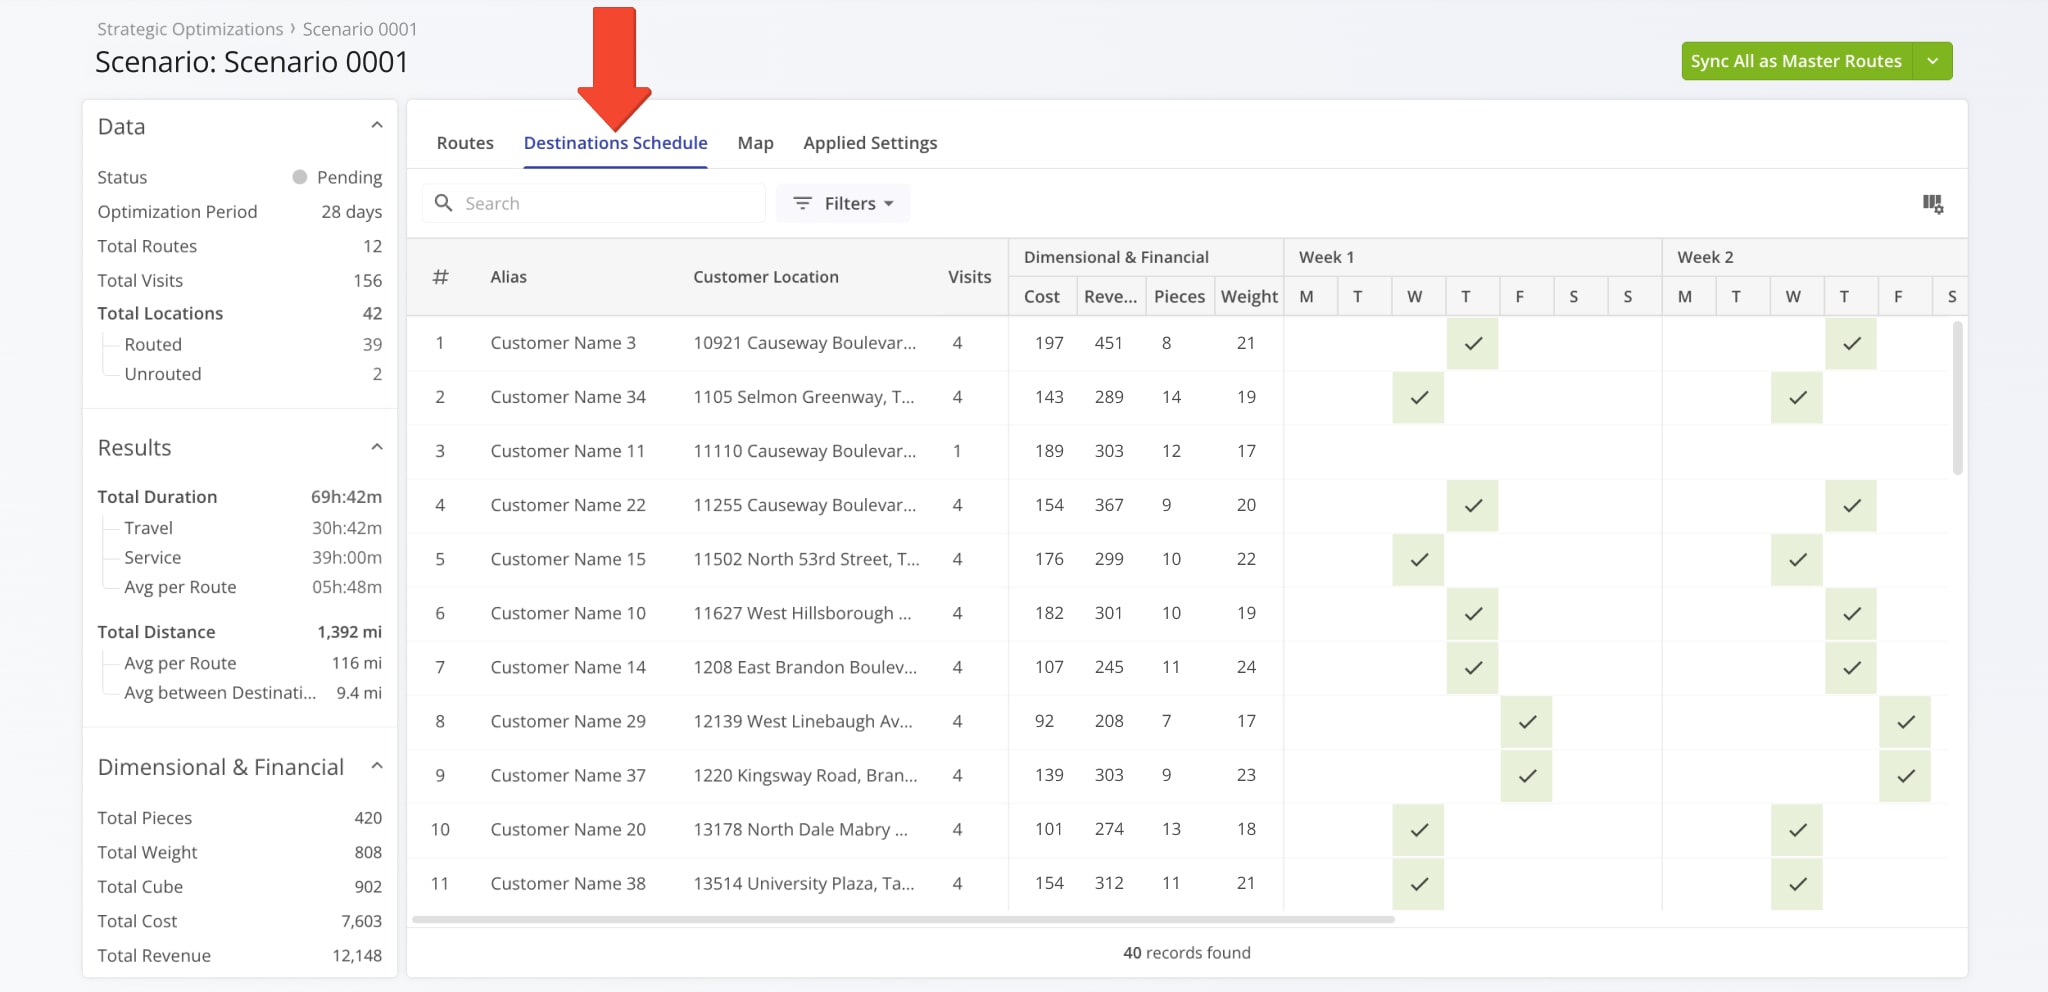
To get a detailed breakdown of the visitation frequency and schedules for all destinations included in a Scenario, click the “Destinations Schedule” tab. Here, you can see the Customers and Customer Locations associated with destinations in the Scenario Route Plans. Additionally, you can see the visitation frequency and weekday schedules of each destination.
Customize Route Plan Data Columns And Settings
You can easily customize the data shown for your route plans. This streamlines the process of evaluating a Strategic Scenario and simplifies decision-making. To do so, click the Display Columns Button and check the boxes next to the columns you wish to enable. After that, you can change their positions by dragging column names. Accordingly, columns listed from top to bottom are displayed from left to right on a Scenario’s page. Click the “Apply” button to save your data column settings.
The “Routes” and “Destination Schedules” tabs support different data columns. See the table below for more information about each tab’s supported columns.
Column | Description | |
---|---|---|
Route | ||
Route Name | Name or alias of the routes. You can use a route’s name to easily find it in other Route4Me interfaces. | |
Week | For how many weeks the route will be planned when scenario routes are accepted. | |
Day | For which days of the week the route will be scheduled when scenario routes are accepted. | |
Start Date | Date for which the route will be scheduled when scenario routes are accepted. | |
Start Time | Time for which the route will be scheduled when scenario routes are accepted. | |
Destinations | Total number of destinations that will be included in the route when scenario routes are accepted. | |
Duration & Distance Metrics | ||
Duration | Total duration of the route, including travel time and Service Time. | |
Distance | Total distance of the route. | |
Avg Δ Destinations | Average distance between destinations on the route. | |
Avg Time Δ Destinations | Average travel time between destinations on the route. |
Visit Route4Me's Marketplace to Check out Associated Modules:
- Operations
Audit Logging and Activity Stream
- Operations
Custom Data Add-On
- Operations
Advanced Team Management Add-On
Last Updated: