Participants Route Summary and Comparison – Optimization4Me
An Affiliate is a Route4Me partner who has the Route4Me Operational Assessment (OA) system integrated into their business or organization for analyzing their customers or a reseller who rebrands Route4Me’s services and offers them to end-users, as well as uses the Route4Me OA system for attracting new customers by showing them the value of optimization. Participants are the customers (companies/businesses) or end-users associated with the given Route4Me Affiliate. As an Affiliate, you can view the Report (Estimated Savings With Route4Me) of each Participant associated with your Route4Me OA Affiliate account. In the Route Summary section of the Participant’s Report, you can view how the Participant’s raw tracking data was processed by the Route4Me OA to detect and generate the Actual (Baseline), As-Is, and Optimized routes. The Participant’s Actual (Baseline) data is the raw tracking data imported from the Participant’s Telematics Connection established between the given Participant and this Participant’s Telematics Vendor through the Route4Me Telematics Gateway. The As-Is and Optimized data is the Participant’s telematics tracking data that is partially or fully optimized by the Route4Me OA to show the potential Savings this Participant can get by optimizing their routes. To learn more about exporting your Participants’ Route Summary data, visit this page. To learn more about viewing and exporting your Participants’ Business Summary, visit this page.
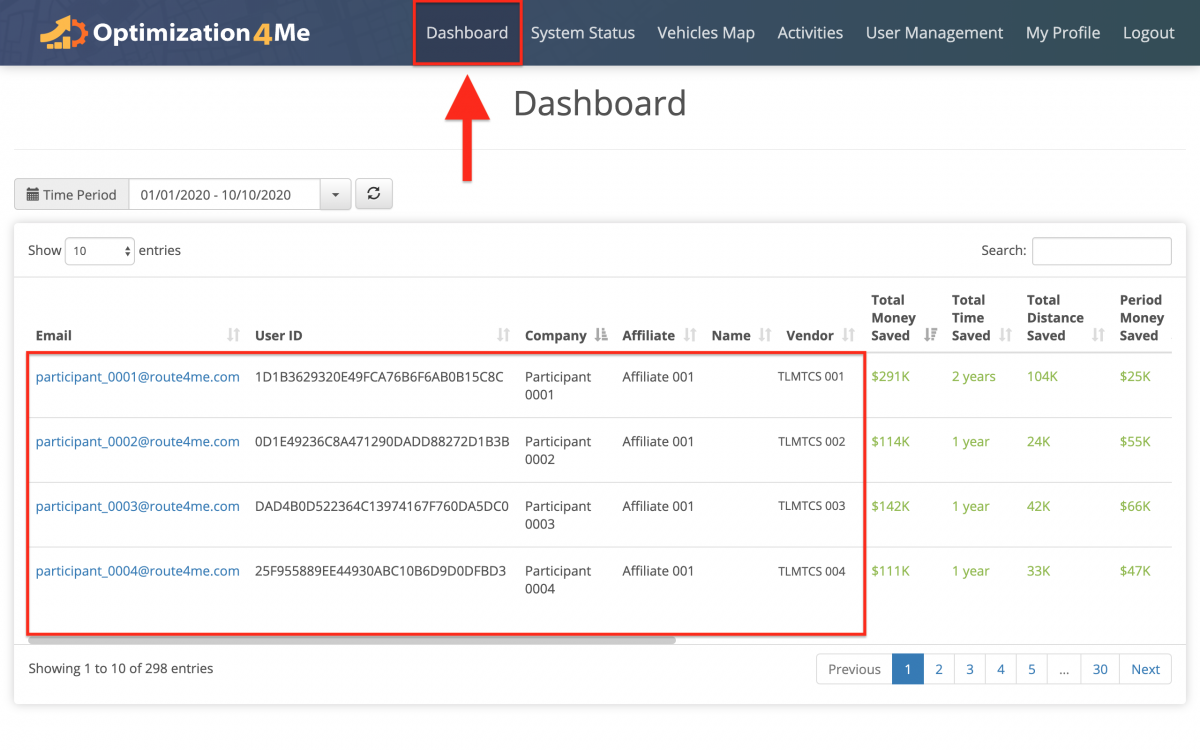
To view the Route Summary of the Operation Analysis Report of a particular Participant, as an Affiliate, first, open your Affiliate Dashboard with all Participants in your organization. To do so, go to “Dashboard” from the navigation menu at the top. To learn more about using the Affiliate Dashboard, visit this page.
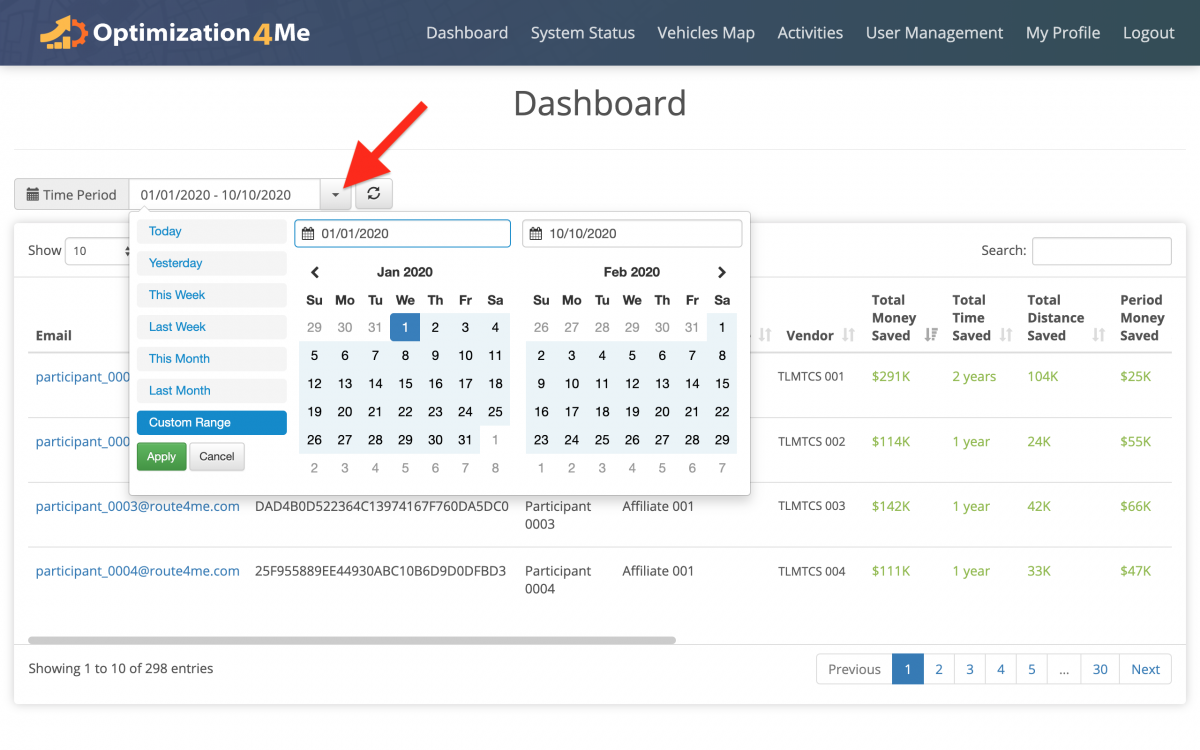
NOTE: Next, use the calendar to filter the data of all Participants displayed on your Affiliate Dashboard by date.
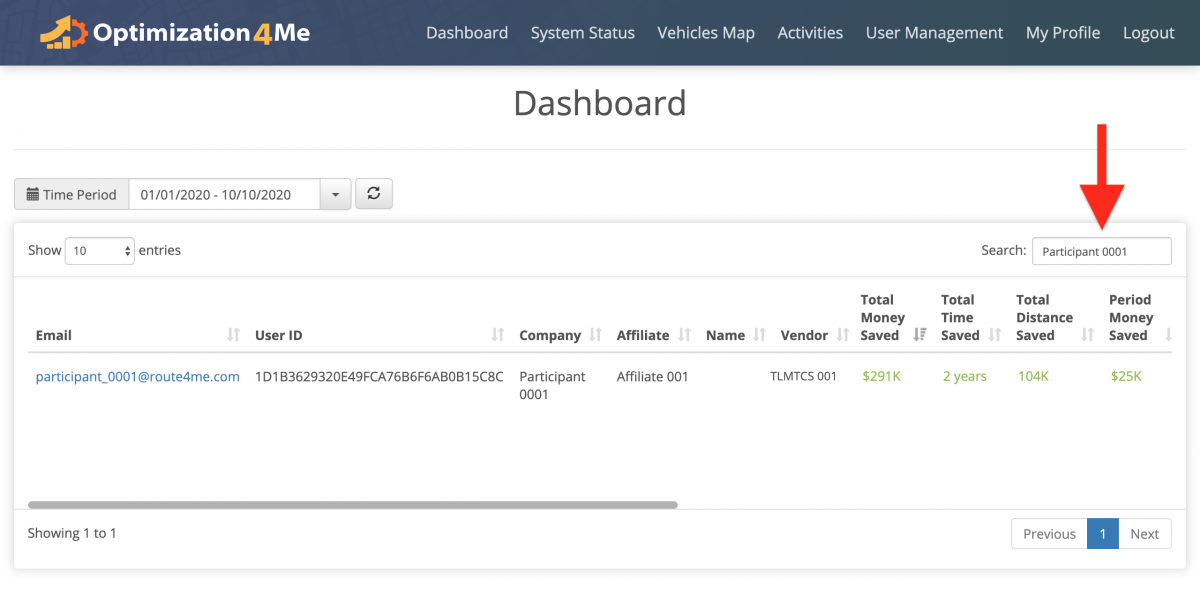
You can use the search in the top right corner of the screen to find Participants by their attributes (i.e., associated email address, internal User ID, company name, etc.).
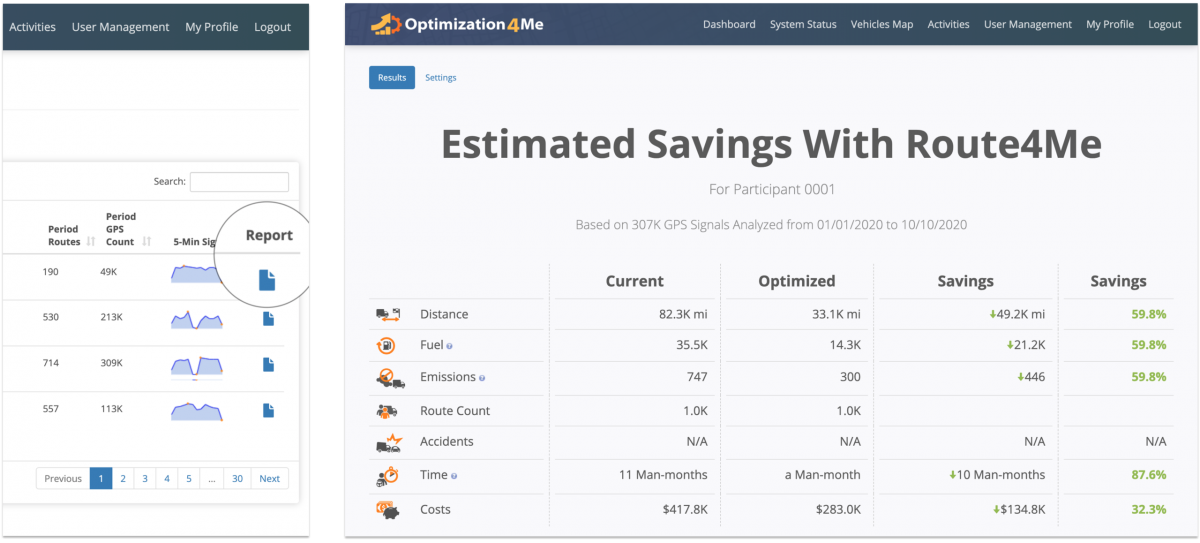
To open the OA Report of a particular Participant from your Affiliate Dashboard, click on the folder/report icon in the “Report” column next to the corresponding Participant.
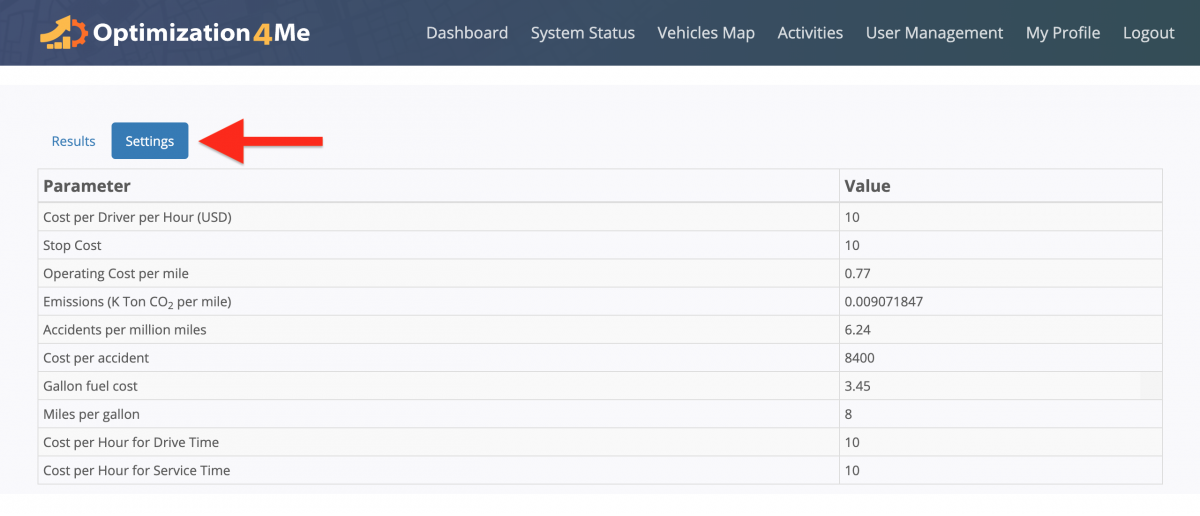
To adjust the Report Settings (Business and Route Summary parameters), first, click on the “Settings” button in the top left corner of the opened Participant Report. In the Report Settings, you can define values for the following Report parameters:
| Parameter | Description |
|---|---|
| Cost per Driver per Hour (USD) | The average amount of money paid to a driver per one hour (in USD). |
| Stop Cost | The average cost of making one route stop. |
| Operating Cost per Mile | The average operating cost per one on-road mile/one mile of driving. |
| Emissions (K Ton CO2 per Mile) | The average amount of carbon dioxide (CO2) emissions produced per one mile (K Ton CO2 per Mile). |
| Accidents per Million Miles | The average number of accidents per one million of on-road miles. |
| Cost per Accident | The average cost per one accident (in USD). |
| Gallon Fuel Cost | The average cost per one gallon of fuel (in USD). |
| Miles per Gallon | The average amount of miles driven per one gallon of fuel. |
| Cost per Hour for Drive Time | The average cost of one hour of driving (travel cost). |
| Cost per Hour for Service Time | The average cost per one hour of service time (onsite service time). |
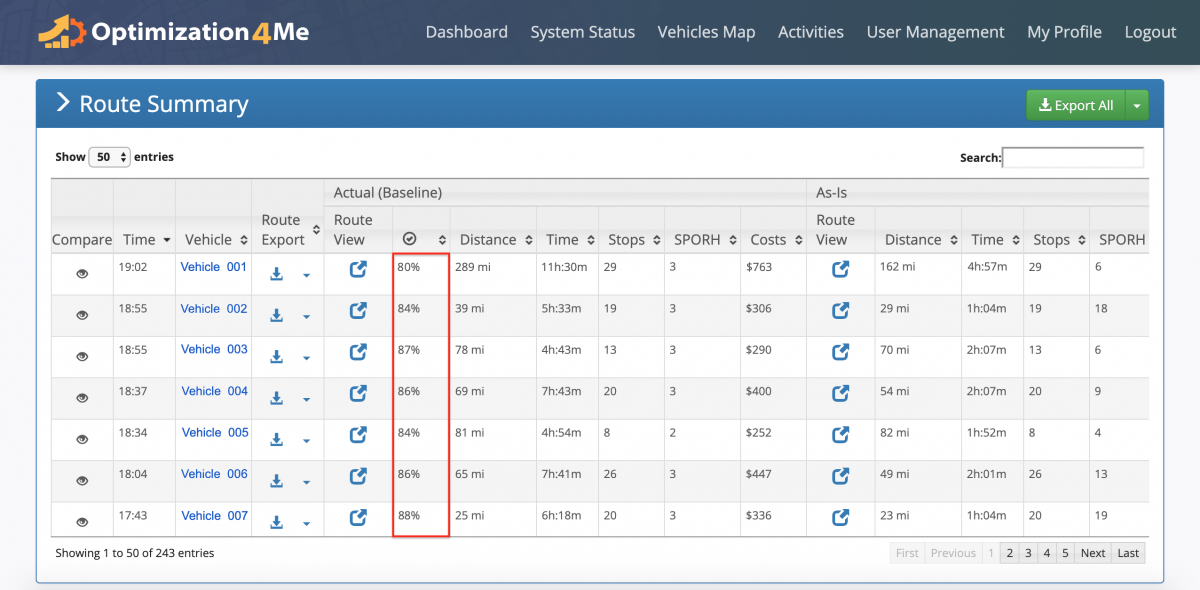
In the Participant’s OA Report Route Summary, you can see all routes detected and generated by the Route4Me OA from the tracking data imported into the Participant’s OA account from the associated telematics device(s) through the Route4Me Telematics Gateway.
- In the checkmark icon column of the Participant’s Route Summary, you can see the precision percentage with which the corresponding routes were detected and generated by the Route4Me OA.
- In the SPORH column, you can see the estimated number of stops visited per one on-road hour.
Actual (Baseline) Routing Data
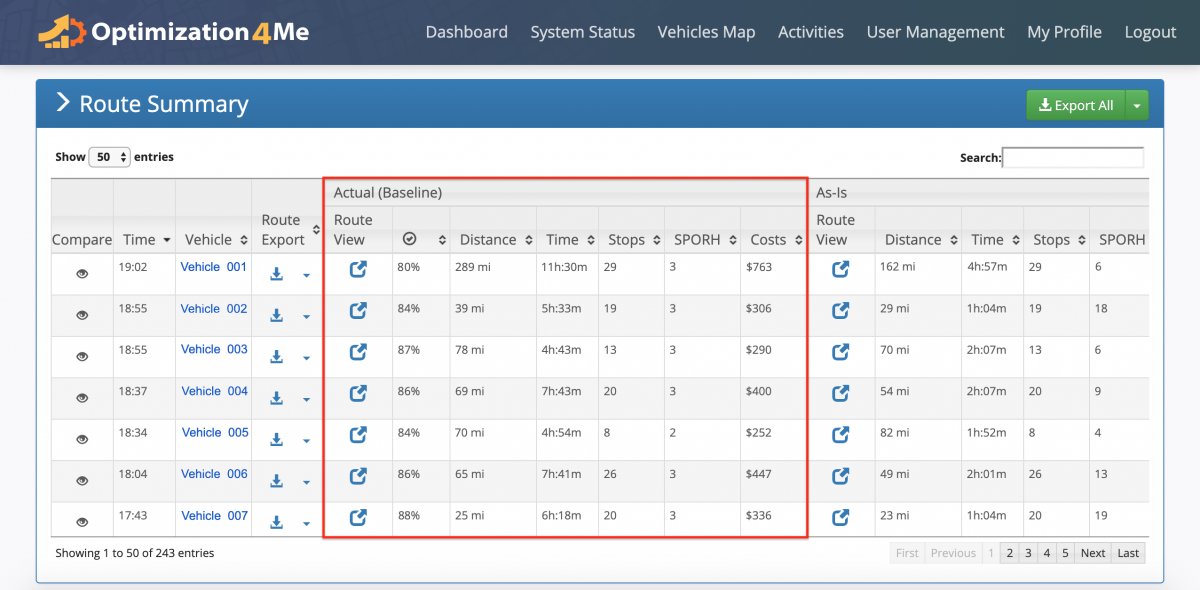
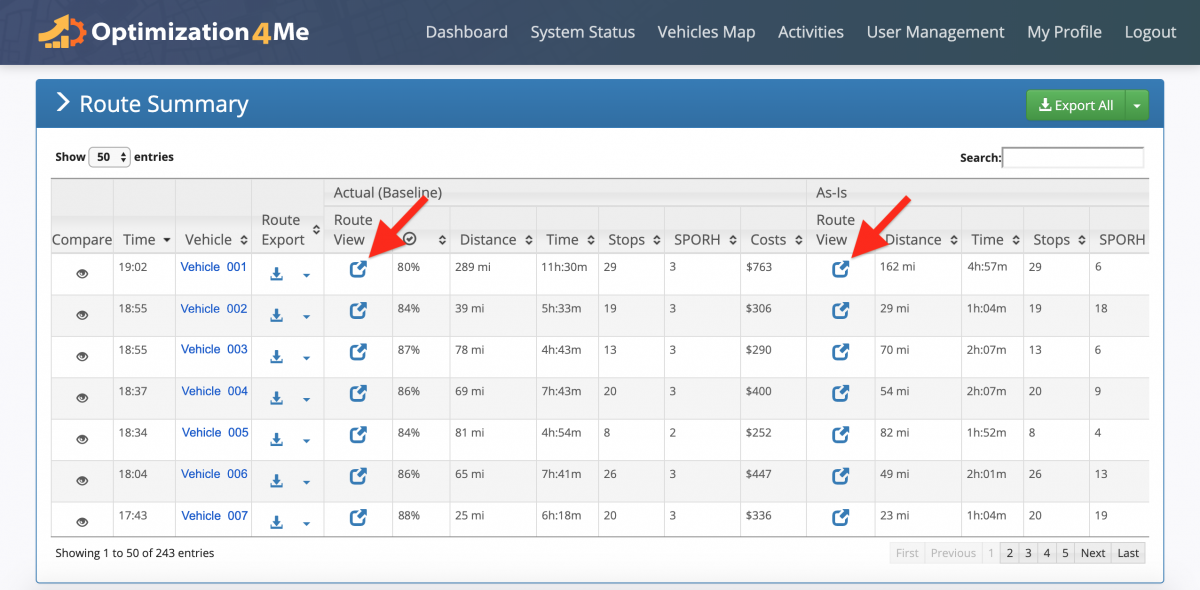
In the Actual (Baseline) section of the Participant’s Route Summary, you can see the raw routing data that was captured by the Participant’s telematics device(s) (GPS devices, Route4Me’s iOS or Android mobile apps, etc.) and imported into the Participant’s Operational Assessment account through the Route4Me Telematics Gateway without any changes or modifications (no optimization). The Actual (Baseline) routing data shows how the Participant’s detected route(s) were actually driven in real life by the associated vehicle(s).
As-Is + Savings
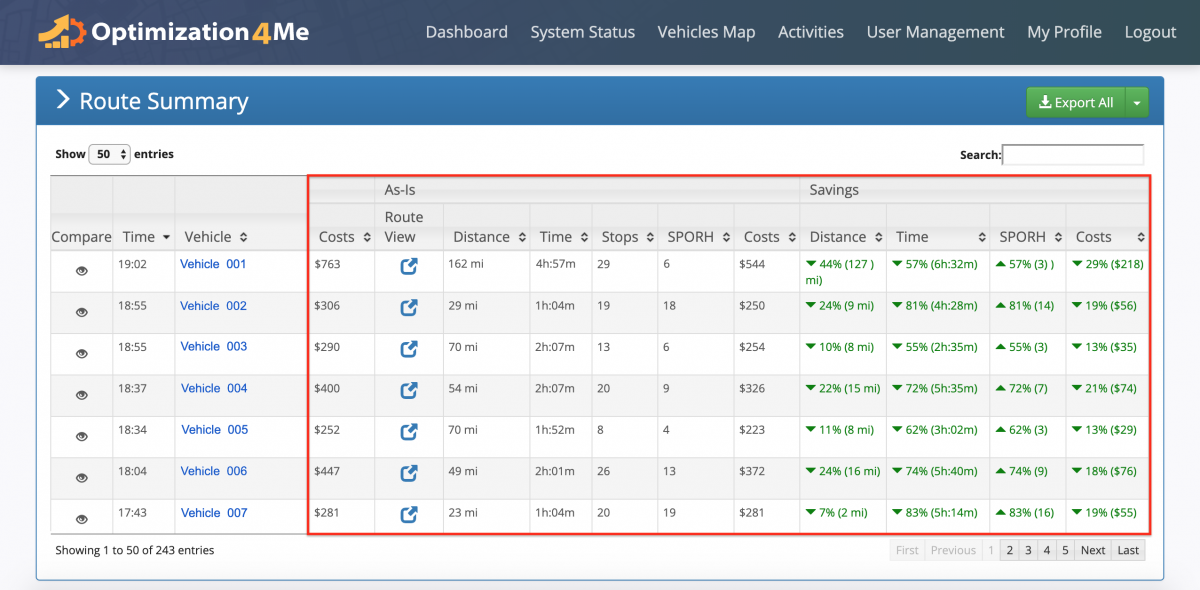
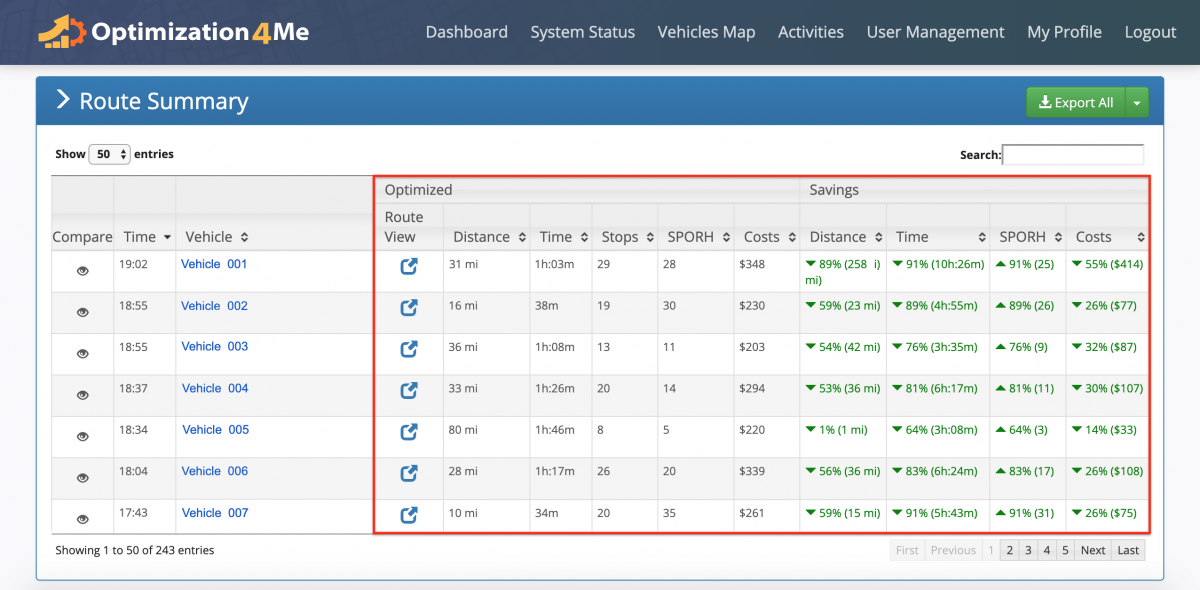
In the As-Is section of the Participant’s Route Summary, you can see the routing data that was captured by the Participant’s telematics device(s), imported into the Participant’s Operational Assessment account through the Route4Me Telematics Gateway and then optimized for the shortest directions only. The As-Is routing data shows the same sequence of stops that was actually driven on each detected route in real life but with optimized driving directions (the shortest driving route path). In the Savings section associated with the As-Is section of the Participant’s Route Summary, you can see the Distance, Time, SPORH, and Costs savings generated by optimizing the imported raw routing data for the most optimal driving directions only (no stops sequence optimization).
Optimized + Savings
In the Optimized section of the Participant’s Route Summary, you can see the routing data that was captured by the Participant’s telematics device(s), imported into the Participant’s OA account through the Route4Me Telematics Gateway and then fully optimized. The Optimized routing data shows the most efficient and optimal results that can be achieved by optimizing the Participant’s raw routing data for the shortest driving directions/shortest driving route path, and the most efficient sequence of detected route stops. In the Savings section associated with the Optimized section, you can see the Distance, Time, SPORH, and Costs savings generated by fully optimizing the imported raw routing data for the most efficient driving directions (the shortest driving route path) and the most optimal sequence of detected route stops.
To open an Actual (Baseline), As-Is, or an Optimized version of a particular detected route in full-screen in another tab, click on the Route View icon next to the preferred route.
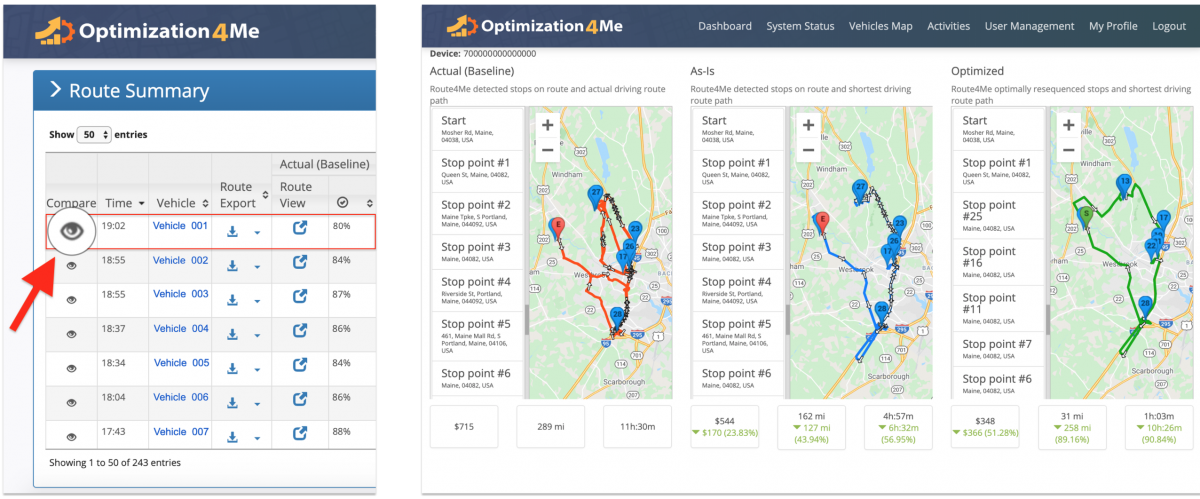
To open the Actual (Baseline), As-Is, and Optimized versions of a particular detected route one next to another, click on the “Compare” icon next to the corresponding routes. The Multiple Route Comparison tool allows you to view all three versions (Actual (Baseline), As-Is, and Optimized) of the same detected route and compare the Distance, Time, and Money parameters and savings of all three versions on the same screen.
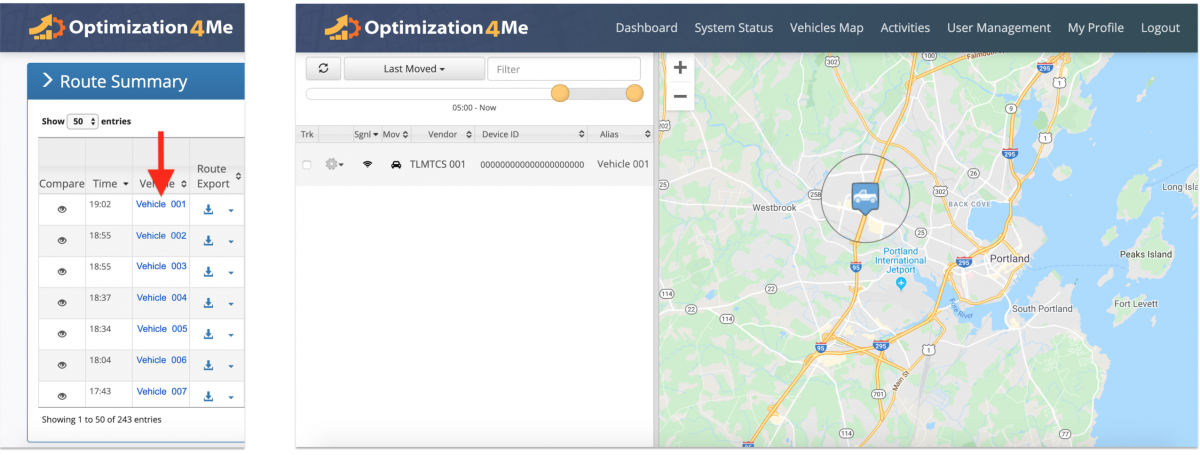
To view the current location of the vehicle associated with a particular detected route in the Participant’s Route Summary, click on the name of the corresponding vehicle in the “Vehicle” column. After that, you can view the vehicle associated with the corresponding route on the OA Vehicles Map. To learn more about using the OA Vehicles Map, visit this page.
Visit Route4Me's Marketplace to Check out Various Modules and Add-Ons:
- Operations
Advanced Team Management Add-On
